Ancient giants: on the farthest galaxy at
Abstract
The observational frontiers for the detection of high-redshift galaxies have recently been pushed to unimaginable distances with the record-holding Lyman Alpha Emitter (LAE) UDFy-38135539 discovered at redshift . However, the physical nature and the implications of this discovery have yet to be assessed. By selecting galaxies with observed luminosities similar to UDFy-38135539 in state-of-the-art cosmological simulations tuned to reproduce the large scale properties of LAEs, we bracket the physical nature of UDFy-38135539: it has a star formation rate yr-1, it contains of stars 50-80 Myr old, with stellar metallicity . For any of the simulated galaxies to be visible as a LAE in the observed range, the intergalactic neutral hydrogen fraction at must be and extra ionizing radiation from sources clustered around UDFy-38135539 is necessary. Finally, we predict that there is a 70% (15%) probability of detecting at least 1 such source from JWST (HST/WFC3) observations in a physical radius Mpc around UDFy-38135539.
keywords:
cosmology: theory, galaxies: individual, galaxies: high redshift; galaxies: intergalactic medium1 Introduction
The earliest galaxies which ushered in the era of the cosmic dawn changed the state of the intergalactic medium (IGM) out of which they formed in numerous ways: they polluted it with heavy elements, heated and (re)ionized it, thereby affecting the evolution of all subsequent generations of galaxies. We are now in the golden era for the search for such galaxies, made possible by the use of ingenious selection techniques. The first of these, the standard dropout technique (e.g. Steidel et al. 1996; Giavalisco et al. 2004) relies on broad band filters to detect the Lyman break at 912 Å in the galaxy rest frame. Although galaxy candidates have been detected upto (Bouwens et al. 2009) using this method, it has the drawback that the exact source redshift cannot be determined with complete confidence. In this respect, searches for the Lyman Alpha (Ly) line at 1216 Å (in the galaxy rest frame) using narrow band filters have been far more successful in confirming the detection of high-redshift galaxies; specific spectral signatures including the strength, width and continuum break bluewards of the Ly line make the detection of LAEs (galaxies showing a strong Ly line) rather unambiguous. Narrow band searches have enabled the confirmation of hundreds of LAEs in a wide high-redshift range, at (Malhotra et al. 2005; Shimasaku et al. 2006), (e.g. Kashikawa set al. 2006) and (e.g. Vanzella et al. 2010). Using the same technique, recently, a LAE, designated UDFy-38135539, has been confirmed at (Lehnert et al. 2010), making it the farthest astrophysical object known so far; it has overtaken the redshift record of set by the Gamma Ray Burst GRB090423 (Salvaterra et al 2009; Tanvir et al. 2009).
This object has already been observed by a number of groups: Lehnert et al. (2010) have observed both the Ly and ultraviolet (UV) luminosity for UDFy-38135539, and Finkelstein et al. (2010) have obtained broad band UV and Spitzer data points for this galaxy, designated ID 125 in their work. However, the physical nature of the galaxy and the cosmological implications of its discovery have yet to be assessed. In this work, we use state-of-the-art cosmological simulations coupled to a previously developed LAE model (Dayal, Ferrara & Gallerani 2008; Dayal et al. 2009; Dayal, Ferrara & Saro 2010), tuned to reproduce a number of observables of LAEs, to bracket the physical properties of UDFy-38135539. We use the observed Ly luminosity to get a hint on the ionization state of the IGM at , calculate how much this galaxy could have contributed to reionization and make predictions for the number of Lyman Break Galaxies (LBGs) that could be detected in its vicinity.
2 Theoretical model
We start from the analysis of a snapshot of a set of cosmological simulations carried out using the TreePM-SPH code GADGET-2 (Springel 2005) with the implementation of chemodynamics as described in Tornatore et al. (2007). The periodic simulation box has a comoving size of and initially contains particles each of dark matter (DM) and gas. The masses of the DM and gas particles are and , respectively. For each “bona-fide” galaxy (which has at least 20 bound particles; see Saro et al. 2006 for details) in the simulated volume at , we compute the DM halo/stellar/gas mass, star formation rate (SFR), mass-weighted age, gas/stellar metallicity, and gas temperature. The adopted cosmological model for this work corresponds to the CDM Universe with , , km s-1 Mpc-1 and , thus consistent with the 5-year analysis of the WMAP data (Komatsu et al. 2009). Complete details of these simulation runs can be found in Dayal et al. (2009).
2.1 Intrinsic luminosities and dust
Star forming galaxies produce their intrinsic Ly line and UV continuum luminosities ( and , at restframe wavelengths Å and Å, respectively) both via stellar (and nebular) emission, and cooling radiation from collisionally excited neutral hydrogen (H ) in their interstellar medium (ISM). While the spectral energy distributions (SEDs) are obtained using the population synthesis code STARBURST99 (Leitherer et al. 1999) to calculate the stellar and nebular emission, the latter depends on the temperature distribution in the ISM gas. The interested reader is referred to previous work (Dayal, Ferrara & Saro 2010) for a comprehensive discussion.
As Ly and continuum photons are efficiently absorbed by dust grains, we calculate the dust content of each galaxy by considering SNII to be the main dust producers; this is justified by the fact that the typical evolutionary time-scale of evolved stars ( Gyr) becomes longer than the age of the Universe above (Todini & Ferrara 2001). We further pose that: (i) of dust is produced per SNII (Todini & Ferrara 2001; Nozawa et al. 2007), (ii) SNII destroy dust in forward shocks with an efficiency of about 40% (McKee 1998; Seab & Shull 1983), and (iii) a homogeneous mixture of gas and dust is assimilated into further star formation. To calculate the dust optical depth, , to UV continuum photons, based on the results obtained at , we assume that dust is made up of carbonaceous grains and spatially distributed as the stars (Dayal, Ferrara & Saro 2010). The fraction of continuum photons escaping the galaxy undamped by dust is then . The analogous quantity for Ly photons is taken to be so as to obtain the maximum possible Ly luminosity emerging from the galaxy itself.
2.2 IGM transmission and source clustering
After escaping out of the galactic environment, Ly photons are further attenuated as they travel through the IGM. Depending on the intergalactic hydrogen ionization state, only a fraction of the Ly photons emerging out of a galaxy undamped by dust reaches the observer (continuum photons are instead unaffected by the IGM); hence depends upon the IGM ionization state. Since this value is largely unconstrained, we explore 6 different values of the average IGM H fraction at : . For each value of , we compute the nominal radius, , of the spherical, ionized HII region around each simulated galaxy. In reality, though, due to source clustering (i.e. when the separation between any two galaxies becomes smaller than either of their ionized region radii), multiple galaxies can contribute ionizing photons to the same ionized region, which will then be characterized by an effective radius, , calculated as follows. Suppose galaxies ‘A’ and ‘B’, and ‘B’ and ‘C’ have overlapping ionized regions. Then, the effective ionized volume ‘A’ is embedded in is the sum of the ionized volumes of ‘A’, ‘B’ and ‘C’; the same holds true for both ‘B’ and ‘C’. Within this ionized volume, the total photoionization rate at distance from ‘A’, is
where the terms on the right hand side represent the photoionization rate from (i) the direct radiation from ‘A’, (ii) the galaxies clustered around ‘A’ and (iii) the ultraviolet background (UVB) from distant galaxies, respectively. The UVB photoionization rate is related to by where is the mean IGM hydrogen number density and is the case-B hydrogen recombination coefficient. Further, , is the specific ionizing luminosity emerging from ‘A’ and is the escape fraction of H ionizing photons (Gnedin et al. 2008), is the ionizing luminosity emerging from the galaxy of the total ‘N’ galaxies with which ‘A’ shares an ionized region, is the frequency corresponding to the Lyman limit wavelength (912 Å), is the hydrogen photoionization cross-section and is the distance between galaxies and ‘A’. This procedure is carried out for each galaxy in the simulated volume. We then assume photoionization equilibrium to compute within the effective ionized region of each galaxy. At the edge of this region, we force to attain the assigned global value. We use the complete Voigt profile to calculate the optical depth of Ly photons along the line of sight to compute . The observed Ly and UV continuum luminosity are then simply (the latter equality descends from our maximal assumption ), and , respectively.
As a final step, we select galaxies that would be observable as LAEs according to the canonical criterion, and observed equivalent width Å. Among these, we further isolate those that fall within the and continuum magnitude range observed by Lehnert et al. (2010) and Finkelstein et al. (2010): using SINFONI, the former find , to , while Finkelstein et al. (2010) find a tighter bound of to . To summarize, all simulated galaxies that have and to and designated as LAEUDF in this work.
3 Results
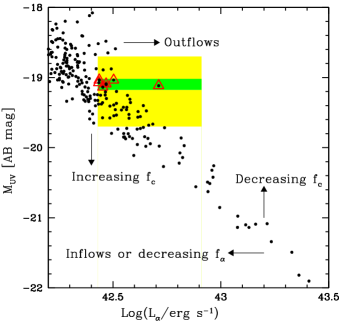
We now discuss the main results obtained from the above mentioned computations. We find that, without requiring any tuning of the model parameters, no LAEUDF are found in the simulated volume for . For , we find a total of 215 LAEs in the simulated volume, 7 of which are identified as LAEUDF as shown in Fig. 1. From now on, LAEUDF refer to the LAEs in the combined observed Ly and UV luminosity range of Lehnert et al. (2010) and Finkelstein et al. (2010) for .
We digress here to discuss the two main ingredients whose combined effects can change the slope of the relation shown in Fig. 1. The first of these concerns the dust attenuation: for any given LAE, an increase (decrease) in leads to the galaxy becoming brighter (fainter) in the UV, shifting the position of the galaxy vertically upward (downward) on the plot; a decrease in the value of (recall that we have used in our model) due to dust attenuation of Ly photons leads to a corresponding decrease in , moving the points horizontally leftward on the plot. The second effect is the change in due to peculiar velocities: inflows (outflows) of neutral gas into (from) the galaxy impart an extra blueshift (redshift) to the Ly photons, leading to a decrease (increase) in (Santos 2004; Verhamme et al. 2006; Dijkstra & Wyithe 2010; Dayal, Maselli & Ferrara 2011) moving the relation horizontally towards the left (right).
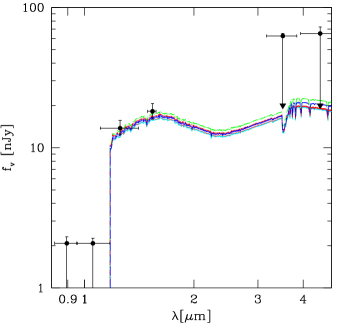
Further constraints on the LAEUDF come from the SEDs which we have obtained from STARBURST99 including dust attenuation ( ranges between 0.24-0.3 for the LAEUDF) using the supernova extinction curve (Bianchi & Schneider 2007). As shown in Fig. 2, the model SEDs are in excellent agreement with the observed data points, including the two from Spitzer at and m obtained by Finkelstein et al. (2010). The SED is a crucial constraint on the physical properties of galaxies that could be identified as LAEUDF: although for values of (for the given dust model) a larger number of galaxies would fulfill the LAEUDF selection criterion, their physical properties cannot vary too much without the SEDs becoming inconsistent with the observed one.
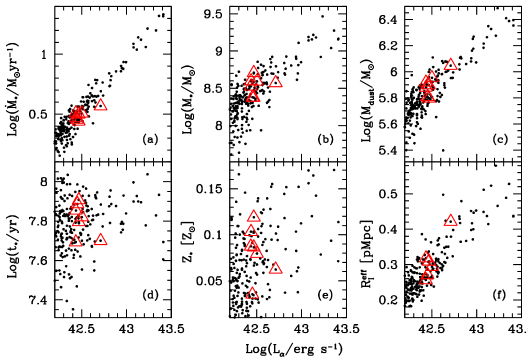
As the 7 LAEUDF galaxies closely resemble the observed properties of UDFy-38135539, it is reasonable to conclude that their physical properties should also match those of that object, which are now discussed. LAEUDF show SFRs in the range , as seen from Panel (a) of Fig. 3. These values are quite comparable to the ones inferred by Lehnert et al. (2010) from the Ly luminosity of UDFy-38135539 (). LAEUDF have stellar masses , (Fig. 3, Panel (b)); this is highly consistent with the stellar mass of found by Finkelstein et al. (2010) from best-fitting the observed SED. In terms of the halo mass, LAEUDF correspond to rare, massive mass fluctuations at and have halo masses . The LAEUDF have dust masses between as seen from Panel (c) of Fig. 3. These lead to values of for these galaxies, which translate into magnitude, which is in excellent agreement with the best fit value of magnitude derived by Finkelstein et al. (2010) for UDFy-38135539. LAEUDF have ages between 50-80 Myr (see Panel d), in good agreement with the value of 10 to a few 100 Myr inferred observationally by Lehnert et al. (2010). These ages imply that the progenitors of these galaxies started forming as early as . The stellar metallicity of LAEUDF is 0.03-0.12 (see Panel e), even at ; since heavy elements are the main constituents of grains, this is an additional argument in support of the dusty nature of these galaxies. Indeed dust seems to be required by the measured colors.
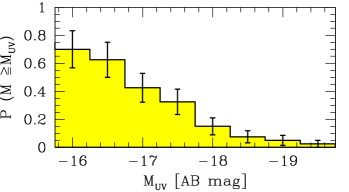
For the 7 LAEUDF, ranges between physical Mpc (pMpc), as shown in Panel (f), leading to an IGM transmission of %. If the effects of clustered sources is neglected, the nominal individual ionized bubble radius is pMpc, which makes 12%, rendering these galaxies undetectable in the Ly; the effect of source clustering is crucial for making these galaxies visible as LAEs. Although the galaxies clustered around the 7 LAEUDF are too faint to be seen in the Ly, nonetheless their UV continuum can be bright enough to be detectable via standard dropout techniques. In Fig. 4 we show the probability (at limiting magnitude ) of such clustered galaxies. Averaged over the 7 LAEUDF, there is a 70% and 15% probability of JWST and HST/WFC3 (with limits of and respectively) finding such a clustered galaxy in a radius pMpc (or 86 arcsec) at .
As for the contribution of LAEUDF to reionization, the photon rate density required to balance recombinations, , can be expressed as (Madau, Haardt & Rees 1999)
| (1) |
where is the IGM clumping factor. For the 2% HI ionizing photon escape fraction used in this work and assuming , the LAEUDF have an HI ionizing photon output ; at most, such objects could have contributed of the photons needed to balance recombinations at .
Finally, we estimate the probability of finding a LAE like UDFy-38135539 in the experimentally sampled volume (). Our simulated volume () is about 100 times larger; therefore we sample the simulated volume by randomly placing the observed volume within it. We find that only 7 of these sub-volumes contain 1 LAE similar to UDFy-38135539 for . This translates into a detection probability of only about 7%, classifying the discovery as a relatively serendipitous one.
4 Conclusions and discussion
We have constrained the IGM ionization state at . We find that without requiring any fine-tuning of the model parameters from and for the maximum possible Ly luminosity emerging from the galaxy itself, no LAE are found in the observed luminosity range of UDFy-38135539 for . For , we find 7 LAEs (designated LAEUDF) whose observed Ly and UV luminosity fall in the ranges of UDFy-38135539 (Lehnert et al. 2010) and ID 125 (Finkelstein et al. 2010). LAEUDF are observable in the Ly only because an overlapping of their H regions with those of their nearby galaxies make the effective H radius pMpc; averaged over the 7 LAEUDF, there is a 70% (15%) probability of such a clustered source being found by JWST (HST/WFC3) observations.
We have also bracketed the physical properties of UDFy-38135539: the SFR range between , it has of stars with a mass weighted age of 50-80 Myr and a mass weighted stellar metallicity between . It is dust enriched with dust masses which translates into mag and a color excess of using the supernova dust extinction curve.
We add three caveats. The first concerns uncertainties related to dust attenuation of Ly photons. As has been shown by many works (Neufeld 1991; Hansen & Oh 2006; Finkelstein et al. 2008; Dayal et al. 2009; Dayal, Ferrara & Saro 2010; Dayal, Maselli & Ferrara 2011), the relative escape fraction of Ly and continuum photons depends on the distribution (smooth/clumpy) of dust in the ISM of high- galaxies. Lacking data at to support either of the two possibilities, here we have used the maximum value of . Secondly, an increase (decrease) in the escape fraction of H ionizing photons () would decrease (increase) the intrinsic Ly luminosity, while increasing (decreasing) the sizes of the H regions built by each galaxy, thereby affecting the observed Ly luminosity. Thirdly, outflows might allow Ly photon transmission also from a substantially more neutral IGM (Dijkstra et al. 2011) than the upper limit of found here. Although interesting, such result has been obtained under the highly idealized conditions of a smooth, spherically symmetric expanding shell of HI gas, whose radius and column density have been tuned to suitable values. As it is very likely that shell fragmentation occurs as a result of Raleigh-Taylor and Kelvin-Helmholtz instabilities arising from the complex gas velocity field around the galaxy (e.g. see Fig. 2 of Fangano et al. 2007), such suggestion needs to await more detailed investigations.
5 Acknowledgements
PD acknowledges a Fellowship funded through the Marie Curie Early Stage Training project MEST-CT-2005-021074. PD thanks SISSA for their generous allocation of cluster time and the Scuola Normale Superiore for hospitality. We thank R. Salvaterra and the referee for insightful comments and M. Dijkstra for poitning out an error in an earlier version of the manuscript.
References
- bianchi (2007) Bianchi S., Schneider R., 2007, MNRAS, 378, 973
- bianchi (2007) Bouwens R.J. et al., 2009, submitted to Nature, arXiv:0912.4263 XS
- Dayal et al. (2008) Dayal P., Ferrara A. & Gallerani S., 2008, MNRAS, 389, 1683
- Dayal et al. (2009a) Dayal P., Ferrara A., Saro A., Salvaterra R., Borgani S., Tornatore L., 2009, MNRAS, 400, 2000
- dfs (2010) Dayal P., Ferrara A., Saro A., 2010, MNRAS, 402, 1449
- dayal (2010) Dayal P., Maselli A., Ferrara A., 2011, MNRAS, 410, 830
- Dijkstra (2010) Dijkstra M., Wyithe S. J. B., 2010, MNRAS, 408, 352
- Dijkstra (2011) Dijkstra M., Mesinger, A. Wyithe S. J. B., 2011, arXiv:1101.5160
- (9) Fangano, A. P. M., Ferrara, A., Richter, P. 2007, MNRAS, 381, 469
- Finkelstein et. al. (2008) Finkelstein S.L., Rhoads J.E., Malhotra S., Grogin N., Wang J., 2008, ApJ, 678, 655
- Finkelstein et. al. (2010) Finkelstein S.L., Papovich C., Giavalisco M., Reddy N. A., Ferguson H. C., Koekemoer A. M., Dickinson M., 2010, ApJ, 719, 1250
- bianchi (2007) Giavalisco M. et al., 2004, ApJ, 600, 103
- gnedin (2008) Gnedin N. Y., Kravtsov A. V., Chen, H.-W., 2008, ApJ, 672, 765
- Hansen & Oh (2006) Hansen M., Oh S.P., 2006, MNRAS, 367, 979
- bianchi (2007) Kashikawa N. et al., 2006, ApJ, 648, 7
- komatsu (2009) Komatsu E. et. al., 2009, ApJS, 180, 330
- lehnert (2010) Lehnert M. D. et. al., 2010, Nature, 467, 940
- leitherer (1999) Leitherer C. et al., 1999, ApJS, 123, 3
- madau (1999) Madau P., Haardt F., Rees M. J., 1999, ApJ, 514, 648
- Malhotra et al. (2005) Malhotra S. et al., 2005, ApJ, 626, 666
- McKee (1989) McKee C., 1989, Interstellar Dust: Proceedings of the 135th Symposium of the IAU. Symposium no. 135, Kluwer Academic Publishers, Dordrecht, p. 431
- Neufeld (1991) Neufeld D.A., 1991, ApJ, 370, 85
- nozawa (2007) Nozawa T., Kozasa T., Habe A., Dwek E., Umeda H., Tominaga N., Maeda K., Nomoto K., 2007, ApJ, 666, 955
- Santos (2004) Santos M. R., 2004, MNRAS, 349, 1137
- Salv (2009) Salvaterra R. et al., 2009, Nature, 461, 1258
- saro (2006) Saro A. et al., 2006, MNRAS, 373, 397
- seab (1983) Seab C. G., Shull J. M., 1983, ApJ, 275, 652
- bianchi (2007) Shimasaku K. et al., 2006, PASJ, 58, 313
- sp (2005) Springel V., 2005, MNRAS, 364, 1105
- bianchi (2007) Steidel C.C., Giavalisco M., Pettini M., Dickinson M., Adelberger K.L., 1996, ApJ, 462, L17
- bianchi (2007) Tanvir N. et al., 2009, Nature, 461, 1254
- tf (2001) Todini P., Ferrara A., 2001, MNRAS, 325, 726
- tornatore (2007) Tornatore L., Borgani S., Dolag K., Matteucci F., 2007, MNRAS, 382, 1050
- van (2010) Vanzella E. et al., 2010, Preprint arXiv:1011.5500
- Verhamme (2006) Verhamme A., Schaerer D., Maselli A., 2006, A&A, 460, 397