Defining the intrinsic AGN infrared spectral energy distribution and measuring its contribution to the infrared output of composite galaxies††thanks: The intrinsic AGN infrared SEDs, host-galaxy templates and a procedure used to combine them to fit infrared photometry is available at http://sites.google.com/site/decompir
Abstract
We use infrared spectroscopy and photometry to empirically define the intrinsic, thermal infrared spectral energy distribution (i.e., 6-100 µm SED) of typical active galactic nuclei (i.e., 2-10 keV luminosity, ergs s-1AGNs). On average, the infrared SED of typical AGNs is best described as a broken power-law at that falls steeply at 40 µm (i.e., at far-infrared wavelengths). Despite this fall-off at long wavelengths, at least 3 of the 11 AGNs in our sample have observed SEDs that are AGN-dominated even at 60 , demonstrating the importance of accounting for possible AGN contribution even at far-infrared wavelengths. Our results also suggest that the average intrinsic AGN 6-100 SED gets bluer with increasing X-ray luminosity, a trend seen both within our sample and also when we compare against the intrinsic SEDs of more luminous quasars (i.e., ergs s-1). We compare our intrinsic AGN SEDs with predictions from dusty torus models and find they are more closely matched by clumpy, rather than continuous, torus models. Next, we use our intrinsic AGN SEDs to define a set of correction factors to convert either monochromatic infrared or X-ray luminosities into total intrinsic AGN infrared (i.e., 8-1000 µm) luminosities. Finally, we outline a procedure that uses our newly defined intrinsic AGN infrared SEDs, in conjunction with a selection of host-galaxy templates, to fit the infrared photometry of composite galaxies and measure the AGN contribution to their total infrared output. We verify the accuracy of our SED fitting procedure by comparing our results to two independent measures of AGN contribution: (1) 12 µm luminosities obtained from high-spatial resolution observations of nearby galaxies and (2) the equivalent width of the 11.25 µm PAH feature. Our SED fitting procedure opens up the possibility of measuring the intrinsic AGN luminosities of large numbers of galaxies with well-sampled infrared data (e.g., IRAS, ISO, Spitzer and Herschel).
keywords:
Galaxies, Seyfert, Active, Quasars, Infrared, X-rays1 Introduction
The spectral energy distribution (hereafter, SED) of a continuum source is the description of its energy output as a function of photon frequency or wavelength. As such, it is one of the most important measurables in astronomy, providing information on both the physical nature of a continuum source (e.g., stars, galaxies, active galactic nuclei, heated dust), its influence on the surrounding matter (i.e., heating, ionisation state) and, when integrated over all wavelengths, its bolometric luminosity (i.e., power output). However, deriving an SED is a challenging task, requiring multiple observations across the whole of the electromagnetic spectrum and, in the case of active galactic nuclei (hereafter, AGNs), one that is further complicated by contamination from the ever-present host galaxy.
The level of host-galaxy contamination to the observed AGN SED is typically highest at infrared wavelengths (i.e., 8-1000 ) where the strongly rising host-galaxy SED typically dominates (e.g. Elvis et al. 1994; Richards et al. 2006; Netzer et al. 2007). Indeed, this contamination is so severe that the intrinsic AGN SED at these wavelengths remains largely unconstrained by observations (except for rare quasar-luminosity AGNs; see later). The significance of the uncertainties surrounding the intrinsic AGN infrared SED is clear when we consider that the infrared portion of the average observed (i.e., AGN host) AGN SED represents 50 per cent of the total radio – X-ray output (e.g., Elvis et al. 1994). Physical models of the infrared-emitting dust surrounding the AGN can provide some insights (e.g., Siebenmorgen & Kruegel 1992; Fritz et al. 2006; Schartmann et al. 2008), although they tend to predict a very broad range of infrared AGN SEDs as their input parameters are typically poorly constrained (see our §5.3); a situation that will be helped with a better understanding of the true range of intrinsic AGN infrared SEDs.
Well-defined intrinsic AGN infrared SEDs may also prove a useful tool in the measurements of AGN and star-formation activity that are crucial to our understanding of the interactions between these two processes that are believed to exist (e.g., Magorrian et al. 1998; Ferrarese & Merritt 2000; Gebhardt et al. 2000; Croton et al. 2006; Bower et al. 2006; Hopkins et al. 2006, 2007). It has already been demonstrated that the intrinsic mid-infrared emission of AGNs is closely linked to the total AGN luminosity (e.g., Horst et al. 2008; Gandhi et al. 2009), while the far-infrared emission of a pure star-forming galaxy provides a proxy measure of its star formation rate (e.g., Kennicutt 1998). Separating the total infrared SED of a composite (i.e., AGN + star-forming) galaxy into AGN and host components would therefore provide a measure of the levels of AGN and star-formation activity that is largely unaffected by obscuration or absorption; similar, in principle, to the infrared spectral decompositions carried out by, for example, Laurent et al. (2000),Tran et al. (2001) and Lutz et al. (2004). The benefit of using the whole infrared SED is that this technique is not restricted to the small fraction of galaxies for which infrared spectra are available. Furthermore, such techniques are likely to become increasingly popular with the availability of infrared photometry measurements from the Spitzer and Herschel telescopes. However, most studies that have used SED decomposition approaches have had to rely on either observed AGN SEDs that likely include considerable amounts of host-galaxy contamination at infrared wavelengths or predictions from radiative transfer models which are often poorly constrained (e.g. Polletta et al. 2007; Fiore et al. 2008, 2009; Pozzi et al. 2010; Hatziminaoglou et al. 2010). Of course, measurements derived from decomposing the infrared SED should be regarded as complementary to other measures of AGN activity that rely on other observables (e.g., X-ray luminosity, optical and infrared spectroscopy, mid-infrared photometry etc.; Kauffmann et al. 2003; Heckman et al. 2004; Hickox et al. 2007; Hickox et al. 2009; Goulding & Alexander 2009).
In their 2007 paper, Netzer et al. derived the average intrinsic infrared SED of a sample of luminous PG quasars by subtracting the host-galaxy component from the average observed SED, showing that their average intrinsic AGN SED falls rapidly longward of µm. However, such luminous quasars are rare among the AGN population and it is not clear whether the intrinsic quasar SED can be applied to the much larger, less luminous (i.e., ergs s-1) population of AGNs which represents the majority of the integrated accretion output of AGNs in the Universe (e.g., Ueda et al. 2003; Barger et al. 2005; Hasinger et al. 2005; Aird et al. 2010). In this paper we extend the work of Netzer et al. (2007) to include more typical, lower luminosity AGNs and demonstrate that the intrinsic AGN infrared SED appears to be linked to AGN luminosity. To do this, we first identify a sample of AGNs that show minimal amounts of host-galaxy contamination at MIR wavelengths, then carefully subtract any host-galaxy component that can still dominate at far-infrared wavelengths (see §2, §3). We compare the derived intrinsic AGN SEDs against other, more commonly assumed, AGN SEDs including those derived from quasars and radiative transfer models in §5. In §6 we introduce a procedure that uses these intrinsic AGN SEDs, together with a sample host-galaxy templates, to measure the AGN and host-galaxy contributions to the infrared output of a sample of local composite galaxies and demonstrate the obtained values agree with results from other, independent measures. In §7 we outline two obvious applications of these analyses: (1) defining correction factors to convert 12 µm and X-ray luminosities to total intrinsic AGN infrared luminosities and (2) measuring the intrinsic AGN power using infrared photometry alone. We summarise our findings in §8.
Throughout this work we adopt km s-1 Mpc-1, , and .
2 Sample Description

The first step we take in defining the intrinsic infrared SEDs of typical AGNs is to identify a sample of moderate luminosity (i.e., ergs s-1) AGNs that suffer minimal amounts of host galaxy contamination at infrared wavelengths. By doing this, we only focus on those SEDs that require as little manipulation as possible to extract the intrinsic AGN infrared SED. In this section, we describe how combine information derived from hard X-ray observations and infrared spectra to produce such a sample. We then explain how we use IRAS photometry to extrapolate the SEDs of a subsample of these AGNs to FIR wavelengths.
The Burst Alert Telescope (hereafter, BAT) on-board the Swift observatory is currently undertaking a survey of the sky at hard X-ray energies (i.e., 14-195 keV), where the effects from absorption (at least to ) are negligible. As a result, the second data release of the Swift-BAT survey, published in Tueller et al. (2008), provides a homogeneous sample of 154 local (i.e., ) X-ray AGNs. A key motivation for using the AGNs selected from the Swift-BAT sample to define the intrinsic AGN infrared SED is that their X-ray properties (i.e., 2-10 keV X-ray luminosities and absorbing columns, hereafter, and ) cover largely the same ranges as those AGNs detected in deep Chandra surveys (e.g., CDF-N and CDF-S; see fig. 1). As such, this sample provides the ideal local analogue to the high redshift AGNs detected in these fields as well as typical local AGNs (i.e., ergs s-1 and ; see Winter et al. 2009). Furthermore, in cases where infrared photometry is available, the Swift-BAT AGNs cover the same range of infrared luminosities (integrated over 8-1000 µm; hereafter ; ) as those star-forming galaxies that make up the majority of the local galaxy population detected by IRAS (i.e., ) and galaxies detected in deep Spitzer/Herschel fields (e.g. GOODS; P.I.s: M. Dickinson, D. Elbaz).
In order to identify a sample of galaxies whose infrared output is dominated by a moderate luminosity AGN, we cross-match the Swift-BAT sample with the archive of low resolution spectra obtained by the infrared spectrograph (hereafter, IRS) on-board Spitzer. Of the 104 Swift-BAT AGNs with measured (see Winter et al. 2009), 36 have publicly available archival low resolution IRS spectra covering (observed frame) µm. These spectra were reduced and extracted following the procedures outlined in Mullaney et al. (2010), Goulding et al. (2010) and Goulding (2010; PhD thesis). Following the diagnostics presented in Goulding & Alexander (2009) and Tommasin et al. (2010), we quantify the contribution of the host galaxy to these MIR spectra using the equivalent widths of the 11.25 µm PAH feature (hereafter, EW PAHλ11.25). We decide to use the 11.25 µm feature to measure the host galaxy contribution rather than the typically stronger one at 7.7 µm as this latter feature is often blended with another PAH emission line at 8.6 µm. We measure EW PAHλ11.25 using the spectral fitting code pahfit (Smith et al. 2007) and assume that strongly AGN dominated systems have EW PAHλ11.25 0.03 µm, corresponding to a per cent host-galaxy contribution at 19 µm (see Tommasin et al. 2010).111pahfit is available from http://tir.astro.utoledo.edu/jdsmith/research/pahfit.php Of the 36 X-ray AGNs that have archival low resolution IRS spectra, we identify 25 whose EW PAHλ11.25 satisfy this criterion (see table 1 for a list of these 25 AGN-dominated galaxies; also fig. 2). Approximately half of these AGNs (i.e., 12/25) are optically classified as either Type 1, 1.2 or 1.5 while the rest (i.e., 13/25) are classified at either Type 1.8, 1.9 or 2 (optical classifications taken from Tueller et al. 2008; see table 1 for these classifications and other information regarding these 25 AGN dominated galaxies). We visually inspect the infrared spectra of each of these 25 AGNs to confirm that they are, indeed, dominated by a featureless AGN continuum.
To provide constraints on the intrinsic AGN SED at FIR wavelengths, we extrapolate beyond the low resolution IRS spectra using 60 µm and 100 µm photometry available from the IRAS archives (accessed through the NASA extragalactic database; NED). To ensure reliable extrapolation to FIR wavelengths, we only consider photometry greater than 0.2 Jy and 1.0 Jy at 60 µm and 100 µm, respectively (the approximate limiting sensitivity of the IRAS faint source catalogue at these wavelengths). Of the 25 AGN-dominated galaxies identified above, 20 satisfy these criteria. However, we note that aperture effects must be taken into consideration when collating photometric and spectral data obtained by the IRAS and Spitzer telescopes. The apertures used to measure the IRAS photometry reported in the point source and faint source catalogues were between 2′ and 9′ in diameter, compared to the 3.6″ and 10.5″ (shortest dimension) apertures of the short-low and long-low slits of the Spitzer-IRS instrument, respectively. Therefore, there is considerable scope for the IRAS photometry to contain a great deal more host galaxy flux than the small aperture IRS spectra. To mitigate such aperture effects, we only extrapolate to the 60 µm and 100 µm photometry values when the flux density in the IRS spectrum, integrated over the 12 and 25 µm IRAS band passes, matches (to within 30 per cent, including errors) the IRAS photometry at these wavelengths. Our choice of 30 per cent accuracy between the IRAS and IRS fluxes is based on the approximate systematic uncertainty of the IRAS point source and faint source catalogues when compared to the Revised Bright Galaxy Sample (Sanders et al. 2003). We identify 11 AGN-dominated galaxies that satisfy these criteria (indicated by a “Y” in column 16 of table 1), which we use to define the intrinsic AGN SED. The 6-100 SEDs of these AGN-dominated galaxies, including their 60 and 100 µm photometries, are presented in appendix A.

| Name | Type | RA | Dec. | Dist. | (60µm) | EW PAHλ11.25 | Selected | ||||||||
|---|---|---|---|---|---|---|---|---|---|---|---|---|---|---|---|
| (Mpc) | (Jy) | (Jy) | (Jy) | (Jy) | (Jy) | (Jy) | log() | log() | log(ergs s-1) | (µm) | |||||
| (1) | (2) | (3) | (4) | (5) | (6) | (7) | (8) | (9) | (10) | (11) | (12) | (13) | (14) | (15) | (16) |
| Mrk348 | 2 | 12.1964 | 31.9570 | 63.4 | 0.308 0.031 | 0.835 0.025 | 1.29 0.12 | 1.55 0.20 | 0.1 | 0.4 | 9.91 | 10.5 | 42.6 | 0.002 | - |
| NGC985 | 1 | 38.6574 | -8.7876 | 185.3 | 0.207 0.031 | 0.523 0.017 | 1.38 0.11 | 1.89 0.15 | 0.1 | 0.3 | 10.87 | 11.3 | 44.3 | 0.016 | - |
| NGC1275 | 2 | 49.9507 | 41.5117 | 74.2 | 1.060 0.014 | 3.440 0.027 | 6.990 0.042 | 7.20 0.47 | 0.7 | 2.8 | 10.78 | 11.2 | 43.9 | - | - |
| ESO548-G081 | 1 | 55.5155 | -21.2444 | 61.0 | 0.249 0.057 | 0.097 0.075 | 0.601 0.048 | 1.49 0.18 | 0.2 | 0.3 | 9.54 | 10.2 | 42.8 | 0.015 | - |
| 3C120 | 1 | 68.2962 | 5.3543 | 141.2 | 0.289 0.043 | 0.624 0.094 | 1.38 0.21 | 1.94 0.29 | 0.3 | 0.8 | 10.63 | 11.1 | 44.0 | 0.008 | Y |
| NGC2110 | 2 | 88.0474 | -7.4562 | 32.6 | 0.349 0.028 | 0.840 0.021 | 4.13 0.21 | 5.7 1.4 | 0.3 | 0.8 | 9.83 | 10.2 | 42.5 | 0.023 | Y |
| EXO055620-3820.2 | 1 | 89.5083 | -38.3346 | 144.9 | 0.529 0.032 | 0.685 0.034 | 0.322 0.035 | 0.56 0.12 | 0.3 | 0.6 | 10.02 | 11.2 | 43.7 | - | - |
| Mrk3 | 2 | 93.9015 | 71.0375 | 56.9 | 0.713 0.050 | 2.900 0.036 | 3.77 0.15 | 3.36 0.44 | 0.6 | 2.3 | 10.28 | 10.8 | 42.9 | - | Y |
| MCG-01-24-012 | 2 | 140.1927 | -8.0561 | 83.1 | 0.080 0.025 | 0.3810 0.0088 | 0.654 0.059 | 1.10 0.18 | 0.1 | 0.4 | 9.85 | 10.4 | 43.0 | 0.006 | Y |
| Mrk417 | 2 | 162.3789 | 22.9644 | 140.1 | 0.132 0.033 | 0.227 0.054 | 0.164 0.043 | 0.71 0.15 | 0.1 | 0.3 | 9.70 | 10.7 | 43.3 | 0.004 | - |
| NGC3783 | 1 | 174.7572 | -37.7386 | 38.51 | 0.840 0.059 | 2.490 0.050 | 3.26 0.19 | 4.90 0.54 | 0.6 | 1.9 | 9.88 | 10.5 | 43.1 | 0.002 | - |
| NGC4507 | 2 | 188.9026 | -39.9093 | 49.6 | 0.517 0.078 | 1.59 0.24 | 4.69 0.70 | 6.28 0.94 | 0.6 | 1.5 | 10.25 | 10.7 | 43.0 | 0.013 | Y |
| ESO506-G027 | 2 | 189.7275 | -27.3078 | 106.3 | 0.148 0.030 | 0.268 0.022 | 0.498 0.050 | 0.83 0.19 | 0.2 | 0.4 | 9.94 | 10.5 | 43.2 | - | - |
| MCG-03-34-064 | 1.8 | 200.6019 | -16.7286 | 69.8 | 0.940 0.040 | 2.970 0.045 | 6.200 0.040 | 6.20 0.14 | 0.7 | 2.5 | 10.67 | 11.1 | 42.8 | 0.005 | Y |
| MCG-06-30-015 | 1.2 | 203.9741 | -34.2956 | 32.5 | 0.380 0.034 | 0.809 0.027 | 1.090 0.076 | 1.10 0.22 | 0.2 | 0.5 | 9.25 | 9.9 | 42.6 | 0.004 | - |
| IC4329A | 1.2 | 207.3304 | -30.3096 | 67.7 | 1.080 0.054 | 2.210 0.054 | 2.03 0.10 | 1.66 0.22 | 0.9 | 2.0 | 10.16 | 10.9 | 43.6 | - | Y |
| NGC5506 | 1.9 | 213.3119 | -3.2075 | 28.71 | 1.290 0.027 | 4.170 0.056 | 8.420 0.060 | 8.87 0.11 | 1.0 | 3.3 | 10.03 | 10.5 | 42.8 | 0.011 | Y |
| NGC5548 | 1.5 | 214.4981 | 25.1368 | 72.5 | 0.401 0.040 | 0.769 0.032 | 1.070 0.086 | 1.61 0.16 | 0.2 | 0.6 | 9.94 | 10.6 | 43.5 | 0.017 | - |
| Mrk290 | 1 | 233.9682 | 57.9026 | 126.1 | 0.1 | 0.1 | 0.171 0.029 | 0.6 | 0.1 | 0.2 | 9.63 | 10.5 | 43.2 | - | - |
| ESO103-035 | 2 | 279.5847 | -65.4276 | 55.9 | 0.612 0.043 | 2.360 0.031 | 2.31 0.12 | 1.05 0.26 | 0.5 | 2.1 | 10.05 | 10.7 | 42.7 | - | Y |
| 3C390.3 | 1 | 280.5375 | 79.7714 | 244.3 | 0.128 0.018 | 0.2870 0.0089 | 0.204 0.033 | 0.6 | 0.1 | 0.3 | 10.28 | 11.2 | 44.1 | 0.002 | - |
| Mrk509 | 1.2 | 311.0406 | -10.7235 | 147.3 | 0.316 0.028 | 0.702 0.022 | 1.360 0.068 | 1.52 0.23 | 0.3 | 0.8 | 10.66 | 11.2 | 44.0 | 0.023 | Y |
| IC5063 | 2 | 313.0097 | -57.0688 | 47.7 | 1.110 0.023 | 3.940 0.030 | 5.870 0.038 | 4.25 0.21 | 0.9 | 3.1 | 10.32 | 10.8 | 42.7 | 0.000 | Y |
| NGC7213 | 1.5 | 332.3177 | -47.1667 | 22.01 | 0.606 0.049 | 0.742 0.036 | 2.67 0.16 | 8.18 0.41 | 0.2 | 0.5 | 9.30 | 9.9 | 42.3 | 0.019 | - |
| NGC7314 | 1.9 | 338.9426 | -26.0502 | 19.01 | 0.268 0.035 | 0.579 0.048 | 3.74 0.22 | 14.2 1.3 | 0.1 | 0.5 | 9.32 | 9.8 | 42.2 | 0.015 | - |
Notes: (1) Common name, (2) Optical Class from Tueller et al. (2008) (3) and (4) Galaxy co-ordinates (J2000) from Tueller et al. (2008), (5) Distance in Mpc, 1denotes that a redshift-independent distance measure taken from NED is used, otherwise calculated from the redshift reported in Tueller et al. (2008) (6) to (9) IRAS photometry measurements, taken from NED (10) and (11) 12 µm and 25 µm flux densities derived from the low resolution IRS spectra, (12) Monochromatic luminosity at 60 µm in units of log() (for comparison with Netzer et al. 2007). We use ergs s-1. (13) Total infrared luminosity in units of log(), calculated using the equations in Table 1 of Sanders & Mirabel (1996), (14) Rest-frame 2-10 keV luminosity, corrected for absorption (taken from Winter et al. 2009) (15) Equivalent width of the the 11.25 µm PAH (i.e., EW PAHλ11.25) feature in µm. (16) Selected for extrapolation to µm based on whether the IRAS photometry at 12 and 25 µm matches that derived from the IRS spectra.

3 Defining a set of host-galaxy templates
The sample of AGNs identified in the previous section show minimal amounts of host-galaxy contamination at MIR wavelengths. However, because a typical host-galaxy SED rises strongly at longer infrared wavelengths, an SED that is strongly AGN-dominated at MIR wavelengths may not necessarily be AGN-dominated at FIR wavelengths. Indeed, Netzer et al. (2007) showed that at 60 the average quasar SED is 80 to 90 per cent host-galaxy dominated, despite having only weak PAH features at MIR wavelengths. In this section we describe the construction of a set of host-galaxy templates that represent the full diversity of host-galaxy SEDs expected for typical AGNs (i.e., the full range of IRAS colour-colour space for galaxies). These templates are used to account for the host-galaxy contribution to our AGN-dominated sample in §4.
In fig. 3 (left panel) we plot the 100 µm/60 µm vs. 25 µm/12 µm colours of all galaxies in the Revised Bright Galaxy Survey. From this figure it is clear that the majority of the colour-colour space spanned by these galaxies is well sampled by the Brandl et al. (2006) sample of starburst galaxies. However, we note that there is a region of this colour-colour space that is not sampled by these starbursts. Galaxies in this un-sampled region of the colour-colour space have SEDs that rise steeply between 60 µm and 100 µm, but are relatively flat between 12 µm and 25 µm. As such, they likely represent a population of cold galaxies. To construct our host-galaxy templates we use a selection of Brandl et al. (2006) starbursts and a selection of galaxies that lie in this “cold” region of the IRAS colour-colour space. This ensures that we cover the full range of SEDs displayed by galaxies. We note that the both the colour-colour and 60 µm/25 µm- parameter spaces are particularly well-sampled in the infrared luminosity range spanned by the AGNs selected for decomposition (i.e., log(/) ; fig. 3, right panel; see §4.2).
We extracted and reduced the low resolution IRS spectra of all the Brandl et al. (2006) starbursts and four additional “cold” galaxies (namely, NGC 1667, NGC 5734, NGC 6286 and NGC 7590), following the same procedures as those referred to in §2. All of the Brandl et al. (2006) starbursts were observed in IRS staring mode, while the four “cold” galaxies were observed in mapping mode. We note that these differences in the observing modes will have little or no effect on our host-galaxy templates as our selection process minimises aperture effects (see later). We extrapolated these MIR SEDs to 100 µm using IRAS photometry as described in §2. To mitigate aperture effects we only use those SEDs in which the IRS spectra agree with the 12 µm and 25 µm IRAS photometry to within 30 per cent. Out of the 16 Brandl et al. (2006) starbursts identified as either pure starbursts or starburstLINER, we identify 10 that satisfy these criteria: Mrk 52, Mrk 520, NGC 660, NGC 1222, NGC 2623, NGC 3256, NGC 4194, NGC 4818, NGC 7252, NGC 7714. All four of the “cold” galaxies also satisfy these criteria. To produce our host-galaxy templates we group these SEDs in terms of their overall shape and the relative strength of their PAH features (see fig. 4). The full range of host-galaxy SED shapes is well characterised by five groups of SEDs, referred to as “SB1” through “SB5”, with all four “cold” SEDs contained within a single group (i.e., “SB1”; see table 2 and fig. 4). Five host-galaxy templates are obtained by normalising each SED within each group at 90 µm and calculating their mean average. Since the SEDs within each group are so similar, the wavelength at which they are normalised has little effect on these host-galaxy templates. Beyond 100 µm we extrapolate the average SEDs as a modified black body (i.e., , where is the blackbody specific flux and is photon frequency; we adopt ). We verify that this is a reasonable assumption using AKARI 140 µm and 160 µm photometry data available for 13 of the 14 host-galaxy SEDs in our sample.222AKARI data were retrieved from the NASA/IPAC Infrared Science Archive at http://irsa.ipac.caltech.edu/. These templates are used to remove any host-galaxy contribution to the infrared SED of the AGN-dominated galaxy sample. We publish the host-galaxy templates in columns 5-9 of table 3 (which is available in its entirety online at http://sites.google.com/site/decompir).
4 Characterising the intrinsic infrared AGN SED
First we use the IRS spectra of our AGN sample (defined in §2.1) to explore the range of AGN-dominated infrared SEDs at 6-35 . We then extract the intrinsic 6-100 SEDs of a subsample of these AGNs by carefully decomposing the observed SEDs into their host-galaxy (defined in §3) and AGN components.
4.1 AGN dominated SEDs at 6 µm to 35 µm
The IRS spectra presented in fig. 2 provide a clear picture of the range of MIR SEDs produced by strongly AGN-dominated systems. As explained in §2, the weak PAH features in this sample suggest that at least 90 per cent of the continuum emission at 19 µm is produced by the AGN. Considering that the typical host-galaxy continuum falls toward shorter infrared wavelengths (see fig. 4), it is reasonable to assume that the AGN dominates the continuum emission at 6 µm – 20 µm. At these wavelengths, all 25 AGN-dominated SEDs show clear evidence of a continuous, underlying power-law continuum that is thought to be produced by multiple dust components spanning a range of temperatures (e.g., Buchanan et al. 2006).
The spectral indices of the underlying AGN power-law continua span the range (mean: =1.6), with a tendency for Type 2 AGNs to have higher (more positive) spectral indices compared to Type 1 AGNs. 333Here, we use . To convert to use , where However, there is considerable overlap between the types (i.e., Type 1s: ; Type 2s: ), and the difference in the mean SEDs is not statistically significant. This large range of spectral indices is consistent with those found in previous studies (e.g. Buchanan et al. 2006; Wu et al. 2009). In four cases (i.e., one Type 1: EXO055620-3820.2 and three type 2s: ESO506-G027, NGC 5506, ESO103-035), we see evidence of strong silicate absorption at 9.7 µm. In a further eight cases (i.e., five type 1s: ESO548-G081, 3C120, NGC 3783, Mrk 290, NGC 7213 and three type 2s: NGC 1275, NGC 2110, NGC 4507) there is strong evidence of silicate emission at µm which is always accompanied by another silicate emission feature at µm (see Sturm et al. 2005 for a dedicated study of the silicate emission features seen in the MIR spectra of AGNs).
In at least 20 of the 25 AGN-dominated MIR spectra there is a definite break in the power-law continuum at µm; mean break position of µm. In previous studies this has been attributed to a dominating warm (i.e., K) dust component that is heated by the AGN (e.g., Weedman et al. 2005; Buchanan et al. 2006). In all cases where we see a break in the continuum power law, the AGN SED longward of has a lower spectral index (i.e., power-law index, , mean; again, consistent with Buchanan et al. 2006 and Wu et al. 2009) than at shorter wavelengths. We again find that there is significant overlap in the range of spectral indices at µm between Type 1 and Type 2 AGNs. We note that the power-law indices shortward and longward of are uncorrelated. The number of AGNs in our sample showing a break around 19 µm could be as high as 24, since it can be disguised by the presence of the silicate emission feature at 18 µm. The only AGN in our sample where the 6–35 SED can be unambiguously described as a single power law is NGC5506; the spectral index of NGC5506 over 6–35 is , which is consistent with the ranges of both and .
Because the typical host-galaxy continuum emission increases strongly toward longer wavelengths, it is difficult to ascertain whether the power-law emission at longer wavelengths (i.e., ) arises from the AGN alone, or if the host galaxy also makes a significant contribution. Indeed, in four cases (i.e., NGC7213, NGC4507, NGC2110, 3C120), the SED longward of µm shows evidence of a turn-up in which is consistent with being due to an underlying host-galaxy component. The host-galaxy component must be accounted for at longer wavelengths in order to define the intrinsic AGN infrared SED, which we address in the next subsection.
4.2 Intrinsic AGN infrared SED at 6 µm to 100 µm
We now extend the intrinsic AGN infrared SEDs to longer wavelengths (i.e., ) using IRAS 60 and 100 photometry for guidance. Here, we only consider those 11 AGN-dominated SEDs that we have shown suffer from minimal aperture effects (see §2). The approach we take is to decompose the observed SEDs into their host-galaxy and intrinsic AGN components through simultaneously fitting the IRS spectra and IRAS photometry. An alternative approach would be to simply subtract a normalised host-galaxy component from the observed SEDs to leave the emission intrinsic to the AGN. However, calculating the appropriate normalisation for the host-galaxy component is a non-trivial matter that is complicated by the fact that the host-galaxy SED may be modified by dust-absorption (i.e., the observed SED is not a simple linear sum of a host-galaxy and an AGN component; separate absorption terms must also be considered). Later, and only for illustrative purposes, we subtract the host-galaxy SEDs normalised via our SED fitting routine from the sample of 11 observed AGN SEDs (see fig. 5).
One downside of the approach that we adopt is that it requires us to make a priori assumptions about the form of the intrinsic AGN infrared SED used in our fits. Our analyses of the AGN-dominated MIR spectra in the previous subsection provides us with a well defined set of parameters that describe the variety of intrinsic AGN SEDs at 6 to 25 µm (i.e., , and 15 µm20 µm). At longer wavelengths, where there are fewer observational constraints, we can only estimate the form of the intrinsic SED based on reasonable physical assumptions then test whether models incorporating these SEDs reproduce observations. With this in mind, we assume that the intrinsic SED falls as a modified black body beyond a given wavelength, . In our fits, is allowed to take any value between 20 µm and 100 µm. Our choice of a modified black body spectrum is loosely based on the results of radiative transfer models of the dust surrounding AGNs, although we note that the precise form of this fall-off does not have a significant impact on the fits. When needed, we add silicate emission features at 10 µm and 18 µm to the intrinsic AGN component. These are modelled with broad (i.e., FWHM3 µm) gaussians. In our models, we account for any absorption to both the AGN and host-galaxy components using a Draine (2003) extinction curve.
| Host Galaxy Template | Galaxy | D (Mpc) | log(/) |
|---|---|---|---|
| (1) | (2) | (3) | (4) |
| SB1 | NGC 1667 | 60.51 | 10.96 |
| NGC 5734 | 59.28 | 11.06 | |
| NGC 6286 | 79.78 | 11.32 | |
| NGC 7590 | 21.58 | 10.16 | |
| SB2 | NGC 7252 | 64.67a | 10.77c |
| SB3 | Mrk 52 | 33.50b | 10.25c |
| NGC 4818 | 9.37 | 9.75 | |
| NGC 7714 | 38.16 | 10.72 | |
| SB4 | NGC 1222 | 32.26 | 10.60 |
| NGC 3256 | 35.35 | 11.56 | |
| NGC 4194 | 40.33 | 11.06 | |
| SB5 | NGC 520 | 30.22 | 10.91 |
| NGC 660 | 12.33 | 10.49 | |
| NGC 2623 | 77.43 | 11.54 |
Notes: (1) Host-galaxy template, (2) Galaxy name, (3) Distance in Mpc taken from Sanders et al. (2003), acalculated using the redshift reported in NED using the same cosmology as Sanders et al. (2003), bredshift-independent distance reported in NED (4) 8–1000 µm infrared luminosity, taken from Sanders et al. (2003), ccalculated using the distance in column 3 and the prescription outlines in table 1 of Sanders & Mirabel (1996).
We proceed by simultaneously fitting the IRS spectra and the IRAS photometry of the 11 AGNs in our sample with a combination of our host-galaxy templates (see §3) and the estimated intrinsic AGN SED described above. Any strong emission lines (excluding PAH features) are masked to ensure that they do not adversely effect the fit. Each of the 11 infrared SEDs are fit five times, each time using a different host-galaxy template (defined in §3; see also fig. 4). We use -minimisation to obtain the best fitting parameters for each choice of host-galaxy template. Plots showing the fits to the data (including the host-galaxy and intrinsic AGN components) and the resulting residuals are presented in appendix A.

Because the observed SEDs consist, in part, of very high signal-to-noise IRS spectra, none of the fits to the data are formally good (i.e., their reduced ). Therefore, we cannot use statistics to unambiguously determine whether any of the five different AGN–host-galaxy template solutions provide a good characterisation of the data. Instead, we use the following criteria to determine which of the five models provide suitable fits to the observed data: does it (a) pass within 2 of the 60 and 100 photometry and (b) reproduce the general shape of the IRS spectrum. For each of the 11 SEDs in our sample, we can identify at least one of the five model fits that satisfy both these criteria. When both criteria are met we select, by eye, those model fits that produce the smallest residuals at the wavelengths of the strongest PAH features, i.e., 7.7 , 11.25 and 12.8 . We use this additional criterion to ensure that any contribution from the host-galaxy well accounted-for by the fitted host-galaxy component. Where there is no significant difference in the PAH residuals of two or more such fits we identify each of them as being suitable (in appendix A we have highlighted all selected fits). In only two cases, namely NGC 5506 and ESO103-035, do we see large residuals at the PAH wavelengths for all five fits. In both these cases, we assume that all of the fits are as good as each other and select all five for further consideration. In all selected cases (including NGC 5506 and ESO103-035), the model fits lie within 10 per cent of the measured flux density for at least 85 per cent of the IRS data points, demonstrating the ability of our SED fitting approach to reproduce the continuum shape and PAH strengths of the AGNs in our sample. As a final note to the fitting procedure we would like to point out that, while we are confident that selecting the fits that closely reproduce the PAH features is the most appropriate procedure to take, our main results do not change if, instead, we use the results derived from using all our host-galaxy templates (which cover the full range of SED shapes of local, galaxies; see fig. 3). The strongest effect that taking this alternative approach has on our results is to increase the scatter of intrinsic AGN SEDs at FIR wavelengths by a factor of ; as we shall see, this does not represent a large increase over the range of intrinsic AGN SED shapes produced by selecting only the suitable host-galaxy components identified using the selection criteria outlined above.

For illustrative purposes, we show in fig. 5 the SEDs obtained by subtracting the suitable host galaxy components (i.e., those extracted from the suitable model fits identified above and highlighted in appendix A) from the observed SEDs. As we have selected only those fits that reproduce the general shape of the observed SED, the SEDs presented in fig. 5 are equivalent to the intrinsic AGN components produced during the fitting procedure and shown in appendix A. For guidance, we have highlighted the SED that is produced by the fit with the smallest overall residuals between 6 and 35 (i.e., the “best-of-the-best”), although we stress that all plotted intrinsic SEDs are viable.
For all 11 galaxies in our sample, the choice of host-galaxy template has almost no effect on the derived intrinsic SED shortward of . On the other hand, in at least five cases the SED at longer wavelengths is strongly dependent on the choice of host-galaxy template, meaning the exact form of the intrinsic AGN SED at these wavelengths is uncertain. However, in all cases the intrinsic SED falls rapidly (in ) beyond 15-60 , irrespective of the choice of host-galaxy component. Despite this fall-off at long wavelengths, the total emission at 60 is still dominated by the AGN in at least three, possibly four, cases (namely, MCG-03-34-064, ESO-103-035, IC5063 and, possibly, Mrk 3; there is one unselected host-galaxy component that dominates at 60 in this last case), irrespective of the choice of host-galaxy SED (see fig. 5).
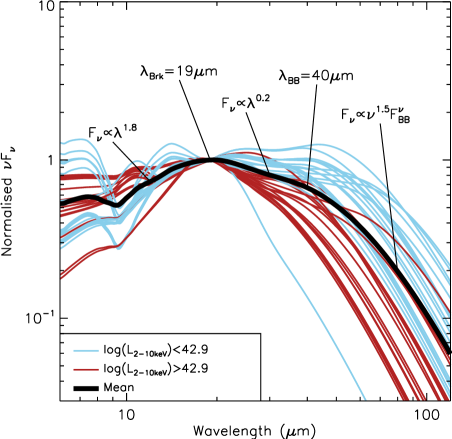
In fig. 6 we plot the full range of possible intrinsic AGN SED components extracted from our models. Shown in this plot are the intrinsic SEDs from all suitable fits identified using the criteria outlined above. A notable feature of this plot is the large range of intrinsic SED shapes extracted from the fits to the 11 observed SEDs in our sample. For example, when normalised at 19 the flux the intrinsic AGN flux extracted from our model fits spans over an order of magnitude at 60 and 100 . While the range mid-infrared (i.e., ) SEDs is well constrained by the AGN-dominated IRS spectra, it is not clear how much of the scatter at FIR wavelengths (i.e., ) is due to differences in the true intrinsic SED and how much is introduced by the different host-galaxy templates we use. Therefore, the range shown here will cover a larger spread than the true intrinsic AGN SEDs at . In fig. 6 we have discriminated between AGNs with X-ray luminosities above and below the median of the sample (i.e., above and below 42.9). We identify a clear trend for more intrinsically luminous AGNs to have intrinsic infrared SEDs that fall more rapidly at longer wavelengths, although stress that there is some overlap between the SEDs of AGNs with X-ray luminosities above and below the median of our sample (indeed, the most rapidly falling SED is that of the lowest luminosity AGN in our sample, NGC 2110). We also find that, on average, the mid-infrared SEDs of the more X-ray luminous AGNs in our sample have weaker silicate absorption and stronger silicate emission, although this could be related to the fact that all of the low X-ray luminosity AGNs are classed as either Type 1.8, 1.9 or 2 AGNs which, as we have seen, tend to have stronger silicate absorption features (see §4.1). The evidence for a link between the shape of the intrinsic infrared SED and is strengthened by differences between the average intrinsic SEDs of the moderate luminosity AGNs studied here and those of more luminous quasars (e.g., the average quasar SED presented in Netzer et al. 2007; see §5.2). There is weak evidence of a relation between the shape of the SEDs shortward and longward of , with SEDs with lower values of falling more rapidly at FIR wavelengths. However, we note that there are at least two objects in our sample that deviate strongly from this trend (namely, Mrk 3 and NGC 5506; see fig. 5).
We also plot in fig. 6 the average intrinsic SEDs calculated by taking the mean of the intrinsic AGN components extracted from the fits. Because of the considerable overlap in shape of the intrinsic SED at MIR wavelengths between Type 1 and Type 2 AGNs (see §4.1 and fig. 2) and the small number of intrinsic SEDs in our sample (i.e., 11) we do not discriminate between AGN types when producing these averages. Although not included in this plot, we note that the average of the SEDs obtained by subtracting the host-galaxy components from the observed data (i.e., those shown in fig. 5) is consistent with the average SED shown in fig. 6. This average SED can be expressed as:
| (1) |
and shows evidence of weak silicate absorption (equivalent to an absorbing column of 5, or 0.2, using fig. 10 of Draine 2003 to convert to ) but little or no silicate emission. For clarity, we plot the average mean-average SEDs of 42.9 and 42.9 AGNs separately in the right-hand panel of fig. 7. As expected from the trend identified above, the average intrinsic SED of the more luminous AGNs in our sample (i.e., 42.9) falls more rapidly at longer wavelengths than that of the lower luminosity AGNs (i.e., 42.9). For example, when normalised at 19 the lower luminosity AGNs emit, on average, 2-3 times more flux at 60 and 100 than the higher luminosity AGNs in our sample. The parameters describing the average SEDs of the high and low luminosity AGNs in our sample are largely the same as shown in Eqn. 1, although the spectral indices at are somewhat different, i.e., =0.0 and 0.4, respectively. This relative difference between the FIR SEDs of high and low luminosity AGNs in our sample could be the result of higher luminosity AGNs being capable of heating a larger fraction of their surrounding dust to higher temperatures. A consequence of this increased heating would be relatively stronger emission at MIR wavelengths; hence the apparent flux deficit at FIR wavelengths when normalised at 19 (see also §5.2). All three average intrinsic AGN SEDs described here are published in columns 2-4 of table 3 (which is available in its entirety online at http://sites.google.com/site/decompir).
Finally, we explore whether using a more straightforward approach to normalise the host galaxy component has any effect on the extracted intrinsic AGN SEDs. To extract the average intrinsic SED of more luminous, quasar AGNs, Netzer et al. (2007) normalised the host galaxy component such that it constitutes the majority of the observed flux at 60 and 100 . If we take a similar approach and assume that 90% of the flux at 100 is emitted by the host-galaxy, we obtain largely the same overall intrinsic SED shapes as shown in fig. 5 and fig. 6, but are left with strong features at 7.7 where the PAH features are over-estimated by the host-galaxy component, indicating that this approach is less reliable than our adopted approach.444We also get broadly similar results if we assume that 80% or 99% of the 100 flux is due to the host-galaxy.

5 Comparison with previously defined AGN infrared SEDs and results from dusty torus models
We have produced a set of intrinsic AGN infrared SEDs by decomposing the observed SEDS of local, AGN-dominated galaxies into well-defined host-galaxy and intrinsic AGN components (see §4.2). The full variety of these intrinsic AGN SEDs is shown in fig. 6. In this section we explore how these intrinsic SEDs compare against other commonly assumed AGN SEDs, including those produced by radiative transfer models of the dust surrounding the AGN. For simplicity, the comparisons made in this section are against the mean average and range of all the intrinsic SEDs in our sample (i.e., we do not differentiate between the high and low luminosity AGNs in our sample; see previous section).
5.1 NGC 1068, Mrk 231
Of all known local AGNs, NGC 1068 and Mrk 231 are commonly used to characterise the infrared SEDs of AGNs. In fig. 7 we illustrate how our range of intrinsic AGN SEDs compare with these canonical AGNs.555The NGC 1068 and Mrk 231 SEDs shown here represent the infrared emission produced by the entire galaxy (i.e., including emission from the host galaxy). We note that, whilst mid-infrared flux density measurements of the resolved AGN core of NGC 1068 (e.g., Gandhi et al. 2009; Prieto et al. 2010) are now available, we choose to include emission from the host galaxy to allow easier comparison with previous studies which have, in general, done the same. When normalised to 19 µm, the SEDs of Mrk 231 and NGC 1068 are, respectively, 15 and 8 times higher at 100 µm than the average SED calculated from our AGN templates. Assuming that the average intrinsic AGN emission continues to fall as a modified black body to 1000 µm, the Mrk 231 and NGC 1068 SEDs contain roughly 1.5-3 times the power at infrared wavelengths than the average intrinsic AGN SED (when all are normalised at 19 µm). This excess power is likely the result of host galaxy contamination in these two cases, as suggested by Telesco et al. (1984); Downes & Solomon (1998) and Le Floc’h et al. (2001). Indeed, fits to the infrared SEDs of Mrk 231 and NGC 1068 using the approach outlined in §4.2 are consistent with them being host-galaxy dominated at FIR wavelengths. Finally, we note that at wavelengths µm, where the host-galaxy contributions are small, the SEDs of NGC 1068 and Mrk 231 are largely consistent with our intrinsic AGN SEDs.
5.2 Infrared Quasar SEDs
There have been a number of attempts to constrain the average quasar SED, although only a handful have included coverage to FIR wavelengths (e.g. Elvis et al. 1994; Richards et al. 2006; Netzer et al. 2007). One of the most prominent, recent studies is that of Richards et al. (2006), which combined photometric data covering the radio to X-ray regimes for a sample of optically-selected, broad-line quasars. In fig. 7 we compare the average infrared SED of all quasars from that study to the AGN templates derived here. The average quasar SEDs from Richards et al. (2006) turns over at approximately the same FIR wavelengths as the average of our intrinsic AGN SEDs, although we note that host-galaxy contamination at FIR wavelengths has not been removed from this average quasar SED. This host-galaxy contamination will tend to push the position of the turn-over to longer wavelengths. The Richards et al. quasar SED is flatter than the average intrinsic SED of more moderate luminosity AGNs, which could be due to the increased quasar luminosities heating the surrounding dust to higher temperatures compared to more moderate luminosity AGNs. Despite being flatter at short wavelengths, the Richards et al. (2006) SED contains only 10 per cent more flux over 8-1000 than the average intrinsic SED when both are normalised to 19 and extrapolated to longer wavelengths assuming a modified blackbody SED.
Recently, Netzer et al. (2007) removed the host-galaxy component from the average infrared SED of a sample of PG-quasars to produce an average, intrinsic quasar infrared SED. This SED is also investigated in fig. 7. When both are normalised at 19 the average intrinsic quasar SED emits more strongly at 19 than the average intrinsic SED of more moderate luminosity AGNs calculated above. However, this situation is reversed at 19 , with the former falling more rapidly at longer wavelengths. This strengthens our findings described in §4.2, where we report a similar trend between the higher (i.e., 42.9) and lower (i.e., 42.9) luminosity AGNs within our sample. We note that the intrinsic quasar falls even more rapidly than the average intrinsic SED of the higher luminosity AGNs in our sample. The intrinsic quasar SED has stronger silicate emission features than the average intrinsic SED of more moderate luminosity AGNs, although this may be due to the Netzer et al. (2007) being comprised of Type 1 AGNs which tend to have stronger silicate emission features (see §4.1). As we suggest in §4.2 the increased flux at short wavelengths and relative deficit of flux at longer wavelengths in the average quasar SED may be related to the higher luminosities of quasars, with more luminous objects capable of heating more dust to higher temperatures. However, we can only claim this in an average sense as the average quasar SED is consistent with the spread of intrinsic infrared SEDs extracted from the 11 AGN-dominated sources above. The four intrinsic AGN SEDs that bear the closest similarity to the average quasar intrinsic SED are 3C120, IC4239A, Mrk 509 and NGC 4507; three are type 1 AGNs and one is a type 2 AGN, respectively. All four of these SEDs have intrinsic 2-10 keV luminosities greater than the median of our sample, (i.e., 42.9).

For comparison, we fit the Netzer et al. (2007) intrinsic quasar SED using decompir (see appendix B), obtaining:
| (2) |
where the symbols are the same as those defined in §4.2. These parameters confirm the shallower SED at MIR wavelengths and shorter-wavelength turnover of the Netzer et al. (2007) intrinsic quasar SED, compared to the average AGN SED defined in this study. When we extrapolate the Netzer et al. (2007) intrinsic quasar SED to longer wavelengths as a modified blackbody and normalise both SEDs at 19 µm, then we find that the total power radiated at infrared wavelengths is 80 per cent that of the average intrinsic infrared SED of typical AGNs calculated here.
5.3 Radiative transfer (dusty torus) models
Finally, we compare the range of intrinsic, infrared AGN SED templates with predictions from radiative transfer models of the dust surrounding the active nucleus, which is thought to be the main source of infrared emission from AGNs (although there is some evidence to suggest that infrared emission from AGNs could also be produced in more extended, dusty regions; e.g. Schweitzer et al. 2008; Mor et al. 2009). We compare our templates with the SEDs produced by both (a) continuous and (b) clumpy distributions of dust (specifically, the models described in Fritz et al. 2006 and Schartmann et al. 2008, respectively). The range of input parameters of the former (i.e., continuous) model are given in table 1 of Fritz et al. (2006). The input parameters of the clumpy torus model is presented in table 1 of Schartmann et al. (2008); we used the SEDs produced by varying both orientation angle (see their fig. 4) and dust mass (see their fig. 10). The SEDs predicted by these torus models are shown in fig. 8, together with the average and range of intrinsic SEDs defined in this study.

The continuous dust-distribution models produce a much broader range of SED shapes than the intrinsic AGN infrared SEDs defined here. For example, when normalised at 19 µm these models predict a range of flux densities spanning almost three orders of magnitude at µm, compared to a spread of (at most) two orders of magnitude for the intrinsic SEDs defined in this study. We note that the model SEDs that match the range of intrinsic AGN SEDs do not correspond to a particular region of input parameter space (i.e., torus opening angle, optical depths, inner and outer torus radii, radial dust density distribution, angular dust density distribution, SED of incident radiation). Therefore, our intrinsic AGN SEDs are unable to directly constrain acceptable input parameters of these continuous dust-distribution models.
The SEDs produced by the clumpy torus models provide a closer match to the observed intrinsic AGN infrared SEDs, although they too over-predict the range of FIR fluxes spanned by our intrinsic SEDs and tend to peak (in ) at longer wavelengths. The closer match to the clumpy torus models is consistent with other evidence in support for such models (e.g., Horst et al. 2006; Gandhi et al. 2009; Ramos Almeida et al. 2009). However, none of the clumpy torus models described in Schartmann et al. (2008) predict 6-20 µm SEDs as steep as some of those in our AGN-dominated sample (e.g., Mrk 3). As a consequence, at this normalisation the clumpy torus models over-predict the emission of many of our sources at .
6 Testing the AGN and host-galaxy templates
A principal motivation behind defining the intrinsic infrared SEDs of moderate luminosity AGNs is to use these as templates to fit the infrared SEDs of composite galaxies and calculate the AGN and host galaxy contributions to their total infrared output. This is especially useful in the majority of cases when only broad-band infrared photometry measurements are available to constrain the infrared SED. In this section we explore whether fits to the broad-band photometry incorporating the host-galaxy and AGN templates defined here can reproduce the intrinsic AGN luminosities and AGN contributions derived using other, independent approaches (i.e., high resolution imaging of nearby AGNs and emission line diagnostics). To perform these fits, we have developed an idl procedure, decompir, which we describe in appendix B and is publicly available online at http://sites.google.com/site/decompir.

6.1 Comparison with high spatial resolution observations of local Seyferts.
A number of recent studies (e.g. Krabbe et al. 2001; Horst et al. 2006, 2008; Gandhi et al. 2009) have shown that the intrinsic infrared luminosities of nearby AGNs can be reliably measured from high spatial resolution observations (i.e., ″, typically probing physical scales of pc). At such high resolutions, host galaxy contamination is minimised, leaving only the emission intrinsic to the active nucleus. However, such analyses are only viable for a small number of systems that are nearby enough that the central regions can be sufficiently well resolved. On the other hand, if we can use SED decomposition to exclude the host galaxy contribution to the broad-band SEDs, then we could potentially measure the intrinsic 12 µm luminosities for all AGNs with well sampled infrared SEDs. Here, we demonstrate that the SED decomposition procedure outlined in this study can, indeed, be used to measure the intrinsic AGN 12 µm flux.
We use decompir (see appendix B) to fit the four-band IRAS photometries of 23 AGNs with core 12 µm luminosities reported in Horst et al. (2008) or Gandhi et al. (2009) and X-ray luminosities within the range spanned by the AGNs used to define our intrinsic AGN SEDs (i.e., ergs s-1). As we are limited to only four independent flux density measurements we only allow the normalisations of the AGN and host galaxy components to vary when fitting the observed SEDs. All other parameters are fixed to their average values derived from the full sample of 11 AGN dominated galaxies described above (also see appendix B), but we note that our main results do not change if we use the average SED of either the high (i.e., log()42.9) or low (i.e., log()42.9) X-ray luminosity AGNs in our sample. Each SED was fit five times, once for each of our host-galaxy templates (i.e., as recommended in appendix B). To calculate the intrinsic 12 µm AGN flux, we integrate the intrinsic AGN component derived from the best fitting solution of these five fitted SEDs (i.e., that with the lowest associated value) over a narrow (i.e., 1 µm) top-hat passband centred at 12 µm, which is a similar response function as those filters used for the observations described in Horst et al. (2008) and Gandhi et al. (2009).
In fig. 9 we plot the intrinsic 12 µm flux derived from our best fitting SEDs against those obtained using high spatial resolution observations as reported in Horst et al. (2008) and Gandhi et al. (2009). We find that the intrinsic luminosities derived using our SED fits are well matched to those obtained using high resolution observations of the AGN core. On average, the intrinsic 12 µm AGN luminosity derived from our fits lie within a factor of two of the core luminosity at this wavelength, compared to within a factor of four when the 12 IRAS photometry is not corrected for host-galaxy contamination. A linear regression to these points gives:
| (3) |
which has a slope consistent with a 1:1 relationship. For comparison, we also plot the 12 µm luminosities calculated directly from the 12 µm IRAS photometry, noting that these often overestimate the intrinsic 12 µm luminosities, sometimes by more than a factor of 5. Finally, we note that the five Compton-thick sources in this sample (i.e., NGC 1068, IC 3639, Swift J0601.9-8636, NGC 5728 and NGC3281; Della Ceca et al. 2008) display a similar degree of scatter as the full sample. This demonstrates the power of using infrared SED fitting to identify even heavily obscured AGNs.
6.2 Comparison with results derived from emission line diagnostics
A number of infrared emission line diagnostics have recently been identified as providing reliable proxy measures of the AGN and host-galaxy contributions to the infrared and bolometric output of composite galaxies (e.g. Genzel et al. 1998; Tommasin et al. 2008; Tommasin et al. 2010; Goulding & Alexander 2009). A key test for our fits is whether they can broadly reproduce the intrinsic AGN luminosities derived from these diagnostics.
We use decompir to fit the IRAS photometries of 78 galaxies from the IRAS 12 sample for which accurate emission line fluxes, measured from high resolution IRS spectra, are available (see Tommasin et al. 2008; Tommasin et al. 2010 for a complete list of all the AGNs used for this section of our study, together with their measured emission line fluxes). Again, as we are dealing with only four photometry measurements, we only allow the normalisations of the AGN and host-galaxy components to vary when fitting the observed data. All other parameters are fixed to their average values derived from the full sample of 11 AGN-dominated galaxies (see §4.2; again, we note that our results do not change if we use the average SEDs derived from the high (i.e., log()42.9) or low (i.e., log()42.9) X-ray luminosity AGNs in our sample). The IRAS photometry of each of the 78 objects in our sample are fitted five times, each time using a different choice of host-galaxy template (defined in §3). Here, we report the AGN contribution to the 19 µm infrared emission measured from the best fitting of these five independent fits (i.e., that with the lowest associated value).
In fig. 10 we plot the AGN contribution at 19 µm derived from our fits to the IRAS photometry against EW PAHλ11.25 measured from high resolution IRS spectra; see Tommasin et al. (2008); Tommasin et al. (2010). We find that the AGN contribution measured from our fits to the IRAS photometry are in good general agreement with those based on EW PAHλ11.25, especially at high levels of AGN contribution (i.e., per cent). Of the entire sample of 78 AGNs, 76 per cent (i.e., 59/78) have AGN contributions measured from our broad band SED fits that lie within 25 per cent of those derived from EW PAHλ11.25. At lower AGN contributions where the intrinsic AGN component is more difficult to constrain, our fits typically estimate the AGN contribution to within per cent of that derived from EW PAHλ11.25. We note, however, that at such low AGN contributions even emission line diagnostics have considerable difficulty in estimating the intrinsic AGN contribution, as demonstrated by the significant amounts of scatter in the Ne v/Ne S3.2.2 ii – EW PAHλ11.25 correlation shown in fig. 4 of Tommasin et al. (2010) (see also right-hand panel of fig. 8., Goulding & Alexander 2009)
7 Application of our templates and infrared photometry fitting procedure
In the previous section, we quantified the accuracy of our SED fitting routine by comparing the results from these fits to results obtained by other well-established approaches In this section, we demonstrate two additional applications of our AGN intrinsic AGN SEDs and fitting approach: (a) defining the correction factors to convert 12 µm and 2–10 keV luminosities to total AGN infrared luminosities (i.e., ) and (b) measuring the intrinsic AGN luminosities of large samples of composite galaxies for which only infrared photometry measurements are available.
7.1 : and : correction factors
| Mean | Hi. Lum | Lo. Lum | ||||||||
| (µm) | (Jy) | (Jy) | (Jy) | (Jy) | (Jy) | (Jy) | (Jy) | (Jy) | ||
| (1) | (2) | (3) | (4) | (5) | (6) | (7) | (8) | (9) | (10) | (11) |
| 6.0 | 1.0 | 1.0 | 1.0 | 1.0 | 1.0 | 1.0 | 1.0 | 1.0 | 3.1 | 1.9 |
| 6.5 | 1.1 | 1.1 | 1.1 | 1.5 | 1.3 | 1.4 | 1.4 | 1.5 | 3.0 | 1.9 |
| 7.0 | 1.3 | 1.2 | 1.3 | 1.9 | 2.0 | 2.1 | 2.0 | 2.4 | 2.9 | 2.0 |
| 7.5 | 1.4 | 1.3 | 1.4 | 4.1 | 4.3 | 4.0 | 4.3 | 4.7 | 2.8 | 2.0 |
| 8.0 | 1.4 | 1.5 | 1.4 | 3.3 | 3.9 | 3.6 | 3.7 | 4.5 | 2.9 | 1.9 |
| 8.5 | 1.4 | 1.6 | 1.4 | 2.8 | 3.7 | 3.5 | 3.4 | 3.7 | 3.1 | 1.9 |
| 9.0 | 1.4 | 1.7 | 1.3 | 1.1 | 2.0 | 2.7 | 1.9 | 1.8 | 3.3 | 1.7 |
| 9.5 | 1.5 | 1.9 | 1.3 | 0.9 | 1.8 | 2.7 | 1.5 | 1.5 | 3.3 | 1.6 |
| 10.0 | 1.7 | 2.2 | 1.5 | 0.8 | 1.8 | 2.9 | 1.5 | 1.5 | 3.0 | 1.5 |
| 10.5 | 2.0 | 2.4 | 1.8 | 1.1 | 2.3 | 3.8 | 2.2 | 1.9 | 2.7 | 1.4 |
| 11.0 | 2.3 | 2.6 | 2.1 | 2.0 | 3.3 | 4.7 | 3.0 | 2.6 | 2.6 | 1.5 |
| 11.6 | 2.5 | 2.7 | 2.5 | 2.6 | 4.5 | 6.0 | 4.2 | 4.3 | 2.4 | 1.5 |
| 12.0 | 2.8 | 2.8 | 2.8 | 2.3 | 4.3 | 6.2 | 4.3 | 4.7 | 2.3 | 1.6 |
| 12.6 | 3.0 | 2.9 | 3.1 | 3.2 | 5.6 | 7.8 | 5.9 | 6.7 | 2.2 | 1.7 |
Notes: (1) Wavelength, (2)-(4) Flux densities of the average intrinsic AGN infrared SEDs defined in §4, normalised at 6 µm. Hi. Lum and Lo. Lum refer to the average SEDs of log() and log() AGNs in our sample, respectively. (5)-(9) Flux densities of the five host galaxy templates defined in §3, normalised at 6 µm, (10) Conversion factors to convert to total intrinsic AGN infrared luminosities (i.e., ) at all wavelengths covered by our templates, based on the average AGN SED defined in §4. (11) The same as column 10, but for the average quasar template of Netzer et al. (2007). This table is available in its entirety at higher wavelength resolutions at http://sites/google.com/site/decompir.
In cases where the infrared SED is either poorly constrained or dominated by emission from the host galaxy, measuring the total intrinsic AGN contribution can prove extremely difficult. Furthermore, to accurately estimate key parameters such as star-formation rates from infrared emission requires that any AGN contribution be accounted for. However, often, the only accurate way to measure the levels of AGN activity in composite galaxies is via X-ray or high resolution infrared observations. Using the intrinsic AGN infrared SEDs defined here coupled with the correlation between the intrinsic 12 µm luminosity and the 2–10 keV luminosity defined in Gandhi et al. (2009), we can now define a correction factor to convert 2–10 keV luminosities to total intrinsic AGN infrared luminosities. This correction factor enables any AGN contribution to the infrared output of galaxies for which, for example, only X-rays or monochromatic infrared observations provide a measure of the intrinsic AGN luminosity.
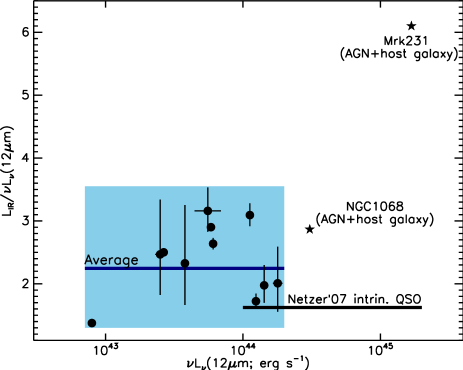
In fig. 11 we show the range of / ratios for all 11 AGNs for which we measure the intrinsic AGN infrared SED, plotted against . Here, we have assumed that the intrinsic AGN infrared SED continues as a modified black body to 1000 µm. These corrections therefore only apply to the thermal component of the intrinsic AGN SED as we do not consider any emission from non-thermal (e.g., synchrotron) processes. We choose as a reference point as it has been shown to be strongly correlated with the intrinsic luminosity of the AGN (e.g., Gandhi et al. 2009). However, as we have defined the intrinsic AGN SED at 6-1000 µm, an equivalent figure/analyses could be made/performed using any wavelength in this range as a reference point (see table 3). The / ratios displayed by these 11 AGNs span the range 1.3 to 3.5, with an average ratio of (derived from the average SED defined in §4). We do not see any correlation between / and for our sample. The average / ratio for quasar SEDs defined in Netzer et al. (2007) is slightly lower (i.e., ) than that of the lower luminosity AGNs considered here, although this difference is not significant based on the range of ratios spanned by our sample of intrinsic AGN SEDs. However, we note that the at other wavelengths the Netzer et al. (2007) quasar bolometric correction differs considerably from the average bolometric correction of more modest luminosity AGNs defined here (see table 3). We also show in fig. 11 the / ratios for NGC 1068 and Mrk 231, the latter of which is significantly higher than the range of intrinsic ratios due to the additional host-galaxy components in these SEDs (see §5.1).
Using the : correlation defined in Gandhi et al. (2009), we convert our / ratios into / correction factors. Assuming / (to cover the full range of ratios displayed by our sample) we obtain:
| (4) |
For a ergs s-1 AGN, typical of the range of considered here, equation 4 gives /0.3. This compares to a median ratio of /0.04 for the quasar sample of Elvis et al. (1994), although in this case there will be some contribution to from the host galaxy that has not been accounted for, hence the lower limit (see also Alexander et al. 2005; we have assumed ). We attribute the factor of 7 difference between these ratios to both the unaccounted-for host galaxy contribution and the different fractions of the total bolometric luminosities of AGNs (i.e., ) that are emitted at X-ray energies by quasars and more modest AGNs (see Vasudevan & Fabian 2007). For example, ergs s-1 AGNs emit approximately 5 per cent of their bolometric power in the 2–10 keV band, compared to just per cent for a ergs s-1 quasar (see fig. 3 of Vasudevan & Fabian 2007; i.e., changes in with luminosity; Avni & Tananbaum 1982; Wilkes et al. 1994; Vignali et al. 2003; Steffen et al. 2006). Using these conversion factors, we find that / are similar for both moderate and high luminosity (i.e., quasar) AGNs (i.e., 0.17 and 0.25, respectfully). 666If we assume that / provides a measure of the covering fraction of the infrared emitting dust, then these numbers are at odds with other measures based on the relative numbers of Type 1 and Type 2 AGNs in the local Universe (i.e., 0.5-0.8; e.g., Huchra & Burg 1992; Rush et al. 1993; Maiolino & Rieke 1995; Maia et al. 2003). However, clumpy torus models predict that many additional parameters (such as the temperature of the clouds, the inner and outer radii of the torus and the total number and distribution of dust clouds; Nenkova et al. 2002) on top of the covering fraction play a role in determining . Indeed, the clumpy torus models of Schartmann et al. (2008) predict a range of spanning despite their models all having a constant covering fraction of 0.5.
Finally, as we have defined the average intrinsic AGN infrared SED at 6 µm to 100 µm, we can use it to convert an intrinsic AGN infrared flux obtained at any wavelength covered by our SED templates into . We publish these conversion factors in column 8 of table 3 (which is available in its entirety online at http://sites.google.com/site/decompir).
7.2 Application of the SED fitting procedure to the Swift-BAT AGN sample
One of the principal applications of our SED fitting procedure is to measure the AGN contribution to the infrared output of composite galaxies. Because our fitting procedure can work with sparsely sampled photometry data (e.g. four-band IRAS photometry) this opens up the possibility of measuring the intrinsic infrared emission of AGNs in large samples of galaxies. Furthermore, as the intrinsic AGN luminosity at 12 µm is strongly correlated to , we can use these fits to estimate the intrinsic X-ray luminosities of those AGNs that are too heavily obscured to be detected by the current suite of X-ray observatories (e.g., Chandra, XMM-Newton and Suzaku). This is analogous to using high-resolution 12 µm observations to measure the intrinsic AGN luminosities. To demonstrate this, we use the procedure described in appendix B to fit the 12 µm, 25 µm, 60 µm and 100 µm photometry of all of the X-ray AGNs in the Swift-BAT sample that were detected in all four IRAS wavebands.
We use decompir (see appendix B) to fit the IRAS photometry of the 44 Swift-BAT AGNs detected in all four infrared bands. As we are limited to only four independent flux density measurements we only allow the normalisations of the AGN and host galaxy components to vary. We fix all of the other parameters to their average values derived from the full sample of 11 AGN-dominated galaxies (see §4.2 and appendix B), but note that the results do not change if we instead use the average SEDs of the high (i.e., log()42.9) or low (i.e., log()42.9) X-ray luminosity AGNs in that sample. Each SED was fit five times, once for each of our host-galaxy templates (i.e., as recommended in appendix B). We use fit with the smallest associated value to determine the AGN contribution to the infrared SED.
In fig. 12 we plot the intrinsic AGN 12 µm luminosities of the 42 Swift-BAT AGNs against their 14-195 keV X-ray luminosities (obtained from Tueller et al. 2008). Here, we use 14–195 keV luminosities, rather than 2–10 keV luminosities, as these energies are less susceptible to absorption and, as such, provide a more direct measure of the intrinsic AGN luminosity. Each intrinsic AGN 12 µm luminosity is calculated by integrating the AGN component obtained from the best fitting SED over a narrow (i.e., 1 µm) top-hat passband centred on 12 µm. We find that the intrinsic 12 µm luminosity is strongly correlated with the 14-195 keV luminosity. For comparison, we also include in fig. 12 the 42 AGNs presented in Gandhi et al. (2009) that have published intrinsic 12 µm luminosities measured from high resolution MIR observations. For these, we have converted their intrinsic 2-10 keV luminosities to 14-195 keV luminosities using a constant conversion factor of 2.5 (i.e., =2.5). We note that there is an inherent uncertainty in this conversion factor meaning the true scatter of these values will differ from that shown in fig. 12, although we expect any such differences to be comparatively small.777Assuming an X-ray spectral index of =1.8, we get a factor of 2.7, for =1.3 the factor is 10 and for =2.3 it is 0.8, implying a factor of uncertainty for a typical range of , although we note that other X-ray components (e.g. cold reflection, high energy turn-over) will also influence these factors. The results derived from our SED fits show a similar level of scatter as those presented in Gandhi et al. (2009). We note, however, that at low X-ray luminosities (i.e., ergs s-1), our procedure tends to overestimate the intrinsic AGN luminosities compared to those obtained from high spatial resolution observations. This is because the host galaxy tends to dominate over the AGN at lower luminosities, making it increasingly difficult to reliably constrain the AGN component. Therefore caution should be taken when applying this kind of analyses to studies of lower-luminosity AGNs. A linear regression to all Swift-BAT AGNs considered here gives only modest errors, i.e.:
| (5) |
with a standard error (i.e., 1 scatter) of dex (i.e., a factor of 3.2), compared to a standard error of dex for the 42 comparison AGNs from Gandhi et al. (2009) based on high-resolution 12 AGN luminosities.
The ability of our fitting procedure to derive the intrinsic luminosities of AGNs from only sparsely sampled photometric infrared data opens up the possibility of using such analyses to explore large populations of AGNs detected in wavebands probed by the IRAS, ISO, AKARI, Spitzer and Herschel telescopes. Such studies will complement work at other wavelengths in exploring the properties of both obscured and unobscured AGNs at all redshifts probed by these facilities. Applying our SED fitting procedure to Spitzer and Herschel data will be the focus of a future study.

8 Summary
Using a carefully selected sample of X-ray AGNs that show little or no evidence of host-galaxy contamination in their Spitzer-IRS mid-infrared spectra, we have defined the range of intrinsic infrared (i.e., 6-100 µm) SEDs of typical, moderate luminosity (i.e., ergs s-1) AGNs found in the local Universe (i.e., ). These intrinsic AGN SEDs can be used in conjunction with host-galaxy templates to reproduce at least 85 per cent of the 6-35 IRS spectra of composite galaxies to within per cent as well as their 60 and 100 photometries (see §4.2 and fig. 13). We outline a procedure that uses the average intrinsic AGN infrared SED, in conjunction with a set of host-galaxy templates, to fit the broad-band infrared photometry of composite galaxies. To test how accurately this procedure can measure (a) intrinsic AGN luminosities and (b) the AGN contribution to the total infrared output of composite galaxies, we use it to fit the IRAS photometry of two independent sample of galaxies; the sample of core-resolved Seyferts described in Horst et al. (2008) and Gandhi et al. (2009) and a subsample of the 12 µm sample of Seyferts (e.g., Rush et al. 1993; Tommasin et al. 2010). The results from these tests compare favourably against other measures based on high-spatial resolution mid-infrared observations and infrared emission line diagnostics.
We summarise the main results of this study in the following points:
-
•
The intrinsic SED of moderate luminosity (i.e., ergs s-1) AGNs at 6-(15-60) µm (depending on turnover point, 15/µm60) can be described as either a single or a broken power-law. When we see a break, which typically lies between 15 and 20 µm (mean: 19 µm), the power-law spectral indices shortward of the break span the range: (mean: 1.7), where . Beyond this break, the intrinsic AGN SED always flattens, with spectral indices spanning the range (mean: 0.7). These ranges of spectral indices and and break positions are consistent with previous studies of the mid-infrared SEDs of AGNs (e.g., Buchanan et al. 2006; Wu et al. 2009). See §4.1.
-
•
All of the 11 AGN dominated infrared SEDs that we can reliably extrapolate to 100 µm are consistent with being composed of a host-galaxy component plus an intrinsic AGN component. All of the intrinsic AGN SEDs peak (in ) between 15 and 60 before falling rapidly at longer wavelengths. Despite this fall-off at long wavelengths, there are at least 3 AGNs in our sample whose observed infrared SEDs is dominated by the AGN even at 60 . See §4.2
-
•
We find evidence that the shape of the intrinsic AGN infrared SEDs is related to AGN luminosity, with more luminous AGNs having bluer intrinsic SEDs (i.e., more luminous AGNs emit, relatively, more strongly at MIR wavelengths and less strongly at FIR wavelengths) . This trend is seen both within our sample (see §4.2, fig. 6 and fig. 7) and when we compare our results with the intrinsic SEDs of more luminous quasars (see §5.2).
-
•
The range of intrinsic AGN infrared SEDs reported here are more consistent with the results of clumpy, rather than continuous, dusty torus models. These latter models, such as those described in Fritz et al. (2006), cover a much broader range of SED shapes than the intrinsic AGN infrared SEDs defined here. However, we also note that even clumpy torus models have a tendency to over-predict the intrinsic infrared emission of AGNs at . Furthermore, clumpy torus models do not produce 6-20 as steep as that of a number of AGNs in our sample. See §5.3
-
•
Using the intrinsic AGN infrared SEDs defined in §4 we define a set of correction factors to convert intrinsic AGN infrared or X-ray luminosities to total infrared luminosities (i.e., integrated 8-1000 µm luminosities). These conversion factors can be used to estimate the AGN contribution to the total infrared output of galaxies when only a single (intrinsic) infrared or X-ray constraint is available. See §7.1.
-
•
Fits to the infrared SEDs of composite galaxies can be used to measure the intrinsic 12 µm luminosities of AGNs to within a factor of 2 when only low-resolution, broad band photometry is available (§6.1). The same fits can be used to determine the intrinsic 2-10 keV X-ray luminosities to within a factor of 3 (§7.2) and the fractional AGN contribution to the overall infrared output of a composite galaxy to within 25–50 per cent (depending on whether the galaxy is AGN dominated; §6.2).
acknowledgements
We would like to thank D. Elbaz and K. M. Dasyra for their useful comments on the paper and M. Schartmann and E. Hatziminaoglou for providing us with the results from their clumpy and continuous dusty torus models, respectively. Furthermore, we would like to thank the referee, H. Netzer, for his comments, which significantly improved the quality of the paper. We gratefully acknowledge support from the Eurotalents Fellowship Program (JRM) the Leverhulme Trust (JRM; DMA), the Royal Society (DMA), an STFC Studentship (ADG) and an STFC Postdoctoral Fellowship (RCH). This work is based (in part) on observations made with the Spitzer Space Telescope and has made use of the NASA/ IPAC Infrared Science Archive, which are both operated by the Jet Propulsion Laboratory, California Institute of Technology under a contract with NASA. Support for this work was provided by NASA through an award issued by JPL/Caltech.
References
- Aird et al. (2010) Aird J., Nandra K., Laird E. S., Georgakakis A., Ashby M. L. N., Barmby P., Coil A. L., Huang J., Koekemoer A. M., Steidel C. C., Willmer C. N. A., 2010, MNRAS, 401, 2531
- Alexander et al. (2005) Alexander D. M., Bauer F. E., Chapman S. C., Smail I., Blain A. W., Brandt W. N., Ivison R. J., 2005, ApJ, 632, 736
- Avni & Tananbaum (1982) Avni Y., Tananbaum H., 1982, ApJL, 262, L17
- Barger et al. (2005) Barger A. J., Cowie L. L., Mushotzky R. F., Yang Y., Wang W., Steffen A. T., Capak P., 2005, AJ, 129, 578
- Bower et al. (2006) Bower R. G., Benson A. J., Malbon R., Helly J. C., Frenk C. S., Baugh C. M., Cole S., Lacey C. G., 2006, MNRAS, 370, 645
- Brandl et al. (2006) Brandl B. R., Bernard-Salas J., Spoon H. W. W., Devost D., Sloan G. C., Guilles S., Wu Y., Houck J. R., Weedman D. W., Armus L., Appleton P. N., Soifer B. T., Charmandaris V., Hao L., Higdon J. A., Marshall S. J., Herter T. L., 2006, ApJ, 653, 1129
- Buchanan et al. (2006) Buchanan C. L., Gallimore J. F., O’Dea C. P., Baum S. A., Axon D. J., Robinson A., Elitzur M., Elvis M., 2006, AJ, 132, 401
- Croton et al. (2006) Croton D. J., Springel V., White S. D. M., De Lucia G., Frenk C. S., Gao L., Jenkins A., Kauffmann G., Navarro J. F., Yoshida N., 2006, MNRAS, 365, 11
- Della Ceca et al. (2008) Della Ceca R., Severgnini P., Caccianiga A., Comastri A., Gilli R., Fiore F., Piconcelli E., Malaguti P., Vignali C., 2008, Mem. S. A. It, 79, 65
- Downes & Solomon (1998) Downes D., Solomon P. M., 1998, ApJ, 507, 615
- Draine (2003) Draine B. T., 2003, ARA&A, 41, 241
- Elvis et al. (1994) Elvis M., Wilkes B. J., McDowell J. C., Green R. F., Bechtold J., Willner S. P., Oey M. S., Polomski E., Cutri R., 1994, ApJS, 95, 1
- Ferrarese & Merritt (2000) Ferrarese L., Merritt D., 2000, ApJL, 539, L9
- Fiore et al. (2008) Fiore F., Grazian A., Santini P., Puccetti S., Brusa M., Feruglio C., Fontana A., Giallongo E., Comastri A., Gruppioni C., Pozzi F., Zamorani G., Vignali C., 2008, ApJ, 672, 94
- Fiore et al. (2009) Fiore F., Puccetti S., Brusa M., Salvato M., Zamorani G., Aldcroft T., Aussel H., Brunner H., Capak P., Cappelluti N., Civano F., Comastri A., Elvis M., Feruglio C., Finoguenov A., Fruscione A., Gilli R., Hasinger G., 2009, ApJ, 693, 447
- Fritz et al. (2006) Fritz J., Franceschini A., Hatziminaoglou E., 2006, MNRAS, 366, 767
- Gandhi et al. (2009) Gandhi P., Horst H., Smette A., Hönig S., Comastri A., Gilli R., Vignali C., Duschl W., 2009, A&A, 502, 457
- Gebhardt et al. (2000) Gebhardt K., Bender R., Bower G., Dressler A., Faber S. M., Filippenko A. V., Green R., Grillmair C., Ho L. C., Kormendy J., Lauer T. R., Magorrian J., Pinkney J., Richstone D., Tremaine S., 2000, ApJL, 539, L13
- Genzel et al. (1998) Genzel R., Lutz D., Sturm E., Egami E., Kunze D., Moorwood A. F. M., Rigopoulou D., Spoon H. W. W., Sternberg A., Tacconi-Garman L. E., Tacconi L., Thatte N., 1998, ApJ, 498, 579
- Goulding & Alexander (2009) Goulding A. D., Alexander D. M., 2009, MNRAS, 398, 1165
- Goulding et al. (2010) Goulding A. D., Alexander D. M., Lehmer B. D., Mullaney J. R., 2010, MNRAS, 406, 597
- Hasinger et al. (2005) Hasinger G., Miyaji T., Schmidt M., 2005, A&A, 441, 417
- Hatziminaoglou et al. (2010) Hatziminaoglou E., Omont A., Stevens J. A., Amblard A., Arumugam V., Auld R., Aussel H., Babbedge T., Blain A., Bock J., Boselli A., Buat V., Burgarella D., Castro-Rodríguez N., Cava A., Chanial P., 2010, A&A, 518, L33+
- Heckman et al. (2004) Heckman T. M., Kauffmann G., Brinchmann J., Charlot S., Tremonti C., White S. D. M., 2004, ApJ, 613, 109
- Hickox et al. (2007) Hickox R. C., Jones C., Forman W. R., Murray S. S., Brodwin M., Brown M. J. I., Eisenhardt P. R., Stern D., Kochanek C. S., Eisenstein D., Cool R. J., Jannuzi B. T., Dey A., Brand K., Gorjian V., Caldwell N., 2007, ApJ, 671, 1365
- Hickox et al. (2009) Hickox R. C., Jones C., Forman W. R., Murray S. S., Kochanek C. S., Eisenstein D., Jannuzi B. T., Dey A., Brown M. J. I., Stern D., Eisenhardt P. R., Gorjian V., Brodwin M., Narayan R., Cool R. J., Kenter A., Caldwell N., Anderson M. E., 2009, ApJ, 696, 891
- Hopkins et al. (2006) Hopkins P. F., Hernquist L., Cox T. J., Di Matteo T., Robertson B., Springel V., 2006, ApJS, 163, 1
- Hopkins et al. (2007) Hopkins P. F., Richards G. T., Hernquist L., 2007, ApJ, 654, 731
- Horst et al. (2008) Horst H., Gandhi P., Smette A., Duschl W. J., 2008, A&A, 479, 389
- Horst et al. (2006) Horst H., Smette A., Gandhi P., Duschl W. J., 2006, A&A, 457, L17
- Huchra & Burg (1992) Huchra J., Burg R., 1992, ApJ, 393, 90
- Kauffmann et al. (2003) Kauffmann G., Heckman T. M., Tremonti C., Brinchmann J., Charlot S., White S. D. M., Ridgway S. E., Brinkmann J., Fukugita M., Hall P. B., Ivezić Ž., Richards G. T., Schneider D. P., 2003, MNRAS, 346, 1055
- Kennicutt (1998) Kennicutt Jr. R. C., 1998, ARA&A, 36, 189
- Krabbe et al. (2001) Krabbe A., Böker T., Maiolino R., 2001, ApJ, 557, 626
- Laurent et al. (2000) Laurent O., Mirabel I. F., Charmandaris V., Gallais P., Madden S. C., Sauvage M., Vigroux L., Cesarsky C., 2000, A&A, 359, 887
- Le Floc’h et al. (2001) Le Floc’h E., Mirabel I. F., Laurent O., Charmandaris V., Gallais P., Sauvage M., Vigroux L., Cesarsky C., 2001, A&A, 367, 487
- Lutz et al. (2004) Lutz D., Maiolino R., Spoon H. W. W., Moorwood A. F. M., 2004, A&A, 418, 465
- Magorrian et al. (1998) Magorrian J., Tremaine S., Richstone D., Bender R., Bower G., Dressler A., Faber S. M., Gebhardt K., Green R., Grillmair C., Kormendy J., Lauer T., 1998, AJ, 115, 2285
- Maia et al. (2003) Maia M. A. G., Machado R. S., Willmer C. N. A., 2003, AJ, 126, 1750
- Maiolino & Rieke (1995) Maiolino R., Rieke G. H., 1995, ApJ, 454, 95
- Markwardt (2009) Markwardt C. B., 2009, in D. A. Bohlender, D. Durand, & P. Dowler ed., Astronomical Society of the Pacific Conference Series Vol. 411 of Astronomical Society of the Pacific Conference Series, Non-linear Least-squares Fitting in IDL with MPFIT. pp 251–+
- Mor et al. (2009) Mor R., Netzer H., Elitzur M., 2009, ApJ, 705, 298
- Mullaney et al. (2010) Mullaney J. R., Alexander D. M., Huynh M., Goulding A. D., Frayer D., 2010, MNRAS, 401, 995
- Nenkova et al. (2002) Nenkova M., Ivezić Ž., Elitzur M., 2002, ApJL, 570, L9
- Netzer et al. (2007) Netzer H., Lutz D., Schweitzer M., Contursi A., Sturm E., Tacconi L. J., Veilleux S., Kim D., Rupke D., Baker A. J., Dasyra K., Mazzarella J., Lord S., 2007, ApJ, 666, 806
- Polletta et al. (2007) Polletta M., Tajer M., Maraschi L., Trinchieri G., Lonsdale C. J., Chiappetti L., Andreon S., Pierre M., Le Fèvre O., Zamorani G., Maccagni D., Garcet O., Surdej J., Franceschini A., Alloin D., Shupe D. L., 2007, ApJ, 663, 81
- Pozzi et al. (2010) Pozzi F., Vignali C., Comastri A., Bellocchi E., Fritz J., Gruppioni C., Mignoli M., Maiolino R., Pozzetti L., Brusa M., Fiore F., Zamorani G., 2010, A&A, 517, A11+
- Prieto et al. (2010) Prieto M. A., Reunanen J., Tristram K. R. W., Neumayer N., Fernandez-Ontiveros J. A., Orienti M., Meisenheimer K., 2010, MNRAS, 402, 724
- Ramos Almeida et al. (2009) Ramos Almeida C., Levenson N. A., Rodríguez Espinosa J. M., Alonso-Herrero A., Asensio Ramos A., Radomski J. T., Packham C., Fisher R. S., Telesco C. M., 2009, ApJ, 702, 1127
- Richards et al. (2006) Richards G. T., Lacy M., Storrie-Lombardi L. J., Hall P. B., Gallagher S. C., Hines D. C., Fan X., Papovich C., Vanden Berk D. E., Trammell G. B., Schneider D. P., Vestergaard M., York D. G., Jester S., Anderson S. F., Budavári T., Szalay A. S., 2006, ApJS, 166, 470
- Rush et al. (1993) Rush B., Malkan M. A., Spinoglio L., 1993, ApJS, 89, 1
- Sanders et al. (2003) Sanders D. B., Mazzarella J. M., Kim D., Surace J. A., Soifer B. T., 2003, AJ, 126, 1607
- Sanders & Mirabel (1996) Sanders D. B., Mirabel I. F., 1996, ARA&A, 34, 749
- Schartmann et al. (2008) Schartmann M., Meisenheimer K., Camenzind M., Wolf S., Tristram K. R. W., Henning T., 2008, A&A, 482, 67
- Schweitzer et al. (2008) Schweitzer M., Groves B., Netzer H., Lutz D., Sturm E., Contursi A., Genzel R., Tacconi L. J., Veilleux S., Kim D., Rupke D., Baker A. J., 2008, ApJ, 679, 101
- Siebenmorgen & Kruegel (1992) Siebenmorgen R., Kruegel E., 1992, A&A, 259, 614
- Smith et al. (2007) Smith J. D. T., Draine B. T., Dale D. A., Moustakas J., Kennicutt Jr. R. C., Helou G., Armus L., Roussel H., Sheth K., Bendo G. J., Buckalew B. A., Calzetti D., 2007, ApJ, 656, 770
- Steffen et al. (2006) Steffen A. T., Strateva I., Brandt W. N., Alexander D. M., Koekemoer A. M., Lehmer B. D., Schneider D. P., Vignali C., 2006, AJ, 131, 2826
- Sturm et al. (2005) Sturm E., Schweitzer M., Lutz D., Contursi A., Genzel R., Lehnert M. D., Tacconi L. J., Veilleux S., Rupke D. S., Kim D., Sternberg A., Maoz D., Lord S., Mazzarella J., Sanders D. B., 2005, ApJL, 629, L21
- Telesco et al. (1984) Telesco C. M., Becklin E. E., Wynn-Williams C. G., Harper D. A., 1984, ApJ, 282, 427
- Tommasin et al. (2010) Tommasin S., Spinoglio L., Malkan M. A., Fazio G., 2010, ApJ, 709, 1257
- Tommasin et al. (2008) Tommasin S., Spinoglio L., Malkan M. A., Smith H., González-Alfonso E., Charmandaris V., 2008, ApJ, 676, 836
- Tozzi et al. (2006) Tozzi P., Gilli R., Mainieri V., Norman C., Risaliti G., Rosati P., Bergeron J., Borgani S., Giacconi R., Hasinger G., Nonino M., Streblyanska A., Szokoly G., Wang J. X., Zheng W., 2006, A&A, 451, 457
- Tran et al. (2001) Tran Q. D., Lutz D., Genzel R., Rigopoulou D., Spoon H. W. W., Sturm E., Gerin M., Hines D. C., Moorwood A. F. M., Sanders D. B., Scoville N., Taniguchi Y., Ward M., 2001, ApJ, 552, 527
- Tueller et al. (2008) Tueller J., Mushotzky R. F., Barthelmy S., Cannizzo J. K., Gehrels N., Markwardt C. B., Skinner G. K., Winter L. M., 2008, ApJ, 681, 113
- Ueda et al. (2003) Ueda Y., Akiyama M., Ohta K., Miyaji T., 2003, ApJ, 598, 886
- Vasudevan & Fabian (2007) Vasudevan R. V., Fabian A. C., 2007, MNRAS, 381, 1235
- Vignali et al. (2003) Vignali C., Brandt W. N., Schneider D. P., 2003, AJ, 125, 433
- Weedman et al. (2005) Weedman D. W., Hao L., Higdon S. J. U., Devost D., Wu Y., Charmandaris V., Brandl B., Bass E., Houck J. R., 2005, ApJ, 633, 706
- Wilkes et al. (1994) Wilkes B. J., Tananbaum H., Worrall D. M., Avni Y., Oey M. S., Flanagan J., 1994, ApJS, 92, 53
- Winter et al. (2009) Winter L. M., Mushotzky R. F., Reynolds C. S., Tueller J., 2009, ApJ, 690, 1322
- Wu et al. (2009) Wu Y., Charmandaris V., Huang J., Spinoglio L., Tommasin S., 2009, ApJ, 701, 658
Appendix A Plots of fits to the IRS spectra and IRAS photometry
In fig. 13 we present the observed SEDs of our sample of 11 AGNs that we use to defined the intrinsic infrared AGN SED. We have included in each of these plots the fits to these SEDs produced using our five host-galaxy templates (see §3) and an intrinsic AGN component (described in §4.2). Embedded in each plot is a panel showing a zoomed-in image of the fit to the 6-35 IRS spectrum and the residuals produced by subtracting the fit from the observed data.


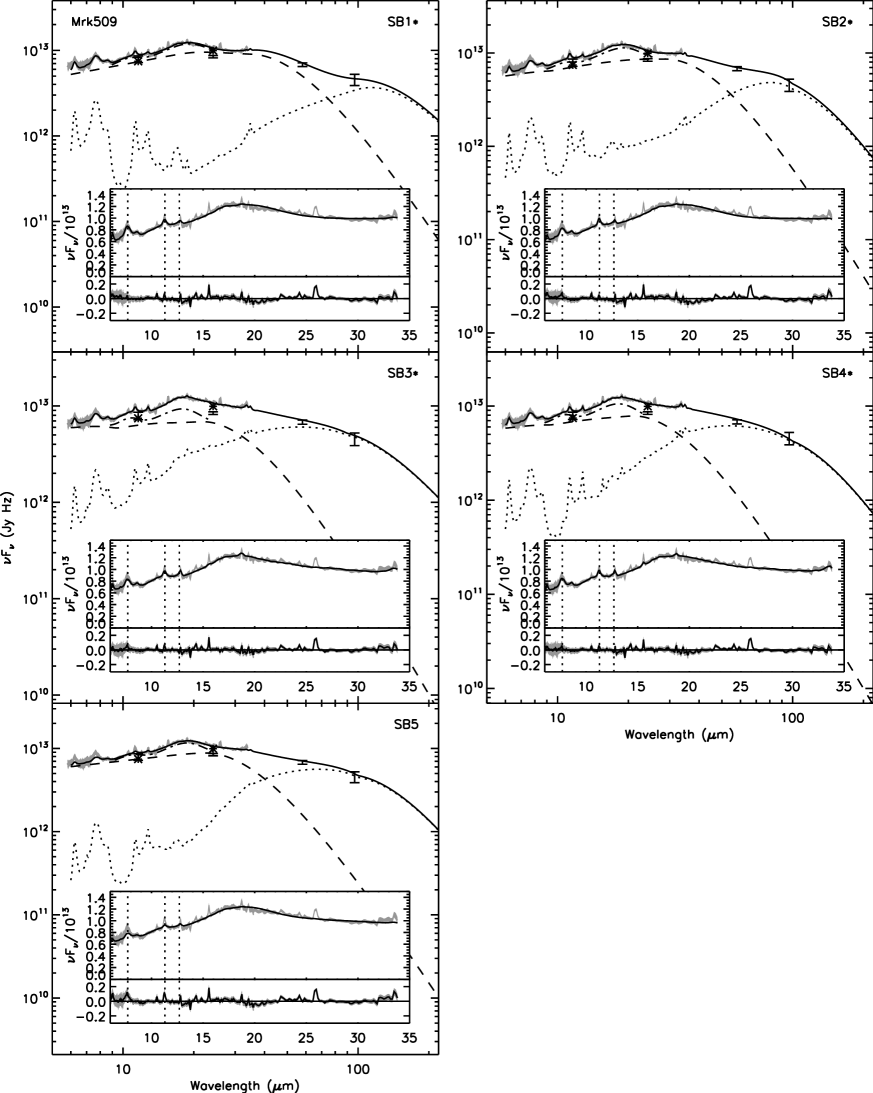

Appendix B Description of the fitting routine: decompir
The results presented in §6 and §7 were obtained using a new infrared SED fitting routine, decompir, that we have developed which uses the host-galaxy and intrinsic AGN SEDs described in §4 to measure the contribution to the infrared output of composite galaxies from these two components. In this appendix, we provide a description of the main features of decompir routine and some brief instructions for its use. 888The idl source code for decompir has been made available at http://sites.google.com/site/decompir
decompir is written in the idl programming language and uses minimisation to identify the best fitting model SED to the observed infrared data (either spectra and/or photometry) by varying the values of a set of free parameters (e.g., component normalisations, AGN component shape, level of dust extinction). decompir makes heavy use of the idl package mpfit to perform this fit.999mpfit is also publicly available from http://purl.com/net/mpfit and is described in Markwardt (2009). In its default mode, decompir will attempt to fit the supplied infrared photometry or spectrum with the average intrinsic AGN infrared SED defined in §4 plus the “SB1” host galaxy template (see §3). By default, only the normalisations of these components are allowed to vary. However, decompir can be instructed to allow any of the parameters used to describe the AGN component to vary within the range of values outlined in §4 (i.e., , , , ). decompir can also be instructed to allow the levels of extinction applied to both the host-galaxy and AGN components to vary. We note that decompir will only use one host-galaxy template at a time (i.e., an SED cannot be fit with multiple host-galaxy components). We therefore recommend that each observed SED is fit five times, once for each of the host-galaxy templates defined in §3. The best fitting SED can then be selected from the five separate fits.
Because decompir relies on minimisation to derive the best fitting parameters, the numbers of parameters that are allowed to vary depends on the number of independent flux density measurements being fit. Specifically, the number of variable parameters must be less than the number of independent flux measurements to prevent the fits from becoming degenerate. Some judgement based on the nature of the research and the number of independent flux measurements is needed in order to decide which parameters should be allowed to vary. As a guide, we provide a list of variable parameters in order of importance, with the first having the largest effect on the fitted SED: , dust extinction (both components), , silicate emission features, , (we assume that the relative normalisations of the components are always allowed to vary). For example, if only five or six independent flux measurements are available (e.g. Spitzer 8 , 24 plus Herschel 100 , 160 , 250 photometry) we suggest that only , together with the normalisations of the AGN and host-galaxy templates, is allowed to vary. We note throughout the main text that the choice of average SED template makes little difference to the results from decomposing the photometric SEDs of samples of composite galaxies. The reason why this is the case is that, at FIR wavelengths (i.e., ) the SED is typically (although not exclusively, see §4.2) dominated by the host-galaxy. Therefore, a difference of a factor of 2-3 between the intrinsic AGN SED at 100 has little effect on our results when the observed SED is per cent dominated by the host galaxy at this wavelength. However, extra care must be taken in selecting the appropriate intrinsic AGN SED when it is possible that the FIR SED is dominated by AGN emission (i.e., when the observed SED falls strongly longwards of 30 , e.g., MCG-03-34-064, IC5063, ESO103-035, Mrk 3, from this study; see fig. 5)