Spectral evolution of long Gamma Ray Burst prompt emission:
electrostatic acceleration and adiabatic expansion
Abstract
Despite the great variation in the light curves of Gamma Ray Burst (GRB) prompt emission, their spectral energy distribution is generally curved and broadly peaked. In particular, their spectral evolution is well described by the hardness-intensity correlation during a single pulse decay phase, when the SED peak height decreases as its peak energy decreases. We propose an acceleration scenario, based on electrostatic acceleration, to interpret the distribution peak at 0.25 MeV. We show that during the decay phase of individual pulses in the long GRB light curve, the adiabatic expansion losses likely dominate the synchrotron cooling effects. The energy loss as due to adiabatic expansion can also be used to describe the spectral evolution observed during their decay phase. The spectral evolution predicted by our scenario is consistent with that observed in single pulses of long BATSE GRBs.
Subject headings:
stars: gamma-ray burst: general, radiation mechanisms: non-thermal, acceleration of particles.1. Introduction
The acceleration mechanisms and the radiative processes underlying the prompt emission in long GRBs are still unclear. Their large energies released on short timescales likely requires that the radiation is produced in a highly relativistic jet (e.g. Mészáros 2002).
We may consider that a GRB consists of fundamental units of emission, or pulses, in the light curve (e.g. Norris et al. 1996, Stern & Svensson 1996). The pulse structures generally show a sharp rise and a slower decay phase to the background flux threshold. However, GRBs exhibit a wide variety of light curves, both in shape and in duration, and the combination of many such pulses could create the observed diversity and complexity of light curves (Fishman et al. 1994).
GRB spectral energy distributions (SEDs) are generally curved and broadly peaked. They are usually well described by the Band function (Band et al. 1993) or, as shown more recently, by the simpler (and physically motivated) log-parabolic model (Massaro et al. 2010, hereinafter M10). Kaneko et al. (2006, 2008) investigated the time resolved spectral behavior of the GRBs in the BATSE catalog (Paciesas et al. 1999) and showed that the distribution of their SED energy peaks, , is symmetric around 0.25 MeV (Goldstein et al. 2010).
As reported in the analysis of Ryde & Svensson (2002), the GRB spectral evolution during the decay phase of individual pulses can be described by the hardness-intensity correlation (HIC) between the time resolved SED peak height, (defined as and proportional to the total flux measured at ), and the peak energy in the form of a power-law: , where the distribution of the parameter peaks at value 1.7 (Borgonovo & Ryde 2001).
Subsequently, Ryde & Petrosian (2002) showed that a powerlaw form (i.e. ) can be reproduced through kinematic effects when applied to a spherical shell expanding at extreme relativistic velocity. The curvature of a relativistic shell would make the photons emitted off the line of sight delayed and affected by a varying Doppler boost as a result of the increasing angle at which the photons are emitted with respect to the observer. They show that these so called curvature effects, characterized by a time scale , display a similar trend to that of the hardness-intensity correlation (HIC) observed in the GRB spectral evolution, with the parameter =2 then expected. However, they also argued that an intrinsic correlation between these two spectral parameters in the GRB prompt emission could affect the observed HIC (see also Kocevski et al. 2003). These curvature effects are dependent on the radius of the emitting shell, and are likely to be negligible if 1013 cm.
Motivated by these observations, we propose an acceleration scenario to explain the observed distribution of individual pulses in long GRBs. We also show that losses for adiabatic expansion play an important role during the decay phase and could be more relevant than synchrotron radiative cooling. Finally, we argue that the observed spectral behavior of long pulses, during the GRB decay phase of the light curve, can be described taking into account the energy loss for adiabatic expansion.
For our analysis, we use cgs units and we assume a flat cosmology with km s-1 Mpc-1, and (Dunkley et al. 2009). Unless stated otherwise, primed quantities refer to the observer reference frame while unprimed quantities refer to the GRB frame.
2. Electrostatic acceleration mechanism
We propose a particle acceleration scenario to explain the distribution around the observed value of 0.25 MeV. We assume that the acceleration mechanisms occurring during the GRB prompt emission are a combination of systematic acceleration, responsible for the energy peak position of the accelerated particle energy distribution (PED), and stochastic acceleration, which accounts for the broadening of the PED around its peak (M10).
As proposed by Cavaliere & D’Elia (2002) for Blazar jets, GRBs could be powered by the Blandford & Znajek mechanism (1977) for the extraction of rotational energy from a spinning Black Hole (BH) via the Poynting flux associated with the surrounding magnetosphere. In these magnetospheres, the electric fields parallel to magnetic fields can accelerate charged particles. They can arise, for example, as a result of magnetic field reconnection in current sheets or MHD jet instabilities (e.g. Litvinenko 1996, Medvedev & Loeb 1999).
The force free condition governing these magnetospheres breaks down when the electric field . In particular, electric fields are electrodynamically screened out at distances that exceed the Debye length, , that for a pair plasma is defined as:
| (1) |
where is the plasma frequency, is the electron Lorentz factor, is the electron mass, its electric charge, the speed of light, the magnetic field and the plasma density. Electric fields parallel to magnetic fields accelerate charged particles and consequently, the particle energy gain for each acceleration step can be written as:
| (2) |
Substituting from Equation (1), we obtain an expression for the Lorentz factor of the accelerated particle:
| (3) |
We note that the above expression is similar to the assumption that the electron energy density is twice the magnetic energy density , close to the equipartition condition.
With the above acceleration scenario, for an emitting region with particle density n 5108 cm-3, a magnetic field 104 G and a beaming factor 100, all of which are typical values for GRB models (e.g. Zhang & Mészáros et al. 2002), the synchrotron energy peak is 0.3 MeV, in agreement with the observed distribution. We argue that the variance of the distribution can be due to the dispersion of the other parameters and their intrinsic variations during the burst. The Poynting flux in the current sheet provides its luminosity, which can be estimated as = , where and are the current sheet width and its length, respectively (Litvinenko 1999).
The typical observed isotropic luminosity of a GRB is 1052 erg s-1 so the intrinsic equivalent value, rescaled for a beaming factor of 100, is = / 1044 erg s-1. Assuming 1013 cm, as derived from the GRB variability timescale (i.e. 0.1 s), the Poynting flux in a single current sheet is 1044 erg s-1, the same order of magnitude of the GRB intrinsic luminosity.
3. Particle energy losses
A simple scenario to describe single pulses in long GRB light curves assumes an impulsive heating of particles and a subsequent cooling and emission. The rise phase of pulses is attributed to particle acceleration energizing the emitting region while the decay phase reflects the particle energy losses. In the following, we show that adiabatic expansion is the main process responsible for the particle energy losses during the decay phase of single pulses. This is also supported by the fact that the synchrotron cooling time appears too short to account for the decay of GRB pulses. In addition, the observational evidence that GRB SEDs are curved (e.g. log parabolic) and not the superposition of two power laws (e.g. Band function) is a strong indication that stochastic acceleration occurs during the prompt emission (M10). This suggests that both systematic acceleration (e.g. due to electric fields) and stochastic acceleration mechanisms (e.g. due to turbulence) balance the synchrotron radiative losses.
We neglect the radiative losses from inverse Compton emission, since GRB prompt emission does not appear to be dominated by the high energy -ray component (i.e. 100 MeV, Abdo et al. 2009).
The adiabatic expansion of the emitting region can be described by a self similar model in which the temporal evolution of the radius and consequently the density, can be expressed as:
| (4) |
where is the expansion index and is positive (i.e. ), and is the reference time. The rate of expansion of the emitting region is defined by the relation:
| (5) |
and the adiabatic expansion losses of a single particle can be written as:
| (6) |
for which the analytical solution is:
| (7) |
Assuming conservation of the magnetic flux, we can express the temporal evolution of its value as:
| (8) |
where is the initial value at time . We note that by replacing the relation for the magnetic flux conservation (Equation (8)) and for the temporal evolution of the particle density (Equation (4) in Equation (3), we obtain the same temporal evolution for the particle energy as derived in Equation (7). Consequently, the assumption of the conservation of the magnetic flux is in agreement with the electrostatic acceleration scenario.
The ratio between the energy losses due to synchrotron radiative cooling and adiabatic expansion is:
| (9) |
where is the magnetic field evaluated at the initial time , and is the Thomson cross section.
By substituting Equation (3) into Equation (9), the ratio of energy losses can be also written as:
| (10) |
We assume , as in the case of constant expansion rate (i.e. ) or expansion with constant energy (i.e. , Sedov phase condition). Then, for typical values of the prompt emission region, during ther decay phase, G and cm-3, the synchrotron radiative losses are dominated by those of the adiabatic expansion (i.e. ) after a time interval of 1 s. We also note that for a more compact source with 104 G and cm -3, is 10 s.
Finally, we remark that the synchrotron cooling time is dependent on the particle energy, with . In contrast, the energy loss time due to adiabatic expansion, (see Equation (6), is energy independent and so does not affect the shape of the particle energy distribution during the decay phase. Therefore, if the synchrotron cooling is the main energy loss mechanism, we expect a drastic change in the curvature of the observed spectra, making them narrower with time, while energy losses for adiabatic expansion should preserve the spectral curvature (e.g. Massaro et al. 2006).
4. Spectral evolution of pulse decay phase
To interpret the hardness-intensity correlation we note that in a synchrotron scenario, the intrinsic energy peak of the spectral energy distribution depends on the magnetic field and the electron energy as , while the maximum of the SED evaluated at this energy is , where is the total number of emitting particles (e.g. Massaro et al. 2008). Applying the corrections due to the adiabatic expansion losses (i.e. Eq. 7 and Eq. 8) and assuming the number of emitting particles is (approximately) constant, we find that the intrinsic parameters and have temporal dependence:
| (11) |
This gives the expected intrinsic relation between the two SED parameters and as a power-law: , independent of the value of the expansion index . The relativistic corrections (due to the relativistic beaming or curvature effects, e.g. Ryde & Petrosian 2002) do not affect the intrinsic correlation between and . Therefore, the expected observed power-law index is still 1.5, and thus near the peak of the distribution estimated for the pulse decay phase of long GRBs. In addition, assuming that the size of the emitting region is 1013 cm, the curvature effects are negligible, because their timescale is too short s to explain the pulse decay in long GRBs. Thus, we describe the decay phase in the GRB prompt emission has energy loss dominated by adiabatic expansion, assuming that the acceleration energy gain, via systematic and stochastic acceleration, balances the synchrotron radiative cooling..
We note that the PED in the form of a log-parabolic function is a good approximation for the solution of the kinetic equation for the particles when considering terms taking into account systematic and stochastic acceleration as well as including synchrotron radiative losses and adiabatic expansion (Kardashev 1962, Tramacere et al. 2009, Paggi et al. 2009, M10).

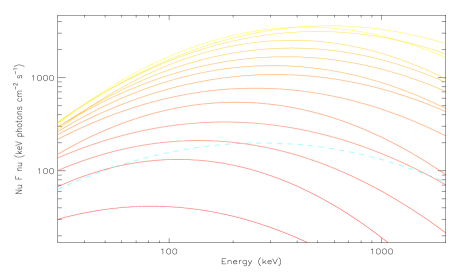
We calculate the synchrotron emission of an adiabatically expanding spherical region assuming an emitting PED with a log-parabolic shape: where (i.e. the peak of ) is , is PED curvature and is the density (see M10). Then, as shown in Figure 1, the spectral curvature of the synchrotron SED is constant during the pulse decay phase.


In Figure 2, we show the time resolved spectral analysis of the decay phases for two long, single pulse BATSE GRBs, to compare our model with the observed spectral behavior.
We adopted the log-parabolic function (i.e. , see M10) to describe the time resolved SED and to measure the spectral curvature .
In Figure 2, we show that, the examples of GRB 941026 and GRB 950818 do not show significant variation of their curvature during their pulse decay phases, in agreement with the scenario dominated by adiabatic expansion losses.
The detail of the spectral behavior observed during the decay phase (i.e. between 66 and 70 s) of GRB 950818 is also shown in Figure 3. The curvature is not drastically varying over the whole burst, in agreement with our scenario (Figure 1).
We also note the presence of small fluctuations in , which appear to be anti-correlated with secondary peaks in the GRB light curve. As already pointed out by Vetere et al. (2007) from the analysis of the BeppoSAX WFC archive, the low energy (i.e. 2 - 30 keV) GRB light curves are characterized by peaks superposed on a slowly evolving component. A more detailed analysis of these fluctuations will be presented in a forthcoming paper.
5. Conclusions
We propose an electrostatic acceleration scenario to interpret the distribution of GRB time resolved SEDs. We show that taking into account adiabatic expansion losses it is possible to describe the spectral evolution during the decay phase of individual pulses in long GRBs. Our model assumes that the particle energy gain is due to both systematic and stochastic particle acceleration, while the particle energy losses are due to synchrotron emission and adiabatic expansion.
Describing the systematic acceleration in terms of electric field energy gain, we derive a simple relation for the expected particle Lorentz factor, 104-105. Thus, for a typical GRB magnetic field of 104 G, a plasma density of 108 cm-3,and a beaming factor 50 - 100 the expected synchrotron peak energy is 0.3 MeV as found for the observed distribution (e.g. Kaneko et al. 2006). This may explain the non uniform time resolved distribution of the GRB SED peaking around a characteristic value.
Following the assumption that systematic and stochastic acceleration mechanisms balance the synchrotron radiative cooling, and the adiabatic expansion loss is the main process governing GRB spectral evolution during the decay phase of individual pulses, we derive that the expected intrinsic scaling relation between the height of the SED and its peak energy is , which agrees with the observed HIC for single pulses in long GRBs.
Finally, on the basis of our assumptions, we note that the adiabatic losses do not change the shape of the SED during the prompt emission. We showed that this is consistent with the spectral behavior of the decay phase of single pulses during long GRB prompt emission as in the cases of GRB 941026 and 950818, for which we did not detect any large variation in the spectral curvature throughout the spectral evolution.
F. Massaro is grateful to R. Preece for comments to the manuscript.
He also thanks M. Petrera, A. Cavaliere and A. Paggi
for helpful suggestions on the acceleration mechanisms.
Finally, he is grateful to M. Salvati for providing useful suggestions that helped us to improve the presentation.
F. Massaro acknowledges the Foundation BLANCEFLOR Boncompagni-Ludovisi, n’ee Bildt
for the grant awarded him in 2010. His at SAO is also supported by NASA grant NNX10AD50G.
References
- (1) Abdo, A. A. et al. 2009 ApJ, 706L, 138
- (2) Band, D. L. et al. 1993, ApJ, 413, 281
- (3) Blandford, R. D., Znajek, R. L. 1977 MNRAS, 179, 433
- (4) Borgonovo, L. & Ryde, F. 2001 ApJ, 548, 770
- (5) Cavaliere, C. & D’Elia V. 2002 ApJ, 571, 226
- (6) Dunkley, J. et al. 2009 ApJ, 701, 1804
- (7) Fishman, G. J. et al. 1994 ApJS, 92, 229
- (8) Goldstein, A., Preece, R. D., Briggs, M. S. 2010 ApJ, 721, 1329
- (9) Kaneko, Y. et al. 2006 ApJS, 166, 298
- (10) Kaneko, Y. et al. 2008 ApJ, 677, 1168
- (11) Kardashev, N. S., 1962, SvA, 6, 317
- (12) Kocevski, D., Ryde, F., Liang, E. 2003 ApJ, 596, 389
- (13) Litvinenko, Y. E. 1996 ApJ, 462, 997
- (14) Litvinenko, Y. E. 1999 A&A, 349, 685
- (15) Massaro, E. et al. 2006 A&A, 448, 861
- (16) Massaro, F. et al. 2008 A&A 478, 395
- (17) Massaro, F., Grindlay, J. E. & Paggi, A. 2010 ApJ, 714L, 299
- (18) Medvedev, M. V. & Loeb, a. 1999 ApJ, 526, 697
- (19) Mészáros, P. 2002 ARA&A, 40, 137
- (20) Norris, J. P. et al. 1996 ApJ, 459, 393
- (21) Paciesas, W. S. et al. 1999 ApJS, 122, 465
- (22) Paggi, A., Massaro, F., Vittorini, V. et al. 2009 A&A, 504, 821
- (23) Ryde, F. & Svensson, R. 2002 ApJ, 566, 210
- (24) Ryde, F. & Petrosian, V. 2002 ApJ, 578, 290
- (25) Tramacere, A., Giommi, P., Perri, M. et al. 2009 A&A, 501, 879
- (26) Stern, B. E. & Svensson 1996 ApJ, 469L, 109
- (27) Vetere, L. et al. 2007 A&A, 473, 347
- (28) Zhang, B. & Mészáros, P. 2002 ApJ, 581, 1236