Suppression of geometrical barrier in Bi2Sr2CaCu2O8+δ crystals by Josephson vortex stacks
Abstract
Differential magneto-optics are used to study the effect of dc in-plane magnetic field on hysteretic behavior due to geometrical barriers in Bi2Sr2CaCu2O8+δ crystals. In the absence of an in-plane field a vortex dome is visualized in the sample center surrounded by barrier-dominated flux-free regions. With an in-plane field, stacks of Josephson vortices form vortex chains which are surprisingly found to protrude out of the dome and into the vortex-free regions. The chains are imaged to extend up to the sample edges, thus providing easy channels for vortex entry and for drain of the dome through geometrical barrier, suppressing the magnetic hysteresis. Reduction of the vortex energy due to crossing with Josephson vortices is evaluated to be about two orders of magnitude too small to account for the formation of the protruding chains. We present a model and numerical calculations that qualitatively describe the observed phenomena by taking into account the demagnetization effects in which flux expulsion from the pristine regions results in vortex focusing and in the chain protrusion. Comparative measurements on a sample with narrow etched grooves provide further support to the proposed model.
pacs:
74.25.Ha, 74.25.Op, 74.25.Uv, 74.25.WxI introduction
One of the most prominent characteristics of type II superconductors is the large magnetic hysteresis that arises from the existence of potential barriers that impede vortex motion.Blatter et al. (1994) There are several sources of potential barriers: pinning due to quenched material disorder in the bulk of the sample, surface pinning produced by the roughness of the sample surface,Pautrat et al. (2004) Bean-Livingston surface barrier arising from the force between a vortex parallel to a surface and its image,Bean and Livingston (1964) and geometrical barrier (GB) that arises from the force due to Meissner currents in thin slab-shaped superconducting samples in perpendicular field.Zeldov et al. (1994a); Indenbom et al. (1994); Benkraouda and Clem (1996); Brandt (1999a, b); Schuster et al. (1994); Clem (2008)
Strong vortex pinning and the associated magnetic hysteresis are vital elements in superconductor applications that are based on high critical currents. The magnetic hysteresis, however, masks the equilibrium magnetization properties, the study of which is essential for comprehension of the thermodynamic structure of the vortex matter. In order to overcome this limitation, vortex shaking has been employed in recent years, which was shown to suppress the magnetic hysteresis very effectively at not too low temperatures.Willemin et al. (1998); Avraham et al. (2001); Beidenkopf et al. (2005) In this method an ac in-plane field is applied in addition to the main dc which causes local shaking and equilibration of the vortices. dc in-plane fields were also shown to reduce the magnetic hysteresis.Tamegai et al. (2004a); Bending et al. (2004); Kasahara et al. (2005); Konczykowski et al. (2006); Gutman et al. (2010)
Vortex shaking was found to suppress the hysteresis that arises either from bulk pinning that is usually the dominant source of hysteresis at lower temperatures, surface barriers that often dominate vortex dynamics at elevated temperatures and fields,Majer et al. (1995); Van der Beek et al. (1996); Fuchs et al. (1998a, b); Beidenkopf et al. (2009); Böhmer et al. (2010) and GB’s that commonly govern the hysteresis at high temperatures and low fields.Zeldov et al. (1994a); Indenbom et al. (1994); Majer et al. (1995); Morozov et al. (1997); Böhmer et al. (2010) Detailed theoretical studies explained the suppression of bulk pinning hysteresis by vortex shaking in terms of the Bean model in a turning magnetic field.Brandt and Mikitik (2002); Mikitik and Brandt (2003, 2004) This description may similarly apply to the case of surface pinning. Also the suppression of the Bean-Livingston surface barrier hysteresis could possibly be understood in terms of easier vortex loop nucleation at the sample corners for tilted vortices.Burlachkov et al. (1994) In the above mechanisms the potential barriers are microscopic and hence local ac displacement or tilting of a vortex segment in the presence of an average dc driving force can enhance vortex activation and relaxation. In contrast, the GB in a platelet sample gives rise to a vortex dome in the center of the sample surrounded by a vortex-free region.Zeldov et al. (1994a); Indenbom et al. (1994); Benkraouda and Clem (1996); Brandt (1999a, b) This vortex-free region constitutes a large barrier that has a macroscopic energy scale of the order of the vortex line tension times the sample thickness and a macroscopic length scale of the order of sample’s width. As a result, this barrier cannot be overcome by any local vortex perturbation or tilting. Hence the experimental observation that the vortex shaking by the in-plane field suppresses the hysteresis due to GB was highly surprising and has remained unresolved so far.
In this paper we describe a possible resolution of this question in the case of layered superconductors by investigating the GB behavior in the presence of a dc in-plane field. In highly anisotropic layered materials like Bi2Sr2CaCu2O8+δ (BSCCO) the in-plane field results in the formation of stacks of Josephson vortices (JV’s).Clem (1991); Bulaevskii et al. (1992); Koshelev (1999) The addition of causes the formation of crossing lattices in which stacks of pancake vortices (PV’s) form chains along the Josephson vortices.Koshelev (1999); Grigorenko et al. (2001); Bending and Dodgson (2005); Tokunaga et al. (2003); Bolle et al. (1991); Vlasko-Vlasov et al. (2002); Tamegai et al. (2004b) Surprisingly, we find that these chains exist also outside the vortex dome, protruding like vortex whiskers into regions that are vortex free in the absence of . As a result, easy channels are apparently formed that allow vortex penetration through the macroscopic GB suppressing the hysteresis. This observation appears to be inconsistent with theoretical expectations since the reduction in the energy of the pancake stack by the Josephson vortices should be much smaller than the height of the geometrical barrier.Zeldov et al. (1994a); Koshelev (1999) Therefore, the regions outside the vortex dome should have remained vortex free even in the presence of and no significant suppression of the barrier should occur. We propose an explanation to this phenomenon in terms of interaction between JV’s and PV’s that is enhanced by the demagnetization effects in platelet geometry. We demonstrate this scenario by studying vortex behavior in a sample with a shallow and narrow groove etched into its surface using a focused ion beam (FIB).
II geometrical barrier
The GB is a macroscopic potential barrier that vortices have to overcome in order to enter or leave the sample and is the main source of magnetic hysteresis in thin slab-shaped samples with weak pinning. The barrier is formed by the interplay between the vortex line tension and the Lorentz force that is induced by the circulating Meissner currents.Zeldov et al. (1994a); Indenbom et al. (1994); Benkraouda and Clem (1996); Brandt (1999a, b); Schuster et al. (1994); Clem (2008) In a sample with elliptical cross section, for example, the energy of a test vortex has two contributions: the positive vortex line energy increases gradually from zero at the edge of the sample to a value of in the center ( is the vortex line energy per unit length and is the sample thickness). The Meissner currents that flow over the entire surface exert inward forces on the vortex that gradually lower its energy as it moves toward the center. In a sample with elliptical cross section the two contributions cancel out rendering a constant vortex energy and a corresponding position independent and reversible induction . In a platelet sample of rectangular cross section, in contrast, by cutting through the sharp rims, the vortex attains its full line energy within a distance of the order of from the edge,Zeldov et al. (1994a) while the Meissner currents remain distributed as in elliptical sample.Zeldov et al. (1994b) As a result, a geometry related barrier of height of the order of is formed that extends over a width of the order of the half width of the sample, .Zeldov et al. (1994a); Indenbom et al. (1994); Benkraouda and Clem (1996); Brandt (1999a, b); Schuster et al. (1994); Clem (2008); Morozov et al. (1997) Consequently, when the field is increased above the penetration field vortices entering through the edges are swept by the Meissner currents toward the center where they accumulate giving rise to a dome shaped induction profile of width , see Fig. 1(c). The vortex-filled dome is current free while the surrounding vortex-free region carries the Meissner currents. The induction profile, with a central dome surrounded by an area of zero is very distinctive and is the hallmark of the GB model. The vortices in the dome cannot leave the sample since they are trapped by the barriers due to the Meissner currents in the surrounding flux-free regions. Thus, when the field is decreased the dome expands, while keeping the total flux in it constant, giving rise to hysteretic magnetization. Only when the dome reaches the edges the barriers vanish allowing vortices to leave the sample.
III Experimental Details
Several over-doped and optimally-doped BSCCO samples were studied. We present here data of two over-doped samples, with a critical temperature of K, cleaved from one thick crystal, sample A and sample B, with platelet shapes of length , width and thicknesses of and respectively. Similar results were obtained from optimally doped crystals.Gutman et al. (2010) The differential magneto-optical (DMO) techniqueSoibel et al. (2000) was used to study the induction profiles and the magnetization behavior of the samples. By minimizing the distance between the magneto-optical indicator and the sample, and by utilizing differential imaging we achieved high visibility of the vortex chains and studied their effect on hysteretic magnetization. The total exposure time of a differential image was typically 2 to 3 minutes. We found that following a field ramp the JV’s often show slow relaxation for about two minutes, during which their position within the sample changed. Thus quality images of the chains could be achieved by waiting 2 to 3 minutes between the end of a field ramp and the beginning of image exposure. In order to simulate the effect of JV’s, we also studied the magnetic behavior of crystal A after two fine grooves, 80 and 160 nm deep and 350 nm wide, were etched on the surface using an FEI Helios Focused Ion Beam system.
IV results
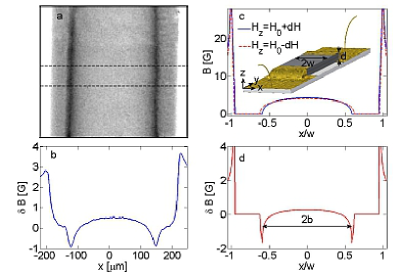
In order to visualize the vortex dome structure with enhanced sensitivity, we carried out DMO with either field modulation or current modulation. In the former case, images taken at are subtracted from images taken at and few tens of such differential images are averaged resulting in the differential image .Soibel et al. (2000) When the field is modulated by the vortex dome expands and shrinks periodically, keeping the total flux in the dome constant; see Fig. 1(c). As a result, when the field is raised to the induction in the center of the dome is increased giving rise to a positive signal, while the induction near the dome edges is decreased resulting in a negative there,Morozov et al. (1996, 1997); see Fig. 1(d). This effect is clearly visible in the DMO data in Figs. 1 (a) and (b), in which the edges of the dome appear as dark regions of negative values.
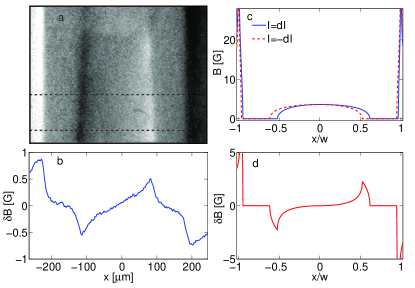
In DMO with current modulation, images taken in the presence of transport current are subtracted from images taken at and averaged.Banerjee et al. (2004) Since the Meissner currents flow in the opposite directions on the two sides of the dome, the applied transport current increases the total current flowing on one side of the dome and reduces the current on the other side. As a result, the dome is shifted away from the center as shown in Fig. 2(c). Therefore, in the current modulated DMO images one edge of the dome will appear as a bright strip with a positive signal and the other as a dark strip with a negative signal as shown theoretically in Fig. 2(d) and experimentally in Figs. 2 (a) and (b). Note also that the self-induced magnetic field of the transport current has an opposite sign at the two edges of the sample. As a result in DMO image with current modulation one edge of the sample is dark while the other is bright, Fig. 2(a), in contrast to DMO with field modulation in which both edges appear bright, Fig. 1(a).
We now analyze the behavior of the dome width, , along the magnetization loop. Figure 3(a) shows the calculated behavior of using the GB formalism of Refs. Zeldov et al., 1994a; Morozov et al., 1997; Zeldov et al., 1994c. Initially the sample is in the Meissner state () which is retained until , above which flux starts entering the sample causing to increase rapidly. As is further increased, asymptotically approaches its maximum value , corresponding to the dome width at which the potential barrier vanishes. If the field is decreased from an intermediate value, first expands to while the total flux in the dome remains constant (open circles in Fig. 3(a)). When the field is further reduced, remains at its maximal value allowing the vortices to exit through the edges. The corresponding calculated local magnetization loop is shown in Fig. 4(a).
It can be readily shownZeldov et al. (1994a) that both the ascending and descending magnetization branches are energetically metastable. Compared to the equilibrium conditions, at which the vortices in the dome have the same energy as the vacuum , on increasing (decreasing) field the vortex energy is negative (positive), the dome is narrower (wider), there is a deficiency (excess) of vortices in the sample and the magnetization is lower (higher) than at equilibrium. The dashed lines in Figs. 3(a) and 4(a) show the corresponding equilibrium behavior of the dome width and of the local magnetization.
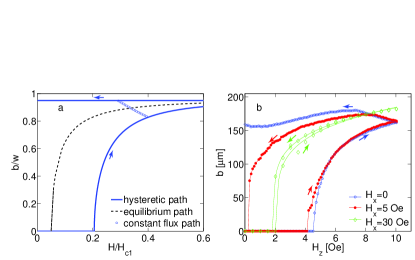
Figure 3(b) shows the experimentally measured dome width along the magnetization loop in sample B. In the absence of an in-plane field () the behavior is qualitatively very similar to the theoretical GB curve shown in Fig. 3(a). On increasing the sample is initially in the Meissner state () until Oe where starts increasing rapidly. On decreasing from its maximum value (10 Oe), continues to increase initially until it reaches a maximum value, which is then roughly retained on further field decrease.111The slight decrease in the value of on decreasing field can be readily attributed to small remnant in-plane field considering the dramatic effect of non-zero , and to the finite field modulation used in DMO imaging. This hysteretic behavior of the GB is markedly altered by the presence of even a small in-plane field. For Oe the penetration field is slightly reduced to Oe and the ascending field branch is similar to the case. However, on the descending branch, is significantly below its maximum value and decreases rapidly, reaching zero at finite . The shrinkage of the dome width on decreasing field is in sharp contrast with GB model according to which vortices are trapped in the dome as long as the surrounding vortex-free region is present (), and can leave the sample only when dome reaches the sample edges (). This indicates that in the presence of in-plane field the vortices can surprisingly exit the sample by permeating through the vortex-free region that is impenetrable within the GB model. At a higher in-plane field Oe the dome is formed already at Oe, it shrinks back to zero with decreasing field for Oe, and the dome width behaves essentially reversibly following the equilibrium curve (dashed) of Fig. 3(a). This shows that the vortices in the dome are effectively in equilibrium with the vacuum and unexpectedly can now readily move in and out of the dome through the vortex-free region as is varied.
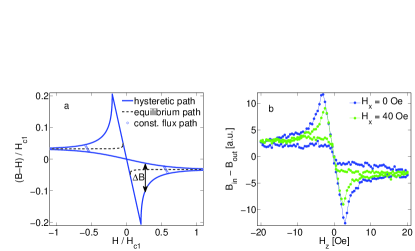
The DMO imaging allows a very sensitive measurement of the dome width, but cannot provide a measure of the dc magnetization. In order to analyze the sample magnetization we have carried out a dc MO study in sample A. Due to the lower sensitivity the resulting data in Fig. 4(b) are nosier and less accurate, but qualitatively consistent. Figure 4(a) shows the calculated local magnetization loop in the center of the sample (solid lines) along with the equilibrium magnetization (dashed line). The large hysteresis is the result of the GB that gives rise to wide flux free regions on ascending field and essentially no flux-free regions on descending field. The experimentally measured local magnetization loop using MO imaging without modulation is shown in Fig. 4(b). In the absence of an in-plane field () the behavior is consistent with the GB model. Application of , however, significantly reduces the hysteresis on the ascending and descending branches showing that facilitates both vortex entry and exit.
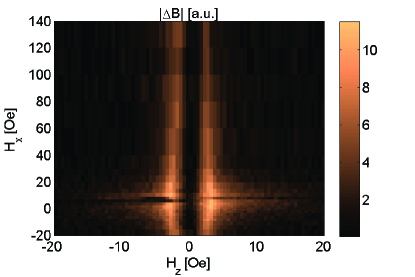
In order to quantify the reduction of the magnetic hysteresis we plot in Fig. 5 the measured hysteresis width, (see Fig. 4(a)), as a function of and . The figure shows that as is increased the hysteresis is suppressed significantly, however, the loop does not close completely and some hysteresis is seen around the penetration field, even at the highest in-plane field we measured, 140 Oe.
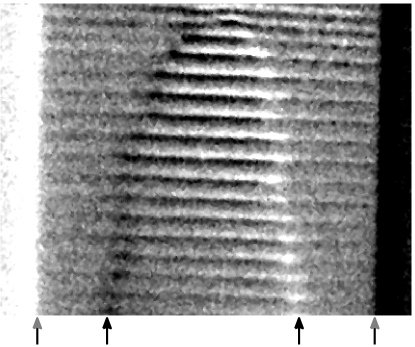
The evidence shown so far points to the fact that the JV’s introduced by the in-plane field significantly reduce the effectiveness of the geometrical barriers for some reason. In order to comprehend the microscopic origin of this phenomenon we have optimized our DMO imaging technique to resolve the PV chains along the JV’s. The stacks of PV’s that decorate the stacks of JV’s were previously observed by Bitter decoration,Bolle et al. (1991); Grigorieva et al. (1995) scanning Hall probesGrigorenko et al. (2001, 2002) and MO imaging.Vlasko-Vlasov et al. (2002); Tokunaga et al. (2003); Tamegai et al. (2004b) We find that by adjusting the modulation parameters the visibility of the chains can be greatly enhanced using either field or current modulation. This is demonstrated in Fig. 6, where the vortex chains are clearly visible as bright slightly tilted horizontal lines that are aligned along the direction of the in-plane field . We verified that these lines are indeed vortex chains decorating the stacks of JV’s by rotating the in-plane field and by varying . We find that the lines are always aligned along the direction of and their separation follows with , where is the flux quantum and is the anisotropy parameter. In Fig. 6 the vortex dome is visible as a half-oval envelope that has a bright contrast on the right-hand-side and dark on the left-hand-side due to the current modulated DMO. We expect PV’s to be present only inside the dome, residing on the JV stacks and between them depending on field strength,Koshelev (1999) while in the vortex-free regions outside the dome the PV’s should be absent due to the large Meissner currents and correspondingly high vortex potential.Zeldov et al. (1994a); Indenbom et al. (1994); Benkraouda and Clem (1996); Brandt (1999a, b) The striking observation in Fig. 6 is that the vortex chains are visible both inside the dome as well as outside the dome forming whisker-like protrusions that extend all the way to the sample edges. This means that in the presence of an in-plane field PV’s can reside in the regions outside the dome that are vortex free in the absence of . A similar situation was observed by decoration experiments on BSCCO crystals in Ref. Tamegai et al., 2004a. In Fig. 6 the vortex chains inside the dome have a stronger contrast as compared to the chains outside the dome. We find that this is not always the case and the whiskers may have stronger contrast than the chains in the dome depending on the field and modulation parameters.
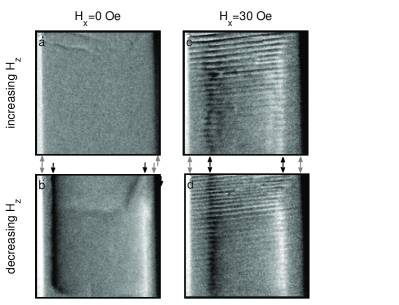
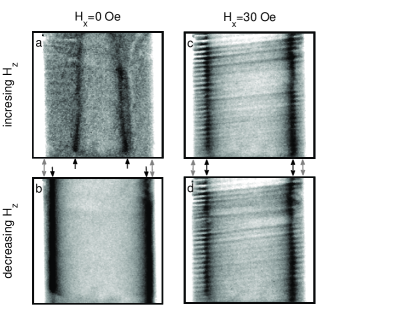
We now present the hysteretic behavior of the dome with and without . Figure 7(a) shows a DMO image using current modulation at Oe in the absence of an in-plane field. At this field the sample is in the Meissner state on the ascending branch and the vortex dome is absent, since . On the descending branch, however, the sample is in the mixed state and the dome is maximal as shown in Fig. 7(b). This highly hysteretic behavior of the dome is the result of flux trapping due to GB. In contrast, in the presence of Oe the dome has the same width on the ascending and the descending fields, showing that the vortices are in equilibrium state. Figure 8 shows similar DMO images using field modulation at Oe. In absence of an in-plane field Fig. 8(a) shows a narrow dome just above the penetration on ascending field, while Fig. 8(b) shows a very wide dome on the descending branch. When Oe is applied, the domes on ascending and descending branches become essentially identical. A movie showing the complete magnetization loop from which the Fig. 8 is extracted is available in Ref. Aux, .
The energy of the PV’s that reside on JV’s is lower due to their attractive interaction. Since the JV’s transverse the entire sample, one could argue that the energy of the PV’s could be lowered sufficiently by the JV stacks to extend into the GB in the vortex free region. The GB energy scale is , where , with the barrier being highest near the sample edges and gradually decreasing toward the dome.Zeldov et al. (1994a) The JV-PV interaction strength per unit length of the PV stack, is given by crossing energyKoshelev (1999)
| (1) |
where as described above, Å is the layer spacing, and is the London penetration depth such that with Å. In the case of our experimental conditions the resulting total vortex energy reduction is . Therefore, the degree of the spacial extension of the PV whiskers into the vortex-free region should be extremely small, of the width of the flux-free region, and hence should be hardy observable. Nevertheless, our images clearly show that PV chains extend through the entire vortex-free region, in sharp contrast to the above estimates.
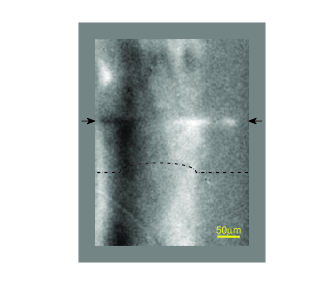
It was recently shown that small local inhomogeneities in could lead to very large variations in the equilibrium local induction, a phenomenon attributed to demagnetization effects.Avraham et al. (2008) In order to see whether demagnetization can explain the phenomenon at hand we studied the GB mechanism in sample A after two shallow grooves were etched on its surface across the width of the sample as described above. We found that the grooves have a surprisingly large effect: a 160 nm deep groove, just of the sample thickness, reduces the GB hysteresis comparable to the suppression by the in-plane field of about 10 Oe, and vortex whiskers are formed along the groove. The current modulated DMO image in Fig. 9 shows that on ascending field the whiskers along the groove (marked by arrows) have a contrast that is comparable to the dome in the pristine region but their extent is about wider than the pristine dome. On the descending branch the vortex dome in the pristine region closes gradually while the whiskers along the groove extend up to the sample edges similar to the behavior of the whiskers along the JV’s.
V discussion
The reduction of the GB by JV stacks has four main manifestations in our data: (i) suppression of the magnetic hysteresis, (ii) reduction of the penetration field with increasing , (iii) the presence of PV chains outside the bulk vortex dome, and (iv) on the descending branch of the magnetization loop—the reduction of the bulk dome width to zero at some finite , with increasing with increasing . A shallow and narrow groove in the absence of , had the same qualitative effects on the GB. Indeed, both the groove and a stack of JVs reduce the energy of the vortices residing on them: A groove reduces the average vortex energy by , where is the groove depth, while a stack of JVs reduces the vortex energy by . Thus in both cases a chain-like structure with enhanced density of vortices is expected to be formed along the groove or the JVs. In the following discussion, we therefore use the term groove in order to describe the related reduction of the geometrical barrier in both experimental situations. Note that in contrast to the fixed groove fabricated by FIB, in the case of JVs both the density of the “grooves” and their effective “depth” increase with (see Eq. (1)). As a result, in the case of JV “grooves” one may expect a stronger suppression of the GB with increasing as observed experimentally.
In the discussion that follows we show that the suppression of the vortex energy along the groove is insufficient to account for the observed phenomena on its own. We then demonstrate that the boundary conditions require the presence of substantial shielding currents that flow along the groove. These currents cause an additional significant increase of the magnetic induction inside the groove enhancing the suppression of the GB in accordance with the experimental results.
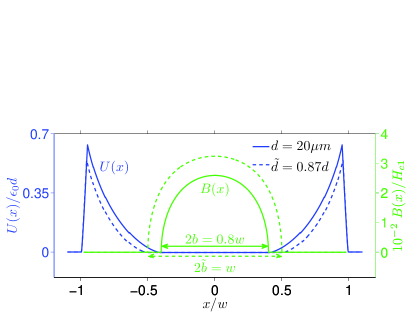
We start by evaluating the expected reduction of the GB due to a groove across the width of the sample. Let us consider a sample of width and thickness () having a groove of depth extending from to . Since the vortex energy in the groove is lower, we expect that the vortex dome along the groove will be wider than in the bulk forming whisker-like protrusions of vortices into the flux free region. If the groove width, denoted by , is large enough, i.e. then it can be described by the GB formulation following for example Ref. Zeldov et al., 1994c. Figure 10 shows for example the resulting vortex potential and field profiles in the bulk and along the groove of depth at under equilibrium conditions, . Here the dome width in the bulk is while the dome in the groove has resulting in whiskers that extend out of the bulk dome by . Experimentally, in contrast, both the FIB etched groove and the effective grooves along the JV stacks have a much stronger effect: the FIB groove in Fig. 9 shows similar extent of the whiskers for groove depth of just , whereas the JV stacks result in whiskers that commonly extend all the way to the sample edges, with effective groove depth of the order of just .
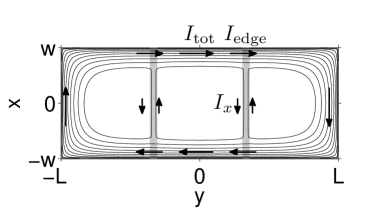
The above calculation, however, does not take into account the current that flows along the groove-bulk interface, see Fig. 11, which may significantly enhance the described effect. This current plays a similar role to that of the edge current in the GB model and may significantly enhance the magnetic induction in the groove. Vortices can penetrate from the groove into the bulk only if the difference in their line energy is canceled by the Lorentz potential due to that part of which flows in a region of width near the groove,
| (2) |
where is the appropriate sheet current. always keeps the induction in the groove higher than in the bulk, thus enhancing the effect of the groove and increasing the extent of the vortex whiskers. In the Meissner state and no current flows along the groove edges. At low fields, when the vortices are present only in the groove, extends over the entire bulk. With increasing field, dome is formed in the bulk, decreasing . When the field is high enough so flows only in the region of width at the interface, the total interface current reaches its minimum value given by Eq. (2). The difference in the inductions at the groove center and bulk which is proportional to , depends on the geometry of the groove. For example, if the whole current flows near the groove, one has for the narrow groove, , and in the opposite limiting case, . Note that the enhancement of the field in the groove is essentially a demagnetization effect due to partial expulsion of the flux from the bulk. It is clear that for very wide grooves the effect is negligible and the result of Fig. 10 holds.
The sheet current and magnetic induction can be calculated numerically for a finite size, two-dimensional film using the method described in Ref. Brandt, 2005. This method can be applied to the problem at hand in the limit of . Here we demonstrate by this calculation that the dome in the groove can be noticeably wider than the dome in the bulk. To carry out the calculation, we rewrite condition (2) using the known solution for the sheet current and magnetic induction in the case when there is a magnetic flux in a narrow slit of the width between two wide infinitely long strips in the Meissner state.Brojeny et al. (2002) This solution can be used only if flows in the region essentially wider than , i.e., if . Then, Eq. (2) can be rewritten as
| (3) |
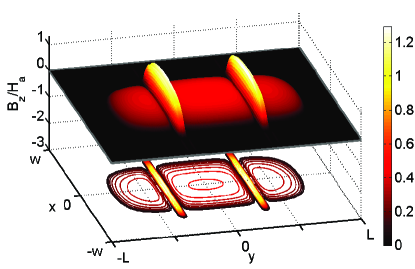
where is a factor which depends on the distribution of the current density in the layer of the thickness near the groove. Strictly speaking, this distribution is essentially three-dimensional and cannot be found from the solution of Ref. Brojeny et al., 2002. We estimate that the factor lies in the interval from to . Since the calculation is done for a strictly 2D film, enters the calculation only through which we take as in the figures shown next. Figures 11 and 12 show the current stream lines and magnetic induction of a 2D superconductor having two grooves of width at . The interface current as well as the flux focusing into the slits is clearly seen. Figure 12 shows that the dome in the grooves is wider than the bulk dome forming whiskers protruding into the flux free region. The induction in the grooves is much higher than in the bulk and interestingly, it is even higher than the applied field. The paramagnetic response of the grooves, , is similar to the situation described in Ref. Avraham et al., 2008, where such a phenomenon was described in terms of demagnetization effect.
Our numerical calculations also provide a qualitative understanding of the behavior on the descending field as follows. When the applied field is decreased, the bulk dome and the whiskers along the grooves expand until the whiskers reach the sample edges. Since the bulk and groove vortices remain in equilibrium, on further decrease of the vortices are drained out from the bulk through the groove. This process results in reduction of the width of the hysteresis loop and in magnetization value that is closer to the equilibrium magnetization on the descending branch. The inductions at both the groove and bulk centers decrease with decreasing , but their difference, remains constant. Thus as is reduced to zero the bulk dome contracts until all its vortices are drained out at a field such that the induction at the groove center equals . In order to estimate , we note that at this field in the bulk and the sample is in the Meissner state everywhere except in the grooves. In the Meissner state the total screening current circulating in a strip is .Larkin and Ovchinnikov (1971); Huebener et al. (1972) Near the grooves this current splits into two paths: flows parallel to the groove and flows across the groove edge (see Fig. 11). Thus, we obtain . We can thus evaluate by noting that the edge current lies in the interval .Zeldov et al. (1994a) This estimate for the range of is in reasonable agreement with the experimental values of seen on the descending branches of in Fig. 3b.
The above description provides a qualitative explanation of the creation of vortex whiskers, the suppression of hysteresis, and the shrinkage of the bulk vortex dome on descending field. Quantitatively, however, the groove depths that are required in order to describe the experimental data are still about an order of magnitude larger than the ones obtained from Eq. (1). Our numerical calculations are applicable only for grooves that are not too narrow , while the JV stacks create effective grooves with . In this case we expect further enhancement of the demagnetization effects that could perhaps resolve the discrepancy. Interestingly, the JV-PV crossing energy was evaluated experimentally to be about seven times larger than the theoretical value by comparing with the vortex line energy in wide grooves.Tamegai et al. (2004b) The origin of this discrepancy could be related to the same observation that the effective grooves due to JV’s are much narrower, thus having a large field enhancement due to demagnetization effects in the thin samples in perpendicular field.
The presented model, however, does not explain why the penetration field decreases significantly with increasing . In the full Meissner state and therefore cannot be affected by it. Since in the GB model , the bare reduction of the thickness along the JV effective grooves should lower in our case by less than , in sharp contrast to more than reduction in in Fig. 3(b). This essential reduction of may be due to a more intriguing mechanism in the vicinity of the edges in which an inhomogeneous penetration of the vortices into the edge region leads to a concentration of the magnetic field in the groove edges. As a result, an enhanced penetration of the vortices along the groove develops that noticeably decreases the observed penetration field.
VI Summary
We used the DMO technique to image the field distribution and the local magnetization of thin BSCCO crystals at elevated temperatures at which the magnetic hysteresis is governed by the geometrical barrier mechanism. In this regime a vortex dome is present in the central part of the sample surrounded by a vortex-free potential barrier region. We found that stacks of Josephson vortices caused by an in-plane magnetic field significantly reduce the GB and allow formation of pancake vortex chains or whiskers in regions that should otherwise be vortex-free. These whiskers extend from the dome up to the sample edges, thus forming easy channels for vortex flow through the potential barrier. As a result the magnetic hysteresis is reduced and the magnetization loops become reversible at elevated in-plane fields. We also found that a FIB etched narrow and shallow groove has a similar effect on the GB.
Our analysis shows that the bare reduction of the vortex energy due to the JV-PV crossing energy along the JV stacks or due to reduced thickness along the etched grooves is one to two orders of magnitude lower than the height of the GB, and therefore cannot account for the observed phenomena. We present a model in which the effect of the grooves is significantly enhanced due to the demagnetization factor in the platelet geometry in perpendicular field. The flux that is partially expelled from the pristine regions is focused into the grooves, thus enhancing the local induction in the grooves and suppressing the barrier. The presented numerical calculations demonstrate qualitatively this demagnetization enhancement, and provide an important insight into the long-standing puzzle of suppression of the macroscopic GB by in-plane field. Our numerical method can only treat grooves that are wide on the scale of sample thickness, which are much wider than in the experimental situation. A proper calculation of narrower grooves is therefore required, and is expected to provide a better quantitative agreement with the data. One important experimental observation, the suppression of the penetration field by the JV stacks, however, remains unexplained within the model. This feature is apparently a result of microscopic inhomogeneities in the sample edge regions introduced by the JV’s that facilitate vortex penetration into the sample. Such inhomogeneities cannot be treated within our current numerical studies and will be the subject of future investigations.
Acknowledgements.
We wish to thank the Electron Microscopy Unit in the Weizmann Institute of Science for providing us access to the FEI Helios Focused Ion Beam system. This research was supported by the German-Israeli Foundation for Scientific Research and Development (GIF) and by the US-Israel Binational Science Foundation (BSF). EZ acknowledges the support of EU-FP7-ERC-AdG.References
- Blatter et al. (1994) G. Blatter, M. V. Feigel’man, V. B. Geshkenbein, A. I. Larkin, and V. M. Vinokur, Rev. Mod. Phys. 66, 1125 (1994).
- Pautrat et al. (2004) A. Pautrat, J. Scola, C. Goupil, C. Simon, C. Villard, B. Domengès, Y. Simon, C. Guilpin, and L. Méchin, Phys. Rev. B 69, 224504 (2004).
- Bean and Livingston (1964) C. P. Bean and J. D. Livingston, Phys. Rev. Lett. 12, 14 (1964).
- Zeldov et al. (1994a) E. Zeldov, A. I. Larkin, V. B. Geshkenbein, M. Konczykowski, D. Majer, B. Khaykovich, V. M. Vinokur, and H. Shtrikman, Phys. Rev. Lett. 73, 1428 (1994a).
- Indenbom et al. (1994) M. Indenbom, H. Kronmüller, T. Li, P. Kes, and A. Menovsky, Physica C 222, 203 (1994).
- Benkraouda and Clem (1996) M. Benkraouda and J. R. Clem, Phys. Rev. B 53, 5716 (1996).
- Brandt (1999a) E. H. Brandt, Phys. Rev. B 60, 11939 (1999a).
- Brandt (1999b) E. H. Brandt, Phys. Rev. B 59, 3369 (1999b).
- Schuster et al. (1994) T. Schuster, M. V. Indenbom, H. Kuhn, E. H. Brandt, and M. Konczykowski, Phys. Rev. Lett. 73, 1424 (1994).
- Clem (2008) J. Clem, J. Supercond Nov Magn 21, 343 (2008).
- Willemin et al. (1998) M. Willemin, A. Schilling, H. Keller, C. Rossel, J. Hofer, U. Welp, W. K. Kwok, R. J. Olsson, and G. W. Crabtree, Phys. Rev. Lett. 81, 4236 (1998).
- Avraham et al. (2001) N. Avraham, B. Khaykovich, Y. Myasoedov, M. Rappaport, H. Shtrikman, D. E. Feldman, T. Tamegai, P. H. Kes, M. Li, M. Konczykowski, K. van der Beek, and E. Zeldov, Nature 411, 451 (2001).
- Beidenkopf et al. (2005) H. Beidenkopf, N. Avraham, Y. Myasoedov, H. Shtrikman, E. Zeldov, B. Rosenstein, E. H. Brandt, and T. Tamegai, Phys. Rev. Lett. 95, 257004 (2005).
- Tamegai et al. (2004a) T. Tamegai, M. Matsui, M. Yasugaki, N. Kamada, Y. Tokunaga, and M. Tokunaga, Supercond Sci Tech 17, S88 (2004a).
- Bending et al. (2004) S. J. Bending, A. N. Grigorenko, I. A. Crisan, D. Cole, A. E. Koshelev, J. R. Clem, T. Tamegai, and S. Ooi, Physica C 412-414, 372 (2004).
- Kasahara et al. (2005) S. Kasahara, Y. Tokunaga, N. Kameda, M. Tokunaga, and T. Tamegai, Phys. Rev. B 71, 224505 (2005).
- Konczykowski et al. (2006) M. Konczykowski, C. J. van der Beek, A. E. Koshelev, V. Mosser, M. Dodgson, and P. H. Kes, Phys. Rev. Lett. 97, 237005 (2006).
- Gutman et al. (2010) I. Gutman, S. Goldberg, Y. Segev, Y. Myasoedov, E. Zeldov, and T. Tamegai, Physica C 470, S239 (2010).
- Majer et al. (1995) D. Majer, E. Zeldov, and M. Konczykowski, Phys. Rev. Lett. 75, 1166 (1995).
- Van der Beek et al. (1996) C. J. Van der Beek, M. V. Indenbom, G. D’Anna, and W. Benoit, Physica C 258, 105 (1996).
- Fuchs et al. (1998a) D. T. Fuchs, E. Zeldov, M. Rappaport, T. Tamegai, S. Ooi, and H. Shtrikman, Nature 391, 373 (1998a).
- Fuchs et al. (1998b) D. T. Fuchs, R. A. Doyle, E. Zeldov, S. F. W. R. Rycroft, T. Tamegai, S. Ooi, M. L. Rappaport, and Y. Myasoedov, Phys. Rev. Lett. 81, 3944 (1998b).
- Beidenkopf et al. (2009) H. Beidenkopf, Y. Myasoedov, E. Zeldov, E. H. Brandt, G. P. Mikitik, T. Tamegai, T. Sasagawa, and C. J. van der Beek, Phys. Rev. B 80, 224526 (2009).
- Böhmer et al. (2010) A. E. Böhmer, M. Konczykowski, and C. Jacominus Van Der Beek, ArXiv e-prints (2010), arXiv:1004.5309 .
- Morozov et al. (1997) N. Morozov, E. Zeldov, M. Konczykowski, and R. A. Doyle, Physica C 291, 113 (1997).
- Brandt and Mikitik (2002) E. H. Brandt and G. P. Mikitik, Phys. Rev. Lett. 89, 027002 (2002).
- Mikitik and Brandt (2003) G. P. Mikitik and E. H. Brandt, Phys. Rev. B 67, 104511 (2003).
- Mikitik and Brandt (2004) G. P. Mikitik and E. H. Brandt, Phys. Rev. B 69, 134521 (2004).
- Burlachkov et al. (1994) L. Burlachkov, V. B. Geshkenbein, A. E. Koshelev, A. I. Larkin, and V. M. Vinokur, Phys. Rev. B 50, 16770 (1994).
- Clem (1991) J. R. Clem, Phys. Rev. B 43, 7837 (1991).
- Bulaevskii et al. (1992) L. N. Bulaevskii, M. Ledvij, and V. G. Kogan, Phys. Rev. B 46, 366 (1992).
- Koshelev (1999) A. E. Koshelev, Phys. Rev. Lett. 83, 187 (1999).
- Grigorenko et al. (2001) A. Grigorenko, S. Bending, T. Tamegai, S. Ooi, and M. Henini, Nature 414, 728 (2001).
- Bending and Dodgson (2005) S. J. Bending and M. J. W. Dodgson, J Phys Condens Mat 17, R955 (2005).
- Tokunaga et al. (2003) M. Tokunaga, T. Tamegai, Y. Fasano, and F. de la Cruz, Phys. Rev. B 67, 134501 (2003).
- Bolle et al. (1991) C. A. Bolle, P. L. Gammel, D. G. Grier, C. A. Murray, D. J. Bishop, D. B. Mitzi, and A. Kapitulnik, Phys. Rev. Lett. 66, 112 (1991).
- Vlasko-Vlasov et al. (2002) V. K. Vlasko-Vlasov, A. Koshelev, U. Welp, G. W. Crabtree, and K. Kadowaki, Phys. Rev. B 66, 014523 (2002).
- Tamegai et al. (2004b) T. Tamegai, M. Matsui, and M. Tokunaga, Physica C 412-414, 391 (2004b).
- Zeldov et al. (1994b) E. Zeldov, J. R. Clem, M. McElfresh, and M. Darwin, Phys. Rev. B 49, 9802 (1994b).
- Soibel et al. (2000) A. Soibel, E. Zeldov, M. Rappaport, Y. Myasoedov, T. Tamegai, S. Ooi, M. Konczykowski, and V. B. Geshkenbein, Nature 406, 282 (2000).
- Morozov et al. (1996) N. Morozov, E. Zeldov, D. Majer, and B. Khaykovich, Phys. Rev. Lett. 76, 138 (1996).
- Banerjee et al. (2004) S. S. Banerjee, S. Goldberg, A. Soibel, Y. Myasoedov, M. Rappaport, E. Zeldov, F. de la Cruz, C. J. van der Beek, M. Konczykowski, T. Tamegai, and V. M. Vinokur, Phys. Rev. Lett. 93, 097002 (2004).
- Zeldov et al. (1994c) E. Zeldov, A. I. Larkin, M. Konczykowski, B. Khaykovich, D. Majer, V. B. Geshkenbein, and V. M. Vinokur, Physica C 235-240, 2761 (1994c).
- Note (1) The slight decrease in the value of on decreasing field can be readily attributed to small remnant in-plane field considering the dramatic effect of non-zero , and to the finite field modulation used in DMO imaging.
- Grigorieva et al. (1995) I. V. Grigorieva, J. W. Steeds, G. Balakrishnan, and D. M. Paul, Phys. Rev. B 51, 3765 (1995).
- Grigorenko et al. (2002) A. N. Grigorenko, S. J. Bending, A. E. Koshelev, J. R. Clem, T. Tamegai, and S. Ooi, Phys. Rev. Lett. 89, 217003 (2002).
- (47) http://www.weizmann.ac.il/condmat/superc/.
- Avraham et al. (2008) N. Avraham, E. H. Brandt, G. P. Mikitik, Y. Myasoedov, M. Rappaport, E. Zeldov, C. J. van der Beek, M. Konczykowski, and T. Tamegai, Phys. Rev. B 77, 214525 (2008).
- Brandt (2005) E. H. Brandt, Phys. Rev. B 72, 024529 (2005).
- Brojeny et al. (2002) A. A. B. Brojeny, Y. Mawatari, M. Bekraouda, and J. R. Clem, Supercond Sci Tech 15, 1454 (2002).
- Larkin and Ovchinnikov (1971) A. Larkin and Y. Ovchinnikov, Zhurnal Eksperimental’noi i Teoreticheskoi Fiziki 61, 1221 (1971), [Sov. Phys.-JETP 34, 651 (1972)].
- Huebener et al. (1972) R. P. Huebener, R. T. Kampwirth, and J. R. Clem, J Low Temp Phys 6, 275 (1972), 10.1007/BF00628313.