Gravitationally lensed QSOs in the ISSIS/WSO-UV era
Abstract
Gravitationally lensed QSOs (GLQs) at 1 2 play a key role in understanding the cosmic evolution of the innermost parts of active galaxies (black holes, accretion disks, coronas and internal jets), as well as the structure of galaxies at intermediate redshifts. With respect to studies of normal QSOs, GLQ programmes have several advantages. For example, a monitoring of GLQs may lead to unambiguous detections of intrinsic and extrinsic variations. Both kinds of variations can be used to discuss central engines in distant QSOs, and mass distributions and compositions of lensing galaxies. In this context, UV data are of particular interest, since they correspond to emissions from the immediate surroundings of the supermassive black hole. We describe some observation strategies to analyse optically bright GLQs at z 1.5, using ISSIS (CfS) on board World Space Observatory-Ultraviolet.
Keywords Gravitational lensing; Quasars: black holes and accretion; Galaxies: structure
1 Gravitationally lensed QSOs in the UV: central engines
Clusters, groups and individual galaxies are so massive and compact that light rays from background sources are gravitationally deflected by them. In the strong lensing regime, the involved gravitational fields bend light to form several images of the same background object (Blandford & Narayan, 1992; Schneider et al., 1992; Wambsganss, 1998; Schneider et al., 2006). The first gravitationally lensed QSO (GLQ) was discovered by Walsh et al. (1979) 30 years ago, and there are currently more than 100 known GLQs. Most of them are active galactic nuclei (AGN) at 1 (Kochanek et al., 2010; Inada & Oguri, 2010).
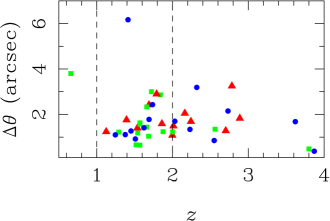
We initially consider the population of optically bright GLQs. From the CASTLES111http://www.cfa.harvard.edu/castles/ and SQLS222http://www-utap.phys.s.u-tokyo.ac.jp/~sdss/sqls/ databases, we select 46 GLQs showing at least two images with 20 mag. This GLQ sample is depicted in Fig. 1 (only two sample members with angular size are not included in the plot, where represents the maximum separation of any pair of images, twice the average distance of images from the lens center or something like that). We also classify the population in terms of the -band flux of the brightest image of each GLQ (): 17.5 mag (blue circles), 17.5 18.5 mag (green squares), and 18.5 mag (red triangles). About 50% of the GLQs with 17.5 mag have their redshifts in the interval 1 2 (see the region between both vertical dashed lines in Fig. 1), and we focus on this densely populated cosmic shell containing 61% (28 out of 46) of the whole CASTLES + SQLS sample, i.e., the population of bright GLQs at 1.5.
A lensing galaxy (or group/cluster) acts as a natural telescope, so it produces a GLQ with magnified images (with respect to the single image of a non-lensed QSO at the same and having the same intrinsic luminosity). However, the dust in the galaxy may significantly demagnify some GLQ images at certain wavelengths Falco et al. (1999). Moreover, the presence of high column densities of neutral hydrogen (in intervening objects at 1.5) could greatly hinder or make impossible the detection of photons at 2280 Å, i.e., 912 Å (= Lyman limit) in the GLQ rest frame ( 1.5). At the redshift of interest, we remark that optical observations in the Bessell and SDSS bands correspond to far/middle UV (FUV/MUV) emission ( 17002600 Å). Hence, even in the worst case (total absorption below the Lyman limit), UV observations at 2300-4000 Å (EUV/FUV emission: 920-1600 Å) are possible. These have an extraordinary relevance in the study of the innermost accretion flow in a distant QSO, and thus, to reveal its hottest and most compact sources around the supermassive black hole (SMBH; Peterson, 2009).
2 Time domain studies of optically bright GLQs at 1.5
2.1 Intrinsic variability
A monitoring campaign of a normal (non-lensed) QSO at 1.5 produces light curves in the UV/optical continuum whose variations are difficult to interpret: intrinsic variability or fluctuations caused by the intervening medium? However, the presence of a gravitational deflector at intermediate redshift may result in several (usually two or four) images of the same QSO. As the ray paths are different for different images, the corresponding magnifications and traveltimes do not agree with each other. Thus, in the absence of significant extrinsic variations (see the opposite case below), each intrinsic flare is observed in two or more images with different arrival times. This allows observers to fairly interpret the nature of the variability, and even more, the light curves of the images can be combined to make one better-sampled intrinsic record (e.g. Kawaguchi et al., 1998; Goicoechea et al., 2008a).
A structure function analysis is a powerful technique to quantify typical luminosity variabilities at different rest frame lags and to check for timescales of intrinsic flares (e.g. Cid Fernandes et al., 2000; Collier & Peterson, 2001). For two optically bright GLQs at = 1.4 (SBS 0909+532 and Q0957+561), we recently reported the possible existence of time-symmetric flares (with symmetric rise and decay) at 1900-2600 Å and lasting 100 d (Goicoechea et al., 2010a). As both GLQs have similar SMBH mass (Peng et al., 2006), the symmetry and timescale could be related to this physical quantity. There is also evidence that 170-d asymmetric flares are generated in the nuclear region of Q0957+561, but these events seem to have an intermittent character (Goicoechea et al., 2008b). Future studies involving larger samples and longer observation periods will confirm/reject the possible correlation between symmetry/timescale and SMBH mass, as well as the generation of asymmetric flares in an intermittent way in some GLQs. The radio-loud GLQ Q0957+561 also has an achromatic structure function at 1900-2600 Å, suggesting the existence of an illuminated accretion disk (reprocessing scenario; Collin-Souffrin, 1991; Krolik et al., 1991): high-energy (X-ray/EUV) flares from a source above the SMBH are reprocessed by disk rings into lower energy events.
For a given AGN, time delays between variations at different UV/optical continuum wavelengths constrain the SMBH accretion physics. The standard reprocessing scenario consists of a very compact X-ray source located at a height of a few Schwarzschild radii ( a few ) above the SMBH, which illuminates a standard geometrically-thin and optically-thick accretion disk (Shakura & Sunyaev, 1973). This corona-disk coupling scenario predicts light travel time delays between an X-ray central flare and its replicas (reprocessed versions) in different rings of the accretion disk. The smallest radii correspond to the hottest regions and shortest wavelength emissions, so light travel time delays ( is an arbitrary radius and is the speed of light) can be rewritten as wavelength-dependent lags (e.g. Collier et al., 1999; Sergeev et al., 2005; Cackett et al., 2007). Light curves of many local AGN show UV/optical inter-wavelength lags supporting the standard reprocessing scenario (e.g. Sergeev et al., 2005). However, there are also indications that UV/optical fluctuations in several local AGN cannot be produced from standard reprocessing of X-ray flares associated with observed X-ray variations.
For example, Arévalo et al. (2008) simulated thermally-reprocessed -band light curves of the local QSO MR 2251-178, using the technique by Kazanas & Nayakshin (2001) and the observed X-ray record as input. They showed that even observed short-timescale (lasting tens of days) B-band fluctuations do not agree with standard reprocessing simulations. If we concentrate on the two consecutive fluctuations in the 3950-4100 (MJD-50000) period (see Fig. 9 in Arévalo et al., 2008), only the green line seems to account for the B-band data. This line comes from a non-standard reprocessing simulation with = 50 , i.e., the irradiating source does not correspond to a X-ray corona just above the SMBH. Although the X-ray source might be really located at the base of a jet, we note that at least one best-fit parameter, the observer latitude, is physically unplausible (an edge-on disk generates zero flux at the observer and it is inconsistent with a type 1 AGN). Arévalo et al. (2009) also showed that the reprocessor of rapid X-ray flares in the Seyfert nucleus NGC 3783 could correspond to the broad emission-line region (instead the accretion disk). In brief, short-timescale UV/optical variations are very likely related to reprocessing of high-energy events, but there is no standard scenario working in all local AGN. The main high-energy source may not be the X-ray corona (X rays from the base of a jet, EUV emission from a non-flat innermost region of the accretion flow, etc) and/or the reprocessor may be different than a standard accretion disk (non-standard disk, broad emission-line region, dust torus, etc).
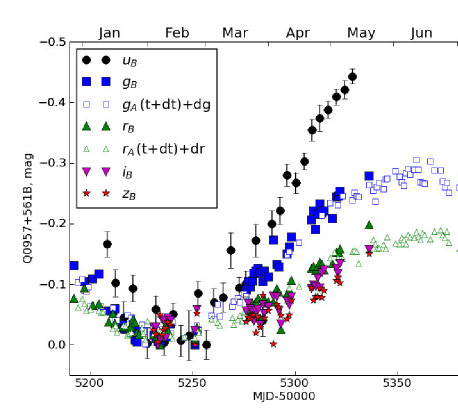
Time lags between variations at different wavelengths has been well studied only for local AGN. However, very recently we have detected a prominent optical variation in the image A of the GLQ Q0957+561, and searched for the imprints of a hypothetical intrinsic flare in the light curves of the B image, but 14 months later (the well-known time delay between both images, e.g. Shalyapin et al., 2008). Fortunately, we have observed the GLQ ( 6) with several facilities at several wavelengths: X-rays (Chandra), NUV (Swift/UVOT) and optical/NIR (Liverpool Robotic Telescope). In Fig. 2, we show preliminary NUV/optical/NIR light curves of Q0957+561B (until mid-May 2010) from our monitoring campaign with the UVOT on board Swift (black circles) and the Liverpool Robotic Telescope (rest of filled symbols). Open symbols trace the time evolution of Q0957+561A (14 months before) and demonstrate the intrinsic origin of the variability (e.g. the filled blue squares correspond to Q0957+561B data in the SDSS band, and these are consistent with the open blue squares describing the behaviour of Q0957+561A in the same optical filter). Our NUV/optical/NIR follow-up covers the rest-frame spectral region 1440-3700 Å, so we have lost EUV emissions at 920-1200 Å, which probably come from the innermost accretion flow. In any case, the simple use of the filter in the UVOT filter wheel allows us to properly analyse the FUV emission at 1440 (8.6 eV). This is also expected to be created in internal rings of the accretion disk around the SMBH. At present, we are comparing the flux fluctuations of Q0957+561B from X-rays to NIR waves.
Time-delayed responses of emission lines to continuum variations can be used to infer sizes of broad emission-line regions, while FWHMs of emission lines are directly related to the kinematics of line-emitting clouds. Both the geometry and kinematics of broad emission-line regions are useful tools to estimate masses of central SMBHs (e.g. Peterson, 2009). Unfortunately, there are no spectral monitoring campaigns of GLQs (with the exception of COSMOGRAIL’s recent efforts to follow-up the spectral variability of Q2237+0305 - see below, and an ongoing programme to take spectra of the two images of Q0957+561 on a regular basis), which might be much more efficients than programmes with non-lensed QSOs. This is because effective sampling periods are twice (double QSO) or even four times (quadruple QSO).
Apart from unambiguous detections of intrinsic fluctuations and important improvements in effective samplings, it is clear that studies of GLQs have much more potential than those from non-lensed QSOs. Thus, time delays between lensed images are related to lensing mass distributions, and provide extremely valuable information on dark matter halos around galaxies at intermediate redshifts (e.g. Schneider et al., 2006). From very distant GLQs, one can also infer unknown redshifts (not only dark halos) of lensing objects. For example, the time delays in the quadruple QSO H1413+117 (Cloverleaf) at = 2.56 have been used to refine the lens model and to estimate the previously unknown lens redshift (Goicoechea & Shalyapin, 2010b).
2.2 Extrinsic variability
Apart from the constant macrolens magnification (due to the lensing structure as a whole) of an image of a GLQ, an additional variable microlens magnification may be generated by compact objects (moving stars or MACHOs) in the main lensing galaxy (gravitational microlensing; e.g. Schneider et al., 2006). In principle, moving clouds of dust may also produce a variable transmission (e.g. Goicoechea et al., 2005), and thus, some extrinsic variability. However, most studies focused on the microlensing interpretation of extrinsic signals in GLQs. When the extrinsic variability can be unambiguously separated from the intrinsic one (e.g. Paraficz et al., 2006), resulting extrinsic fluctuations may be related to the nature of the lensed and microlensed source, as well as the composition of the main lensing galaxy (e.g. Shalyapin et al., 2002; Kochanek, 2004; Paraficz et al., 2006).
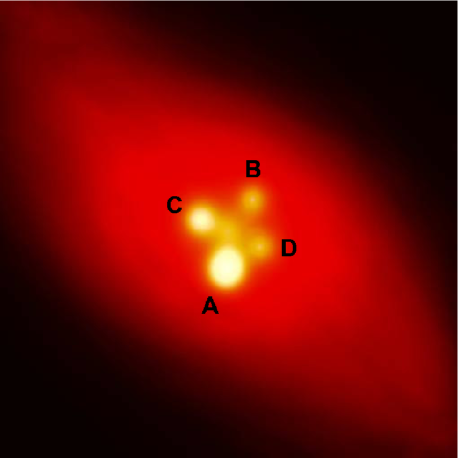
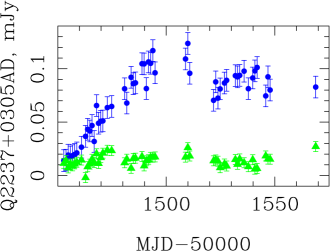
Microlensing (extrinsic) variability was initially discovered in the GLQ Q2237+0305 (Einstein Cross; Irwin et al., 1989), and we mainly comment results on this emblematic QSO. The gravitational lens system is formed by a distant QSO at = 1.695 and a local lens galaxy (face-on spiral at =0.039) that quadruples the images of the QSO (Huchra et al., 1985). This compact lens system with 2 appears in Fig. 3. Some optical continuum monitoring campaigns have led to very accurate and reasonably well-sampled light curves of the four images of Q2237+0305, e.g. the OGLE (Woźniak et al., 2000), GLITP (Alcalde et al., 2002) and COSMOGRAIL (Eigenbrod et al., 2008) records. The OGLE -band records cover a time frame of about 10 years, while the GLITP -band curves only last a few months but with a daily sampling, bad weather or technical problems aside (see also the Maidanak light curves in the band; Vakulik et al., 2006). The COSMOGRAIL monitoring is the only spectroscopic follow-up ( 1450 Å in the rest frame of the QSO) of a GLQ to date. In Fig. 4, the GLITP -band fluxes (mJy) of Q2237+0305A and Q2237+0305D are plotted together as blue circles and green triangles, respectively. The time delay between the images A and D is less than 2 days (Vakulik et al., 2006), so the time-axis in Fig. 4 practically traces the emission time. There is a significant fluctuation in A, which is not detected in D at similar emission times. This extrinsic fluctuation allowed us to discuss the -band source intensity profile and size, the mass of the SMBH, the mass accretion rate, the lens transverse velocity, and the typical mass of stars in the bulge of the local spiral galaxy (Shalyapin et al., 2002; Goicoechea et al., 2003; Gil-Merino et al., 2006).
The timescale of microlensing variability depends on the redshift of (distance to) the main lensing galaxy: more distant lenses produce longer variations. Therefore, the Einstein Cross is of particular interest because of the observed short-timescale microlensing fluctuations (e.g. Fig. 4). For non-local lenses, one observes long-term microlensing effects that induce small (optical) flux variations on timescales of several months (e.g. Gaynullina et al., 2005; Fohlmeister et al., 2007; Shalyapin et al., 2009). QSO emission regions have different sizes in different wavelengths, and microlensing effects are stronger for more compact sources. For example, Pooley et al. (2007) used observed X-ray and optical flux ratios between images of ten quadruple GLQs to show that X-ray sources (hot coronas above SMBHs?; see above) are much more strongly microlensed (more compact) than sources associated with optical observations (accretion disks around SMBHs are prime candidates). Thus, the UV extrinsic variability should be stronger than the extrinsic variability at optical wavelengths, and it should probe innermost regions of accretion disks.
3 GLQ programmes using ISSIS (CfS) on board World Space Observatory-Ultraviolet (WSO-UV)
The aim of the WSO-UV mission is to study the Universe in the UV spectral range (Shustov et al., 2009), but also including complementary optical/NIR capabilities (4000-10000 Å). This 1.70-m space telescope will be launched in 2014, and it will be the replacement for the Hubble Space Telescope (HST) in many ways. While the 4000-10000 Å interval is not a problem for ground-based instruments, the 1000-4000 Å range is problematic or beyond the sensitivity of ground-based telescopes. Therefore, WSO-UV has its main potential in the UV wavelength interval. The mission is an international collaboration, with Russia333http://wso.inasan.ru/, Spain444http://www.wso-uv.es/index.php/home.html and Germany555http://www.uni-tuebingen.de/index.php?id=8711 playing the leading role.
WSO-UV is equipped with multipurpose instrumentation to carry out spectroscopy and imaging. In particular, we concentrate on the Channel for Surveys (CfS) of the Imaging and Slitless Spectrograph Instrument for Surveys (ISSIS). The ISSIS CCD (CfS) is characterized by
-
1.
small pixels (0.05),
-
2.
narrow distributions of brightness for point-like sources (FWHM = 0.1), and
-
3.
a field-of-view (FOV) = .
Hence, the CfS is ideally suited for GLQ programmes, which require a high angular resolution (see Fig. 1) and a reasonably large FOV (to find reference stars). Its UV spectral coverage (1100-4000 Å) corresponds to 440-1600 Å in the rest-frame of bright GLQs at 1.5, and thus, the CfS can be used to probe the EUV-FUV emission of GLQs. We propose to follow-up the variability of several targets over observation periods of about six months and using a dense sampling (e.g. two or three times per week). To optimise the monitoring of each GLQ, starting times (of observation periods) would be decided through an optical alert system (just after detections of prominent optical gradients). As we remark in Sect. 2, this time-domain programme has high potential for different cosmological studies. Moreover, very preliminary simulations (using the ISSIS Exposure Time Calculator, Alpha 2 version) suggest that it is not too time consuming. In Table 1, we present some exposure times (broad-band filters) that are needed to obtain a signal-to-noise ratio (SNR) of 100 for a target with = 18 mag. Taking these (preliminary!) results into account, a whole campaign for a typical GLQ might last 645 s/d 50 d 30 ks (science time).
| Filter | Emission | Time (s) |
|---|---|---|
| F170W | EUV | 430 |
| F255W | EUV | 190 |
| F336W | FUV | 25 |
| Filter | Time/=17 (ks) | Time/=20 (ks) |
|---|---|---|
| F170W | 0.17 | 2.63 |
| F255W | 0.08 | 1.19 |
| F280N | 0.40 | 6.14 |
We also propose a second programme: EUV database of GLQs. Its main scientific goals are:
-
•
To study nuclear and circumnuclear EUV emissions ( 1200 Å within a 0.3 radius) of a slected sample of GLQs (e.g. Hutchings, 2003).
-
•
To compare with other observations (e.g. VLBI radio jets), and to contribute to a database covering the whole electromagnetic spectrum.
-
•
To reconstruct the EUV morphology of central regions in active galaxies, and to constraint gravitational lens scenarios.
Table 2 shows exposure times required to obtain SNR = 100 for targets with 17 20 mag. The faintest targets ( = 20 mag) may only be reasonably well imaged in a narrow filter from relatively long exposures (exceeding 6 ks). See the GLENDAMA web site at http://grupos.unican.es/glendama/index.htm for updates on our GLQ project with WSO-UV.
Acknowledgements LJG is grateful to the organizers (LOC and SOC) of the international conference ”Ultraviolet Universe 2010” held in St. Petersburg (Russia) between May 31 and June 3, 2010, who prepared a meeting showing UV facilities and studies, and including a long list of complementary/social activities (the excursion along the Neva and Moika rivers was really great!). I also thank all members of the Science Working Group (WSO-UV) in Spain for very interesting discussions. We use information taken from the CfA-Arizona Space Telescope LEns Survey (CASTLES) and SDSS Quasar Lens Search (SQLS) web sites, and we are grateful to both teams for doing that public databases. This research has been financially supported by the Spanish Department of Education and Science grant AYA2007-67342-C03-02 and University of Cantabria funds.
References
- Alcalde et al. (2002) Alcalde, D., Mediavilla, E., Moreau, O., et al. 2002, Astrophys. J., 572, 729
- Arévalo et al. (2008) Arévalo, P., Uttley, P., Kaspi, S., Breedt, E., Lira, P., & McHardy, I. M. 2008, Mon. Not. R. Astron. Soc., 389, 1479
- Arévalo et al. (2009) Arévalo, P., Uttley, P., Lira, P., Breedt, E., McHardy, I. M., & Churazov, E. 2009, Mon. Not. R. Astron. Soc., 397, 2004
- Blandford & Narayan (1992) Blandford, R. D., & Narayan, R. 1992, Annu. Rev. Astron. Astrophys., 30, 311 (see also http://nedwww.ipac.caltech.edu/level5/Blandford/Blandford˙contents.html)
- Cackett et al. (2007) Cackett, E. M., Horne, K., & Winkler, H. 2007, Mon. Not. R. Astron. Soc., 380, 669
- Cid Fernandes et al. (2000) Cid Fernandes, R., Sodré, Jr. L., & Vieira da Silva, Jr. L. 2000, Astrophys. J., 544, 123
- Collier et al. (1999) Collier, S., Horne, K., Wanders, I., & Peterson, B. M. 1999, Mon. Not. R. Astron. Soc., 302, L24
- Collier & Peterson (2001) Collier, S., & Peterson, B. M. 2001, Astrophys. J., 555, 775
- Collin-Souffrin (1991) Collin-Souffrin, S. 1991, Astron. Astrophys., 249, 344
- Eigenbrod et al. (2008) Eigenbrod, A., Courbin, F., Sluse, D., Meylan, G., & Agol, E. 2008, Astron. Astrophys., 480, 647
- Falco et al. (1999) Falco, E. E., et al. 1999, Astrophys. J., 523, 617
- Fohlmeister et al. (2007) Fohlmeister, J., et al. 2007, Astrophys. J., 662, 62
- Gaynullina et al. (2005) Gaynullina, E. R., et al. 2005, Astron. Astrophys., 440, 53
- Gil-Merino et al. (2006) Gil-Merino, R., González-Cadelo, J., Goicoechea, L. J., Shalyapin, V. N., & Lewis, G. F. 2006, Mon. Not. R. Astron. Soc., 371, 1478
- Goicoechea et al. (2003) Goicoechea, L. J., Alcalde, D., Mediavilla, E., & Muñoz, J.A. 2003, Astron. Astrophys., 397, 517
- Goicoechea et al. (2005) Goicoechea, L. J., et al. 2005, Astrophys. J., 619, 19
- Goicoechea & Shalyapin (2010b) Goicoechea, L. J., & Shalyapin, V. N. 2010b, Astrophys. J., 708, 995
- Goicoechea et al. (2008b) Goicoechea, L. J., Shalyapin, V. N., Gil-Merino, R., & Ullán, A. 2008b, Astron. Astrophys., 492, 411
- Goicoechea et al. (2008a) Goicoechea, L. J., et al. 2008a, New Astron., 13, 182
- Goicoechea et al. (2010a) Goicoechea, L. J., Shalyapin, V. N., & Ullán, A. 2010a, Advances in Astronomy, 2010, ID 347935 (Open access at http://www.hindawi.com/journals/aa/2010/347935.html)
- Huchra et al. (1985) Huchra, J., et al. 1985, Astron. J., 90, 691
- Hutchings (2003) Hutchings, J. B. 2003, Astron. J., 126, 24
- Inada & Oguri (2010) Inada, N., & Oguri, M. 2010, SDSS Quasar Lens Search (SQLS) database (http://www-utap.phys.s.u-tokyo.ac.jp/~sdss/sqls/lens.html)
- Irwin et al. (1989) Irwin, M. J., Webster, R. L., Hewett, P. C., et al. 1989, Astron. J., 98, 1989
- Kawaguchi et al. (1998) Kawaguchi, T., Mineshige, S., Umemura, M., & Turner, E. L. 1998, Astrophys. J., 504, 671
- Kazanas & Nayakshin (2001) Kazanas, D., & Nayakshin, S. 2001, Astrophys. J., 550, 655
- Kochanek (2004) Kochanek, C.S. 2004, Astrophys. J., 605, 58
- Kochanek et al. (2010) Kochanek, C.S., et al. 2010, CfA-Arizona Space Telescope LEns Survey (CASTLES) database (http://www.cfa.harvard.edu/castles/)
- Krolik et al. (1991) Krolik, J. H., et al. 1991, Astrophys. J., 371, 541
- Paraficz et al. (2006) Paraficz, D., Hjorth, J., Burud, I., Jakobsson, P., & Elíasdóttir, Á. 2006, Astron. Astrophys., 455, L1
- Peng et al. (2006) Peng, C. Y., et al. 2006, Astrophys. J., 649, 616
- Peterson (2009) Peterson, B. M. 2009, Astrophys. Space Sci., 320, 69
- Pooley et al. (2007) Pooley, D., Blackburne, J. A., Rappaport, S., & Schechter, P. L. 2007, Astrophys. J., 661, 19
- Schneider et al. (1992) Schneider, P., Ehlers, J., & Falco, E. E. 1992, Gravitational Lensing (Berlin: Springer-Verlag)
- Schneider et al. (2006) Schneider, P., Kochanek, C. S., & Wambsganss, J. 2006, Gravitational Lensing: Strong, Weak & Micro, Proceedings of the 33rd Saas-Fee Advanced Course, ed. G. Meylan, P. Jetzer, & P. North (Berlin: Springer-Verlag)
- Sergeev et al. (2005) Sergeev, S. G., Doroshenko, V. T., Golubinskiy, Y. V., Merkulova, N. I., & Sergeeva, E. A. 2005, Astrophys. J., 622, 129
- Shakura & Sunyaev (1973) Shakura, N. I., & Sunyaev, R. A. 1973, Astron. Astrophys., 24, 337
- Shalyapin et al. (2002) Shalyapin, V. N., et al. 2002, Astrophys. J., 579, 127
- Shalyapin et al. (2009) Shalyapin, V. N., et al. 2009, Mon. Not. R. Astron. Soc., 397, 1982
- Shalyapin et al. (2008) Shalyapin, V. N., Goicoechea, L. J., Koptelova, E., Ullán, A., & Gil-Merino, R. 2008, Astron. Astrophys., 492, 401
- Shustov et al. (2009) Shustov, B., Sachkov, M., Gomez de Castro, A. I., et al. 2009, Astrophys. Space Sci., 320, 187
- Vakulik et al. (2006) Vakulik, V., et al. 2006, Astron. Astrophys., 447, 905
- Walsh et al. (1979) Walsh, D., Carswell, R. F., & Weymann, R. J. 1979, Nature, 279, 381
- Wambsganss (1998) Wambsganss, J. 1998, Living Reviews in Relativity, 1, Irr-1998-12 (Open access at http://www.emis.de/journals/LRG/Articles/lrr-1998-12/)
- Woźniak et al. (2000) Woźniak, P. R., et al. 2000, Astrophys. J., 529, 88