The emission line near 1319 Å in solar and stellar spectra
Abstract
An emission line at Å is one of the strongest unidentified lines in the ultraviolet spectra of cool dwarf stars. In most lists of solar and stellar lines it is identified as a transition in N i, although its intensity would then be anomalous and the wavelength does not precisely fit that expected for N i. The line is also observed in giant stars but becomes very weak in supergiants, relative to photoexcited lines of neutral atoms. The measured wavelength of the line in stellar spectra is 1318.94 Å. Observations of giant stars provide further information that shows that this line is not due to N i. It is proposed that the line is due to a decay from the 3p3(2D3d 1D level of S i, above the first ionization limit. The previous tentative assignment of this upper level to a S i line at Å then needs to be revised. The 1309.3-Å line is identified here for the first time in an astrophysical source. The 3d 1D level could, in principle, be populated by collisions from nearby autoionizing levels that are shown to have large number densities, through population by low-temperature dielectronic capture. Spin-orbit interaction with the autoionizing 3d 3D level might also lead to dielectronic capture into the 3d 1D level. A line at 1309.87 Å observed in cool giant stars is identified as a transition in P ii, pumped by the O i resonance lines.
keywords:
stars: chromospheres – stars: late-type – atoms: S i – atoms: N i1 Introduction
Some years ago, attention was drawn to the unsatisfactory identification of a line near 1319 Å with the close N i blend at 1319.001 Å, which arises from the 2p3 2P – 2p23d 2P1/2 transitions (Jordan & Judge 1984; Jordan 1988). It was hoped that further laboratory or theoretical studies of neutral atoms would shed light on this problem. There are two difficulties with the identification with N i; the other closely blended members of the multiplet (the 2P – 2P3/2 transitions at 1319.675 Å) are very much weaker than expected, and the observed wavelength does not precisely match that of the N i transition at 1319.001 Å. According to the oscillator strengths given by Kurucz & Peytremann (1975), the blend at 1319.675 Å should be a factor of 1.6 stronger than that at 1319.000 Å; in L-S coupling, this ratio would be 2.0. The observed ratio in the Sun is (see Section 2.2).
Burton & Ridgeley (1970) first noted the presence of an unidentified line at 1318.95 Å and suggested that it was probably due to a neutral atom, owing to its behaviour at the solar limb. Chipman & Bruner (1975) measured a wavelength of 1318.92 Å, using their high resolution stigmatic spectra. Thus there were early indications that the line near 1319 Å is not due to N i.
It is timely to revisit this problem, since the line near 1319 Å is still being identified with the N i transition, with the danger that it could be adopted as a secondary wavelength standard. For example, the line appears as N i in the SUMER (Solar Ultraviolet Measurements of Emitted Radiation) spectral atlas (Curdt et al. 2001) and in high resolution stellar spectra obtained with the Space Telescope Imaging Spectrograph (STIS) by Ayres, Hodges-Kluck & Brown (2007). In dwarf stars, the line at Å is the strongest in the region between 1240 to 1400 Å for which there has not been a satisfactory identification and it deserves further discussion.
Although the early observations used were made with the International Ultraviolet Explorer (IUE), the higher sensitivity and spectral resolution of the Goddard High Resolution Spectrograph (GHRS) and the STIS on the Hubble Space Telescope (HST) have led to greatly improved stellar spectra. Thus it is now possible to study the line at 1319 Å in other main-sequence stars and in several giant stars, in the context of other lines observed.
Similarly, the SUMER instrument on SOHO (Solar and Heliospheric Observatory) has provided high spectral and spatial resolution observations of the solar far-ultraviolet (fuv) and uv spectrum between 465 and 1610 Å, with an improved intensity calibration. The early photographic spectra obtained with the Naval Research Laboratory’s (NRL) High Resolution Spectrograph and Telescope (HRST) provide limb-to-disc stigmatic observations that are still valuable in line identification work [see e.g. figs 1, 2 (plates 14, 15) in Jordan et al. 1978].
In Section 2 the observed properties of the line at Å are summarized. Section 3 sets out the possible origins of this line, as a transition in S i. The mechanisms by which the upper levels in S i are populated are discussed in Section 4. In Section 5, a line that appears near 1310 Å in the spectra of giant stars is identified with a transition in P ii. The conclusions are summarized in Section 6.
2 The observed properties of the 1319-Å line
2.1 The wavelength
There is a small difference between the measured wavelength of the observed line and that expected for the (blended) N i transition. The latter should have a mean wavelength of 1319.001 Å (Moore 1975), assuming intensity contributions according to LS-coupling, or adopting the oscillator strengths of Kurucz & Petreyman (1975).
From solar spectra, the wavelengths measured by Sandlin et al. (1986) and Curdt et al. (2001) are 1318.99 Å and 1318.98 Å, respectively. Neither measurement is formally consistent with the wavelength and uncertainty reported here from the stellar spectra (1318.94 Å, see below). Chipman & Bruner (1975) gave a shorter wavelength, 1318.92 Å, and also claim an overall wavelength accuracy of Å. The laboratory wavelengths of lines that they identified in the vicinity of 1319 Å agree with their measured values to within Å. With this degree of accuracy, the wavelength that they measure is consistent with the value derived below. In a solar flare spectrum observed from Skylab (Cohen, Feldman & Doschek 1978), the wavelength is reported as 1318.95 Å, with a typical accuracy of Å for narrow lines. Again this is consistent with the present value. The N i line at 1319.675 Å was also observed in the above flare spectrum at its expected wavelength, but was a factor of 3.8 weaker than the 1318.95-Å line.
The line near 1319 Å has now been observed in a wide range of main-sequence and giant stars. Here we concentrate on observations made with the STIS instrument on the HST. In addition to our own spectrum of Eri (HD 22049), the spectra used have been obtained from the archive at the Space Telescope Science Institute. For Boo A (HD 131156A) and Eri, wavelengths were measured by H. Kay and S. Sim, respectively, as part of our wider studies of these stars (private communications). Gaussian profiles were fitted to the lines. The wavelength of the line near 1319 Å was then found relative to nearby identified lines of S i (1300.907 Å) and C i (1311.363 Å). For all the stars, the relative wavelengths were measured using eye fits to the line centres ( Boo A and Eri were included to test that this was adequate). The results are summarized in Table 1. The mean wavelengths measured are 1318.946 Å and 1318.942 Å, with an overall mean value of 1318.94 Å. The uncertainty given reflects the differences between individual measurements.
The N i line at 1319.675 Å also appears near the solar limb and in active regions (see e.g. fig. 5 in Jordan 1988), but is much weaker than the line at 1318.94 Å. It is also present in the spectra of cool giants with enhanced N/C relative abundances, e.g in 24 UMa (HD 82210), Vel (HD 92497), Cap (HD 203387) and Cet (HD 4128). Using the known interval between the N i lines, the weaker member of the N i multiplet at 1319.001 Å then lies in the red wing of the stronger line at 1318.94 Å, but should have little effect on the wavelengths measured for this line.
Fig. 1 shows the region 1318.6 - 1320.0 Å in two spectra of Cet, obtained with the STIS. Note that the STIS wavelength calibration places the 1318.94 Å line at 1319.00 Å (line ’a’), in disagreement with that derived from the measured relative wavelengths given in Table 1. The only line present that appears in both spectra and could be the stronger member of the N i multiplet is that at 1319.74 Å (line ’c’), about 0.065 Å longer than expected. Then the weaker member of the N i multiplet would lie at 1319.07 Å (marked ’b’).
| Star | Type | ||
|---|---|---|---|
| (Å) | (Å) | ||
| HD 20630 | G5 V | 1318.952 | 1318.944 |
| HD 131156A | G8 V | 1318.946 | 1318.940 |
| HD 10700 | G8 V | 1318.944 | 1318.945 |
| HD 22049 | K2 V | 1318.944 | - c |
| HD 82210 | G4 III/IV | 1318.947 | 1318.934 |
| HD 92497 | G5 III+dF | 1318.942 | 1318.940 |
| HD 203387 | G8 III | 1318.949 | 1318.940 |
| HD 4128 | K0 III | 1318.949 | 1318.952 |
| HD 124897 | K1 III | 1318.939 | 1318.937 |
| Mean | 1318.946() | 1318.942() |
a Measured relative to S i 1300.907 Å.
b Measured relative to C i 1311.363 Å. c A chip problem
prevents a measurement.

2.2 The intensity and spatial distribution in the Sun
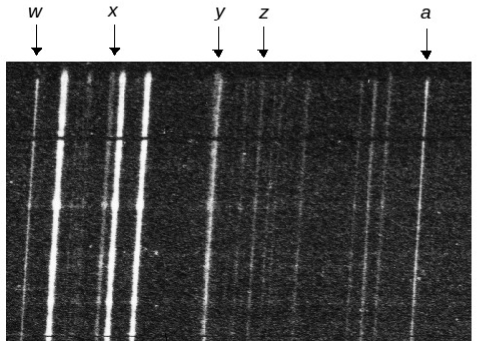
The spatial distribution of the various emission lines shown in figs 1 – 4 (plates 14 – 17) in Jordan et al. (1978) is very valuable in identifying the lines present. A 20 s exposure obtained from the HRTS-I flight is shown in Fig. 2. (This spectrum was provided by the late G. Brueckner and is shown by permission of G. Doschek, current Head of Solar Physics at NRL.) The overall spatial distribution of the line at 1318.94 Å (marked ’a’) is very similar to that of the S i line at 1300.907 Å (marked ’w’), a property first noted by Chipman & Bruner (1975). The line marked ’z’ is the C i line at 1311.363 Å. Other lines in Fig. 2 are discussed in Section 3.
The spatial distribution of the line at 1318.94 Å shows that it is a transition in a neutral atom. The energy level schemes of C i, N i, O i, Si i and S i have been examined for possible transitions. Most of the suitable unknown energy levels in these atoms occur above the first ionization limit. There are observed examples of narrow decays from theoretically non-autoionizing levels in C i (around 1329 Å), Si i (around 1256 Å) and in S i at 1300.907 Å.
Sandlin et al. (1986) give the peak intensities of solar lines between 1175 Å and 1680 Å in the quiet Sun (QS), a plage region (P) and a sunspot umbral region (U). These can be used to investigate the behaviour of lines of interest since there is little difference between the widths of lines of neutral atoms (0.08 Å for Si i, 0.085 Å for O i and S i, and 0.09 Å for C i and N i). The known lines of these elements have characteristic orderings of the intensity ratios I(P)/I(QS), I(U)/I(QS) and I(P)/I(U), which ultimately depend on the line formation processes and the structure of the solar atmosphere. Only lines with peak intensities of erg cm2 s-1 st-1 Å-1 are included, except for the N i at 1319.675 Å that is of particular interest.
The lines of S i discussed below are all transitions to terms of the ground state configuration (3s23p4). Such lines, including that at 1300.907 Å, which originates from the 3p3(2Do)5s 1D level above the first ionization limit, are characterised by intensities for which the P/QS ratios are largest ( 3) and the U/QS ratios are smallest ( 1). The average P/U intensity ratio is somewhat smaller than the average P/QS intensity ratio. The line at 1318.94 Å fits this pattern.
The lines of C i, including those near 1329 Å that originate from above the first ionization limit, show a different pattern; the P/QS ratios are largest () and the U/QS ratios are twice the P/U ratios of 1.5.
Although the ratios for N i line at 1319.675 Å have the same order as those of S i, both the P/QS and P/U ratios are much larger ( 9 and 7, respectively).
The intercombination lines of O i at 1355 Å and 1358 Å are the only (nearly) optically thin lines available. These have the same ordering as the lines of S i, but instead of similar P/QS and P/U values they have similar U/QS and P/U ratios.
Most lines of Si i have umbral peak intensities that are too small to use. The mean P/QS ratio is much larger ( 7) than for S i. The only unblended line (1255.27 Å) from above the first ionization limit has ratios that are most similar to those of N i.
Thus the known lines of C i, N i, O i and Si i do not follow the same pattern as that of the S i lines and the line at 1318.94 Å.
Since it is likely that the line at 1318.94 Å is due to a transition in S i, the ratio of the peak intensity of this line to that of the 1300.907-Å line is now examined. This ratio varies little between different solar features. From Sandlin et al. (1986), assuming that the line widths are the same, the ratio is 0.95 in a plage region, 0.80 in the sunspot umbra and 0.81 in the quiet region. The ratio of peak radiances given by Curdt et al. (2001) (in table 1a) are 0.92 (quiet Sun), 1.01 (sunspot) and 0.96 (coronal hole). The background has not been removed, but in each case is at least an order of magnitude lower than the peak intensity. Over this small wavelength range, the relative radiances measured by Curdt et al. (2001) should be more accurate than those from the photographic HRTS spectra. Even in the flare recorded by Cohen et al. (1978), the ratio is 0.98, similar to that in the quiet Sun. Thus a common origin of the two lines is likely.
In contrast, the ratio of the peak intensity of the line at 1319.675 Å to that at 1318.94 Å is 0.23 (P), 0.09 (U) and 0.08 (QS), far from the ratio of 2:1 (LS coupling) to 1.6:1 (Kurucz & Petreymann 1975) expected if both lines were due to N i.
Curdt et al. (2001) also show the ratio of the mean radiance (as a function of wavelength) from regions of supergranulation cell boundaries to those from cell interiors (see their fig. 4). They remark that the variation of this ratio depends on the type of emission line (e.g. formed in the corona or transition region, etc.). The line of S i at 1300.907 Å (and of other relatively strong S i lines) shows a behaviour shared by the line at 1318.94 Å. This takes the form of a lower ratio at and to the blue side of line centre, without significant emission to the red side of line centre.
2.3 Flux ratios in cool stars
In the evolved giants that have a larger than solar N/C abundance ratio, the N i lines at 1411.942 Å become apparent (in addition to the N i line at 1319.675 Å). The ratio of the fluxes in the 1411.942-Å and 1318.94 Å lines becomes substantially larger than in the cool dwarf stars. For example, using the fluxes () given by Ayres et al. (2007), the ratio (1411.94 Å)/(1318.94 Å) is 1.9 and 1.4 in the giant stars Vel and 24 UMa, respectively, but is only 0.2 in the dwarf star Cen A (HD 128621A). Thus the line at 1318.94 Å does not behave like a line of N i.
Given that the solar spectra obtained with the HRTS and SUMER suggest that the line at 1318.94 Å is due to a transition in S i, the ratio of the flux in this line to that of the S i line at 1300.907 Å has been examined in a range of cool stars. In the spectra of cool dwarf stars, the ratio is 0.96 in Eri (HD 22049) (S. Sim, private communication), 0.98 in Boo A (HD 131156A) (H. Kay, private communication) and 0.99 in Cen A (Ayres et al. 2007). In giant stars, the ratio appears to be slightly smaller, but accurate measurements of the 1300.907-Å line flux are harder because the resonance lines of O i become broadened by high opacities and, when present, the line of Si iii at 1301.146 Å can also be broad. However, the fluxes measured by Ayres et al. (2007) give ratios of 0.75 in both Vel and 24 UMa. Using simply the peak intensities (with the local background subtracted) in Cap, Cet and Boo (HD 124897) the ratio lies between 0.77 and 0.93. Again, this behaviour suggests a similar origin for the lines at 1300.907 Å and 1318.94 Å.
The line at 1318.94 Å does not appear to be pumped by radiation in another line. For example, its flux ratio relative to the S i line at 1295.65 Å, which is pumped by the O i 1302.17-Å line, is around 2 to 3 in dwarf stars, but less than around 0.5 in giant stars where pumping is more effective.
Overall, the solar and stellar observations do not support the identification of the line at 1318.94 Å with the N i transition, but do support the proposal that the line is due to S i.
2.4 Other observations
Carlsson, Judge & Wilhelm (1997) used observations with SUMER to study the dynamic nature of cell interiors in lines of He i (584.33 Å), C i (1364.16, 1329.58 and 1156.03 Å), N i (1199.55 Å and the 1318.94-Å line, which they identify with N i, 1319.00 Å), O i (1358.51 and 1152.15 Å), as well as lines of ionized species. In the context of the present work, their most interesting results are that the response to brightenings in the continuum emission at 1300 Å is slower in the 1318.94-Å line than in either C i (1329.58 Å) or C ii (1334.53 Å), and that the line at 1318.94 Å shows a behaviour that is qualitatively different from that of the N i line at 1199.55 Å.
3 Possible origins of the line at 1318.94 Å as a S i transition
3.1 Laboratory observations of S i between 1300 and 1320 Å
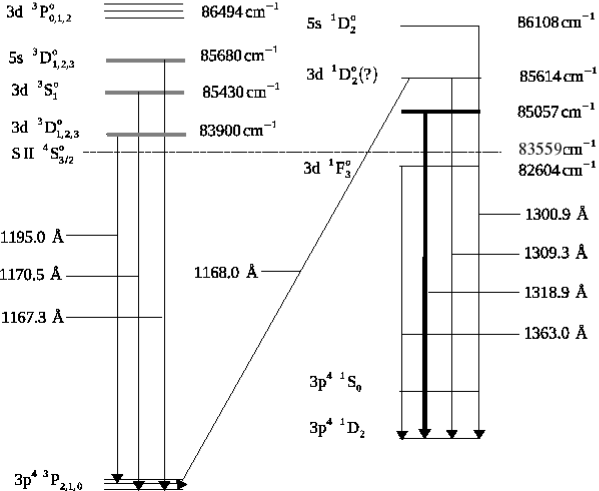
Fig. 3 gives a partial energy level diagram of S i, including the more important lines discussed below. The levels shown above the first ionization limit are all from terms in the 3s23p3(2Do)3d or 5s configurations (in Fig. 3 and hereafter 3d and 5s). The 3d 1Fo level is currently placed just below the first ionization limit. The 3d 1Po level is a known bound state. Energies are taken from Kaufman & Martin (1993), except for the level at 85057 cm-1, required to account for the line at 1318.94 Å.
There have been two reports of a line near 1319 Å in laboratory spectra that were obtained without the presence of lines of N i, but the reasons for the absence of the line in other experiments must also be considered.
Müller (1968) reported unidentified lines of S i at 1319.0, 1300.0 and 1228.0 Å in absorption line measurements made using a wall-stabilized arc containing SF6. Transitions from all the ground configuration terms of S i were observed and also some lines of S ii. It is possible that the line at 1300.0 Å is the known S i line at 1300.907 Å, but the wavelengths that Müller measured for other lines of S i agree with currently accepted values to within Å. Thus the presence of the line at 1300.907 Å is not certain. The wavelength of Müller’s line at 1319.0 Å is consistent with that observed in the Sun and cool stars at 1318.94 Å. Only weak lines of S i are expected near 1228 Å.
Müller’s source was in equilibrium at a temperature () of about 1.2 K, and the populations of the levels in the ground configuration were expected to be given by the Boltzmann distribution. Since the strength of absorption lines depends on both the lower level population and the oscillator strength, only the product could be found for the unidentified lines. (Here, is the statistical weight of the lower level, is the absorption oscillator strength and is the energy of the lower level.) These products were the same for the lines at 1319 Å and 1300 Å. If the 1300-Å line is the transition at 1300.907 Å, then the measured value of is only 19 per cent larger than the value (using ) calculated by Deb & Hibbert (2008) and 5 per cent larger than the value from Kurucz (2009). This lends some support to the identification of the line with that at 1300.907 Å. (Other calculations of oscillator strengths of S i lines are discussed by Deb & Hibbert 2008.) In this case, the oscillator strength of the line at 1318.94 Å would be expected to be very similar to that of the line at 1300.907 Å. Overall, the presence of a line of S i at 1318.94 Å in Müller’s spectrum seems likely, but that of the line at 1300.907 Å is not certain.
Berry et al. (1970) measured the beam-foil emission line spectrum of sulphur between 600 and 4000 Å and identified lines of S i to S vi. Checks were made that showed that carbon, nitrogen and oxygen did not contribute to the spectrum. A weak line was reported at 1318 Å and was attributed to a low stage of ionization (S i to S iv). No line was observed at 1301 Å. Kaufman & Martin (1993) list a S iv line at 1319.04 Å, so the presence in the source of a line of S i at 1318.94 Å is not certain.
Apart from the work by Tondello (1972) and Kaufman (1982, and references therein), other experiments have not covered the wavelength region including 1319 Å, or have observed only transitions to the ground 3P term. Tondello (1972) used a flash-pyrolysis system and very pure sulphur powder to produce the absorbing medium. Weak lines of C i, O i and Si i were also present. He reported and identified the S i lines at 1300.91, 1308.2 and 1309.3 Å for the first time.
In Tondello’s (1972) spectrum, the line at 1308.2 Å is fuzzy (see his fig. 4) since the upper levels (5s 3Do) can autoionize. (The lower level is the 1D2 level of the ground configuration). The line at 1309.3 Å is reported to be broader than other single lines, but might be blended with the 2P - 2S1/2 line of Si ii at 1309.276 Å, since the weaker member of the Si ii multiplet seems to be present at 1304.370 Å. There is some doubt about the identity of the upper level; in Martin et al. (1990) and Kaufman & Martin (1993) it is given as 3d 1D, but both the 3d and 1D assignments are accompanied by question marks. The line at 1309.3 Å is identified here for the first time in the solar spectrum. It appears in 20 s exposures obtained during the HRTS-I rocket flight and is a narrow line that is blended with the Si ii line at 1309.276 Å. In Fig. 2 it is most obvious near the solar limb, where the Si ii line (marked ’y’) becomes optically thick and relatively weaker (see also the line marked ’x’, which is the weaker member of the Si ii multiplet). Unlike the Si ii line, the narrow line does not extend above the solar limb. The wavelength measured here is 1309.36 Å. The average wavelength of this line and that of the Si ii line at 1309.276 Å then agrees with Tondello’s (1972) listed wavelength of 1309.3 Å.
The absence of the 1318.94-Å line from Tondello’s (1972) list is a potential problem, since he observed absorption lines from all the terms of the ground configuration, including the lines at 1300.91 and 1309.3 Å. As discussed in Sections 2.2 and 2.3, in main-sequence stars, the 1300.91-Å line has a similar intensity (or flux) to that of the 1318.94-Å line. However, Tondello (1972) states that his table 3 gives new lines that are observed and classified from his spectra, which are illustrated up to 1310 Å. Since no list of observed but unclassified lines is given, the presence of a line at 1318.94 Å cannot strictly be excluded.
Kaufman (1982) reported results from emission line spectra in the wavelength range from 1157 Å to 4158 Å. Only two levels above the first ionization limit were included, (2Do)5s 1D and (2Po)5s 1P. Lines of N i were included in those used for wavelength standards, so if the line at 1318.94 Å were present, it could perhaps have been masked by N i.
3.2 Possible S i transitions
If the line at 1318.94 Å is due to S i, what are the possible upper levels? No previously known levels can account for just one (narrow) transition to the ground 3P term at this wavelength (the upper level would lie below the 4So ionization limit). A transition to the ground configuration 1S0 level would require an upper level with . No suitable levels with a 2Do or 2Po parent are expected at the required energy of 97998 cm-1. This leaves a decay to the 1D2 level of the ground configuration; the unknown upper level must then have = 1, 2 or 3. With a wavelength of 1318.94 Å, the energy of the upper level would be 85057.1 cm-1 above the S i ground level, and 1498.0 cm-1 above the 4S ionization limit. The identifications of the autoionizing 3d 3Do, 3d 3So and 5s 3Do levels seem to be secure. The singlet levels are discussed below.
The levels to be considered are (i) 3d 1D, currently attributed, with question marks, to the level at 85614 cm-1, (ii) 3d 3F which have so far not been located, and (iii) 3d 1F, currently attributed to a level at 82604.41 cm-1 (below the 4So ionization limit).
Deb & Hibbert (2006) carried out theoretical calculations of energy levels and oscillator strengths in S i. They report energy levels for LS terms including the effects of configuration interaction (CI) and they include levels above the first ionization limit. Fine structure is also included in some of their calculations of oscillator strengths. An extended list of LSJ oscillator strengths is given by Deb & Hibbert (2008). Although Deb & Hibbert (2006) state that the accuracy of their calculated energy levels above the 4So ionization limit is not sufficient for individual line identifications, there are aspects that are useful to the present work.
There is a significant difference between the order of the calculated energy levels and those allocated on the basis of laboratory observations. In particular, the 3d 1F level is calculated to lie above the 4So ionization limit, while the 3d 3Fo term is predicted to lie below this limit. The same order for these levels was predicted in the earlier calculations, given in topbase (the Opacity Project Team 1995). There appears to have been no explicit discussion in the literature of the order of the 3d 1Fo and 3d 3Fo terms.
If the order of the calculated levels is assumed to be correct, then the assignment of the 5s 1D term and two singlet 3d terms of interest would be as follows. The highest level is 5s 1D and can be attributed to the shortest wavelength line at 1300.907 Å. The 3d 1F level would be the next highest and would then be identified with the level at 85614 cm-1, instead of 3d 1D. The proposed level at 85057 cm-1, would become the 3d 1D level. The 3d 3Fo term would remain unidentified and is calculated to lie below the 4So ionization limit.
The evidence for the current identification of the 3d 1F level at 82604.41 cm-1 is now considered. The transition to the ground configuration 1D2 level occurs at 1363.03 Å and according to Kaufman & Martin (1993) has a relatively low intensity in laboratory spectra. Deb & Hibbert (2008) calculate a large transition probability for this transition ( = 4.74 s-1), having adjusted their calculated energy level to fit the classification by Kaufman (1982). Kurucz (2009) has also calculated oscillator strengths for a large number of S i lines, using a semi-empirical approach. His results are mentioned when they differ significantly from those of Deb & Hibbert (2008). For the line at 1363.03 Å the oscillator strength found by Kurucz (2009) is over three orders of magnitude smaller than that calculated by Deb & Hibbert (2008). The line at 1363.03 Å is not observed in the stellar and quiet Sun spectra used in the present studies, although a weak line does occur in the solar flare spectrum (Cohen et al. 1978). This is understandable if the 3d 1F level is populated by collisions from the ground configuration 1D2 level. The situation in giant stars is more complex; the energy of the 3d 1F3 level is close to that of levels (having the 4So parent) with = 11, 12 and 13, which can be pumped by the H Ly line (Brown & Jordan, 1980). Cascades from these high- levels lead to relatively strong lines of S i in the uv spectra of giant stars (Judge 1988). Thus the current identification of the 3d 1F level with that at 82604.41 cm-1 depends on one relatively weak line in laboratory spectra. No decay to the ground 3P2 level has been observed at 1210.59 Å, consistent with its much lower transition probability (Deb & Hibbert 2008).
The level at 85614 cm-1 is currently identified as 3d 1D (Kaufman & Martin 1993), but with question marks (see above). The line at 1309.3 Å originates from this energy level. Deb & Hibbert (2008) calculate a transition probability () that is smaller by a factor of 27 than that of the 1300.907-Å line, whereas that found by Kurucz (2009) is only 10 percent smaller. In the LS calculations of energy levels by Deb & Hibbert (2006), apart the 3d 1F level, the 3d 1D level has the largest difference between the observed and calculated values.
In the Sun and cool dwarfs the 1309.3-Å line is blended with a strong line of Si ii (see Section 3.1) and although distinguishable near the limb in solar spectra, its intensity has not been measured. The most one can say is that it is a little weaker than, and comparable in width to, the lines at 1300.907 and 1318.94 Å. In the K-giants the Si ii line becomes relatively weaker than the S i line at 1300.907 Å and the total flux in the Si ii line can be used to limit the contribution from the S i 1309.3-Å line, e.g. in Boo, this limit is that of the 1300.907-Å line. The expected relative intensity of the 1309.3 and 1300.907-Å lines does, of course, depend on the excitation mechanism, not just the transition probabilities (see Section 4). Also, the radiative transfer in the Si ii and S i lines needs to be treated simultaneously to investigate any pumping of the S i line when the Si ii line has a high opacity.
Decays from a 3d 1D level can also occur to the ground 3P2,1 levels. With the upper level at 85614 cm-1, these are expected at 1168.03 Å and 1173.46 Å, respectively. A relatively weak line line at 1168.03 Å is observed in laboratory spectra (Kaufman & Martin 1993), and at 1168.06 Å in the solar spectrum (Curdt et al. 2001). (The latter wavelength appears to originate from Kelly 1987, who adopted earlier values for the energy levels of the ground 3P term.) No line has been reported at 1173.46 Å. According to the calculations by Deb & Hibbert (2008), both of the above lines have very small branching ratios for decays from the upper level and it is surprising that the line at 1168.03 Å is observed in the Sun.
If instead the level at 85614 cm-1 were the 3d 1F level, the same decays would be expected except that to the 3P1 level at 1173.46 Å.
The possibility that the 3d 1D level lies at 85057 cm-1 is now considered. If it does, the difference between the energies observed and calculated by Deb & Hibbert (2006) would be reduced from -780 cm-1 to -222 cm-1 (more in line with the differences found for other energy levels, apart from the current attribution for the 3d 1F level.) Decays to the ground 3P2,1 levels would occur at 1175.68 Å and 1181.18 Å. No line at 1181.18 Å has been reported in laboratory spectra; there, a line at 1175.68 Å could be masked by nearby, broad autoionizing transitions. In the Sun and cool stars, a line at 1175.68 Å would be blended with the strongest member of multiplet uv 4 of C iii. A blend has been indicated in fig. 4 of Curdt et al. (2001) at 1175.65 Å, but the possible stage of ionization is not given and the line does not appear in their table A.1. No solar line has been reported at 1181.18 Å, nor does one appear in the stellar spectra. Thus, without knowledge of the transition probabilities, it can be neither confirmed or excluded that the proposed level at 85057 cm-1 is the 3d 1D level.
Finally, if some unrecognized interaction reverses the order of the 3d 1Fo and 3d 3Fo terms from that calculated, it would, in principal, be possible for the level at 85614 cm-1 to be the = 2 and/or 3 levels of the 3d 3Fo term. This was suggested by Joshi et al. (1987), but the higher members of their proposed d-series have not been confirmed. However, since the line at 1309.3 Å would be an intersystem line, the similar intensities of the lines at 1300.907, 1309.3 and 1318.94 Å would need to be explained in terms of calculated -values and excitation mechanisms. Decays to the ground 3P term would also break the LS coupling selection rules, but decays at long wavelengths through other bound levels are possible.
4 Processes causing the large fluxes in the lines at 1301 and 1319 Å
Judge (1988) gives a full discussion of the excitation mechanisms for multiplets of S i observed in spectra of cool giants with the IUE, and of the ionization and recombination mechanisms. In particular, he estimated that photoionization dominates over collisional ionization and that low-temperature di-electronic recombination is comparable in magnitude to radiative recombination. (Low-temperature dielectronic recombination was also found to be a likely contributor to the observed flux in multiplets uv 3 and uv 11.) In the cool giant stars Judge (1988) estimates that the S i/S ii population ratio is only about 0.1 at the temperature where the lines are formed. In the chromospheres of cool dwarf stars, the electron densities are larger, and the relevant radiation fields need to be computed to find the above population ratio.
The populations of the upper levels of the observed solar (or stellar) lines of S i can be found by making use of the observed intensities or fluxes, a solar or stellar model and the transition probabilities. Full radiative transfer also needs to be included for lines and continua. Here, the aim is to simply identify the processes that lead to the relatively strong lines at 1300.907 and 1318.94 Å. The autoionizing triplet levels are considered first.
Wilhelm et al. (2005) discovered broad emission features in the solar spectrum around 1170 Å, which Avrett, Kurucz & Loeser (2006) identified as radiative decays of the S i autoionizing 3d 3S and 5s 3D levels, to the levels of the ground 3P term. The strongest features lie at 1170.55 and 1167.13 Å, respectively, adopting the calculated wavelengths from Kaufman & Martin (1993). Using the widths measured by Tondello (1972) leads to autoionization rates of s-1. The radiative decay rates calculated by Deb & Hibbert (2008) are far smaller, s-1. Under these circumstances (provided rates to and from other levels are much smaller than the autoionization rate), the ratio, is determined by detailed balance between autoionization and dielectronic capture. Here, , and are the number densities of the upper level, the ground state of S ii and the electrons, respectively. The S i lines from the autoionizing levels are therefore low temperature equivalents of the high temperature dielectronic satellite lines found in the He i-like ions (Gabriel & Jordan 1969). (The relevant theory is set out in Gabriel & Paget 1972). The above ratio is then given by the Saha – Boltzmann equation. Using the statistical weights of the 5s 3Do autoionizing levels (level u) and the 4S ground state of S ii, and the energy of the 5s 3Do term above the ionization limit, leads to
| (1) |
Thus the ratio can be found as a function of , provided is known from a solar (or stellar) model.
Avrett et al. (2006) made a preliminary model that accounted for the strength of the autoionizing lines observed in the SUMER spectra, but they stressed that a more detailed model was being prepared. This has been published by Avrett & Loeser (2008) and is based on lines of hydrogen, carbon and oxygen. Avrett et al. (2006) also illustrate the contribution function for the 1167.13-Å line, which peaks at about 5720 K, but the line formation process was not discussed. Over the temperature range where the 1167.13-Å line is mainly formed in the Avrett et al. (2006) model, the values of in the Avrett & Loeser (2008) model are larger by only about a factor 1.5, this factor reflecting larger values of . The values of the ratio at 5720 K are and , respectively.
The value of can be expressed as
| (2) |
Using a sulphur abundance of 2 that of hydrogen and gives an upper limit for as a function of . At 5720 K, the values are 0.15 and 0.035 cm-3, using the values of from the models by Avrett & Loeser (2008) and Avrett et al. (2006), respectively.
The intensity of the decay from , for an optically thin line in a plane parallel atmosphere, is given by
| (3) |
where is the radiative decay rate from the upper level, u, and is the path length through the atmosphere. The lines of interest show brightening as the solar limb is approached (see Avrett et al. 2006), so they are unlikely to have a very high opacity. To allow for some opacity, the constant of 4 in equation (1) is replaced by 2 in the calculations that follow. This introduces an uncertainty of a factor of two in the upper level populations, since with very high opacities, the constant would be (see discussion in Pietarila & Judge 2004).
Using the observed peak radiance (Curdt et al. 2001) with the continuum removed, the line width from Tondello (1972) and the value of from Deb & Hibbert (2008), the value of can be found and is 2.3 cm-2. Using the half-width of the extent of the emitting region from the contribution function for the 1167.13-Å line given in Avrett et al. (2006) (this is not available for the model by Avrett & Loeser 2008), the mean value of for the 5s 3Do levels can be found. This is cm-3, consistent with the upper limit of 3.5 cm-3 given above. The fact that the estimated population density of the 5s 3Do term is only a factor of 2.5 lower than the upper limit expected from the Saha – Boltzmann equation, when = 1 is adopted, strongly supports the proposal that the autoionizing levels are populated by low-temperature dielectronic capture.
Ignoring any decays from higher levels, the dielectronic recombination rate coefficient through the 5s 3Do levels can also be found, by taking into account the fraction of the dielectronic captures that undergo radiative decay. The value is cm3 s-1, using the -values of Deb & Hibbert (2008). Judge (1988) estimated the total low-temperature dielectronic recombination rate coefficient through levels within 5,000 cm-1 of the S ii ground state to be cm3 s-1, using the method set out by Storey (1981) (see also Nussbaumer & Storey 1983), although only approximate radiative rates were then available.
The relative intensity of the 1300.907-Å line to that of the 1167.13-Å line can be used to find the population of the 5s 1D level relative to that of 5s 3Do, making use of the -value by Deb & Hibbert (2008) for the 1300.907-Å transition. The intensity of the 1300.907-Å line is found from the radiance given by Curdt et al. (2001) with the local continuum removed. It is assumed that this line is formed over the same region of the solar atmosphere as the 1167.13-Å line. This approach leads to a population of the 5s 1D level that is about 0.1 times that of the 5s 3Do term.
Even when it is assumed that all sulphur is in the form of S i, and with generous estimates for the collisional excitation rate from 3p4 1D2, and for and , it is clear that the 5s 1D level population is several orders of magnitude too large to be accounted for by collisions from the ground configuration 1D2 level (see also Judge 1988).
The large population of the 5s 1D level is not surprising since the wavenumber region between 83900 cm-1 and 85680 cm-1 contains three autoionizing terms that are expected to be heavily populated by di-electronic capture. This region also contains the proposed level at 85057 cm-1, required to account for the line at 1318.94 Å. It is therefore possible that the non-autoionizing levels in this region are populated mainly by collisions between these and the autoionizing levels. With the small energy intervals involved, collisions with heavy particles as well as electrons need to be considered. Also, since the autoionization rates are so much larger than the radiative decay rates, only a small amount of spin-orbit mixing between the autoionizing 5s 3D level and the 5s 1D level, and between the autoionizing 3d 3D level and the 3d 1D level could lead to dielectronic capture directly into these singlet states. Using the non-thermal width of the 1300.907-Å line in STIS spectra of Eri (Sim & Jordan 2003) the autoionizing rate involved must be less than s-1, but could still be significantly larger than the radiative rate of 2.9 s-1 (Deb & Hibbert 2008). In either case, it is the presence of the strongly autoionizing states in S i that leads to the strength of the decays from the singlet levels.
5 The 1309 – 1310 Å emission feature in cool giants
In cool giants, the spectrum between 1309 and 1310 Å becomes more complex than in the cool dwarf stars. The Si ii line at 1304.370 Å becomes blended with the blue wing of the O i line at 1304.858 Å. Pumping by this O i line distorts the normal profile of the Si ii line at 1309.275 Å (Jordan & Judge 1984; Munday 1990). Examples of this can be seen in the G-type giants 24 Uma and HR 9024. In cooler giants such as Vel, Cap and Cet, another distinct line becomes apparent at 1310 Å and this becomes the dominant feature in the K-giants Boo and Tau. The additional presence of the S i line at 1309.36 Å is now known to complicate the spectrum. Although, from spectra obtained with IUE, Jordan & Judge (1984) thought that much of the feature in Tau might be due to Si ii, the presence of the separate line in the STIS spectra of the above giants suggests that this is not the case. A possible contribution from a line of P ii was discussed, but was thought to be unlikely given the low abundance of phosphorus. This line has a wavelength of 1309.87 Å, consistent with that measured here from the STIS spectra, and is the 3s23p2 3P2 – 3s3p3 3P transition. The upper level can be pumped from the lower 3P1 level at 1304.68 Å, by the O i 1304.858 Å line. There is also a less close coincidence between the P ii 3P0 – 3P line and the O i line at 1302.168 Å. The wavelength coincidence with the more effective O i pumping line is closer for the P ii line than for the Si ii line, so the higher O i line opacities in the K-giants could counteract the lower abundance of phosphorus to produce an observable line. In cool stars, a relatively strong line of Cl i at 1351.66 Å (chlorine has a similar abundance to that of phosphorus) is produced by photoexcitation by the C ii resonance line at 1335.71 Å (Shine 1983).
6 Discussion and conclusions
The observational evidence from both solar and stellar uv spectra strongly suggests that the line near 1319 Å is not due to N i, as commonly adopted in the literature. The observed wavelength of 1318.94 Å, measured relative to other lines of neutral atoms, does not agree with that of the N i line at 1319.001 Å and the intensity (or flux) in the observed line is much larger than that expected from the theoretically stronger member of the multiplet at 1319.675 Å. Also, between giant stars where the nitrogen abundance is enhanced and dwarf stars, the ratio of the N i lines at 1411.942 Å to that of the 1318.94-Å line becomes significantly larger. The wavelength calibration of spectroscopic instruments that have assumed that the line at 1318.94 Å is the N i line at 1319.001 Å need to be reexamined in this wavelength region.
It is proposed that the unidentified line at 1318.94 Å is due to a transition in S i from above the 4So ionization limit. On the basis of the order of the energy levels calculated by Deb & Hibbert (2006), the proposed level at 85057 cm-1 is identified with the 3d 1D level. This was previously tentatively assigned to a level at 85614 cm-1 (Martin et al. 1990; Kaufman & Martin 1993). This identification reduces the difference between the observed energy level and that calculated by Deb & Hibbert (2006). The wavelengths of the possible decays to the ground 3P2,1 levels are 1175.68 and 1181.18 Å. The latter line is not observed and blending prevents the detection of the line at 1175.68 Å.
The level at 85614 cm-1 could then be 3d 1F. However, if the order of the 3d 1Fo and 3d 3Fo terms is reversed compared with that calculated, an alternative classification of the level at 85614 cm-1 would be one or both of the 3d 3F levels, as suggested by Joshi et al. (1987). The expected weakness of confirming decays to the ground 3P term prevents a definite conclusion. The decay to the ground configuration 1D2 level at 1309.36 Å has been observed for the first time in an astrophysical spectrum (in the Sun). In contrast to the conclusion by Tondello (1972), this line does not appear to be significantly broader than that at 1300.907 Å, although blending with the Si ii line at 1309.276 Å prevents a proper measurement.
One test of the proposed identifications would be to use them to ’fine tune’ the calculated energy levels that are adopted in the calculations of the oscillator strengths, in the manner described by Deb & Hibbert (2006). For example, the -value of the line at 1309.36 Å might be smaller if the upper level were part of the 3d 3Fo term than if it were the 3d 1F level. The resulting relative line intensities could then be tested against those observed. All the lines of S i discussed here need to be included in calculations of model atmospheres. They can provide good tests of chromospheric electron densities and in-situ radiation fields because both control the relative population densities of S i and S ii.
The overall strength of the observed lines from the levels in the (2Do)3d and 5s configurations can be attributed to low-temperature dielectronic recombination. In the Sun, the upper level populations of the lines examined are within about an order of magnitude of those given by the Saha – Boltzmann equation.
As part of the work on the region around the Si ii line at 1309.275 Å,
a distinct line at 1309.87 Å that becomes apparent in the late-G/early-K
giants has been identified as a P ii transition, pumped by the strong
O i line at 1304.86 Å. This becomes much stronger than the
Si ii line in the cooler K-giants Boo and Tau.
ACKNOWLEDGMENTS
I am grateful to Rachel Koncewicz and the Media and Services group (Oxford
Physics Department) for producing the figures, to Prof. Hibbert for
drawing my attention to the paper by Deb & Hibbert (2006) and to Prof. M.
Carlsson for early discussions about the solar properties of the line near
1319 Å. This research has made use of the Multimission Archive at the Space
Telescope Science Institute (MAST).
REFERENCES
Avrett E. H., Kurucz R. L., Loeser R., 2006, A&A,
452, 651
Avrett E. H., Loeser R., 2008, ApJS, 125, 229
Ayres T. R., Hodges-Kluck E., Brown A., 2007, ApJS, 171,
304
Berry H. G., Schectman R. M., Martinsson I., Bickel W. S.,
Bashkin S., 1970, JOSA, 60, 335
Brown A., Jordan C., 1980, MNRAS, 191, 37P
Burton W. M., Ridgeley A., 1970, Sol. Phys., 14, 3
Carlsson M., Judge P.G., Wilhelm K., 1997, ApJ, 486, L63
Chipman E., Bruner E. C., 1975, ApJ, 200, 765
Cohen L., Feldman U., Doschek G. A., 1978, ApJS, 37, 393
Curdt W., Brekke P., Feldman U., Wilhelm K., Dwivedi B.
N., Schüle U., Lemaire P., 2001, A&A, 375, 591
Deb N. C., Hibbert A., 2006, J. Phys. B., 39, 4301
Deb N. C., Hibbert A., 2008, ADNDT, 94, 561
Gabriel A. H., Jordan C., 1969, Nat, 221, 947
Gabriel A. H., Paget T. M., 1972, J.Phys.B, 5, 673
Jordan C., 1988, JOSA B, Vol.5, No.10, 2252
Jordan C., Judge P. G., 1984, Phys. Scripta, Vol.T8, 43
Jordan C., Brueckner G. E., Bartoe J.-D. F., Sandlin G.
D., VanHoosier M. E., 1978, ApJ, 226, 687
Joshi Y. N., Mazzoni M., Nencioni A., Parkinson W. H.,
Cantu A., 1987, J. Phys. B, 20, 1203
Judge P. G., 1988, MNRAS, 231, 419
Kaufman V., 1982, Phys. Scripta, 26, 439
Kaufman V., Martin, W. C., 1993, J. Phys. Chem. Ref.
Data, 22(2), 279
Kelly R. L., 1987, J. Phys. Chem. Ref. Data, 16, 1
Kurucz R. L., 2009, http://kurucz.harvard.edu/atoms/
1600
Kurucz R. L., Peytremann E., 1975, SAO Special Report
No. 362, Smithsonian Institution and Astrophysical
Observatory, Cambridge, Mass.
Martin W. C., Zalubas R., Musgrove A., 1990, J. Phys.
Chem. Ref. Data, 19(4), 821
Moore C. E., 1975, Nat. Stand. Ref. Data Ser., NBS, 3,
Section. 5.
Müller D., 1968, Zeit. Naturforsch, 23a, 1707
Munday M. 1990, D.Phil. Thesis, University of Oxford
Nussbaumer H., Storey P. J., 1983, A&A, 126, 75
Pietarila A., Judge P. G., 2004, ApJ, 6060, 1239
Sandlin G. D., Bartoe J.-D. F., Brueckner G. E., Tousey
R., VanHoosier M. E., 1986, ApJS, 61, 801
Shine R. A., 1983, ApJ, 266, 882
Sim S. A., Jordan C., 2003, MNRAS, 341, 517
Storey P. J., 1981, MNRAS, 195, 27P
The Opacity Project Team, 1995, The Opacity Project,
Vol. 1, IoP Publications, Bristol, UK
Tondello G., 1972, ApJ, 172, 771
Wilhelm K., Schüle U., Curdt W., Hilchenbach M., Marsch
E., Lemaire P., Bertaux J.-L., Jordan S. D., Feldman
U., 2005, A&A, 439, 701