The complex circumstellar environment of HD 142527. ††thanks: Based on observations collected at the European Southern Observatory, Chile. Under program IDs: 075.C-0687A, 076.C-0266A and 079.C-0286A.
Abstract
Context. The recent findings of gas giant planets around young A-type stars suggest that disks surrounding Herbig Ae/Be stars will develop planetary systems. An interesting case is HD 142527, for which previous observations revealed a complex circumstellar environment and an unusually high ratio of infrared to stellar luminosity. Its properties differ considerably from other Herbig Ae/Be stars. This suggests that the disk surrounding HD 142527 is in an uncommon evolutionary stage.
Aims. We aim for a better understanding of the geometry and evolutionary status of the circumstellar material around the Herbig Ae/Be star HD 142527.
Methods. We map the composition and spatial distribution of the dust around HD 142527. We analyze SEST and ATCA millimeter data, VISIR N and Q-band imaging and spectroscopy. We gather additional relevant data from the literature. We use the radiative transfer code MCMax to construct a model of the geometry and density structure of the circumstellar matter, which fits all of the observables satisfactorily.
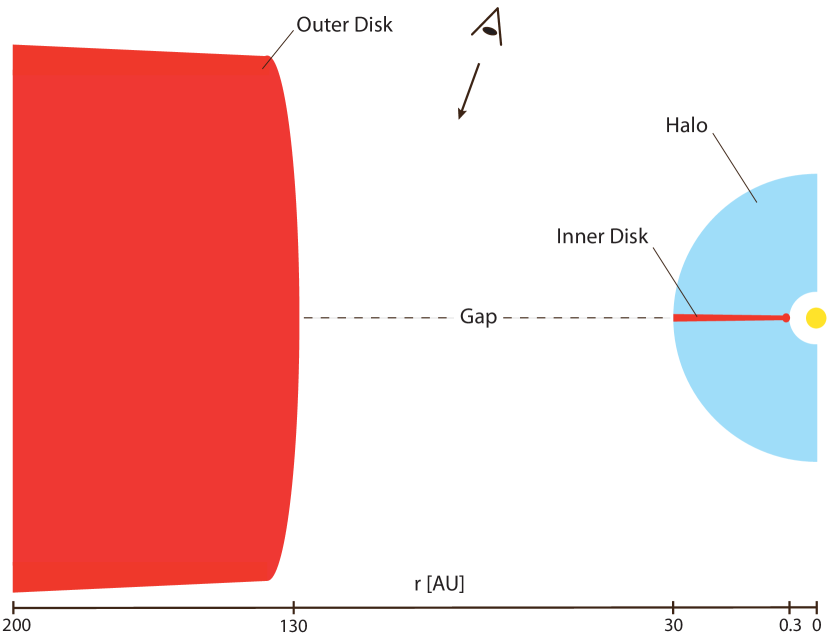
Results. We find that the disk of HD 142527 has three geometrically distinct components separated by a disk gap running from 30 to 130 AU. There is a geometrically flat inner disk running from 0.3 AU up to 30 AU; an optically thin halo-like component of dust in the inner disk regions; and a massive self-shadowed outer disk running from 130 AU up to 200 AU. We derived a total dust mass in small grains of 1.010-3 M⊙ and a vertical height of the inner wall of the outer disk of h = 60 AU. Owing to the gray extinction of the ’halo’ we obtained new stellar parameters, including a stellar luminosity of 202 L⊙ and age of 106.7±0.4 yr.
Conclusions. We find that the disk surrounding HD 142527 is highly evolved despite the relatively young age of the star. The peculiar disk geometry can explain the extreme IR reprocessing efficiency of the disk. Furthermore, the geometry, the large disk mass, and the highly processed dust composition are indicative of on-going planet formation.
Key Words.:
Stars: formation - Protoplanetary disks - Stars: variables: T Tauri, Herbig Ae/Be - Radiative transfer - HD 1425271 Introduction
Herbig Ae/Be (HAeBe) stars are intermediate mass, pre-main sequence (PMS) stars with an infrared (IR) excess and emission lines. The observed IR excess is caused by circumstellar dust confined to a disk. Based on the amount of far-IR excess emission the geometry of these disks is considered to be either flaring or flattened, classified by Meeus et al. (2001) as group I or II respectively. The composition, structure and evolution of these disks has been extensively studied because they are generally believed to be the sites of ongoing planet-formation. Recent discoveries of gas giant planets in wide orbits around intermediate mass young stars (Marois et al., 2008; Kalas et al., 2008; Lagrange et al., 2009) provide exciting support for this interpretation of disks around Herbig Ae/Be stars. In this study, we focus on the F6IIIe star HD 142527. This star is particularly interesting because its extremely large IR and millimeter excess is hard to understand in terms of a passive disk model (see Dominik et al. 2003).
The disk of HD 142527 has been imaged in scattered light (Fukagawa et al., 2006) and in the thermal IR (Fujiwara et al., 2006), showing that the disk extends to several hundred AU with a prominent disk gap at a distance of about 100 AU. The dust in the disk is highly processed. Both the scattered light and thermal IR images show evidence for grain growth: the inferred typical grain sizes are 1-2 m. This picture is also seen in the thermal IR spectrum of HD 142527. Van Boekel et al. (2004a) show that the silicates in the inner disk, spatially resolved with the MIDI instrument at the Very Large Telescope Interferometer, are fully crystalline. Even the integrated disk spectrum of HD 142527 has a crystallinity of more than 20%. The outer cold dust is characterized by crystalline water ice and possibly hydro-silicates (Malfait et al., 1999), again pointing to a highly processed dust environment. Recently, Honda et al. (2009) showed evidence for crystalline water ice in the near-IR scattered light spectrum of the disk. Ohashi (2008) showed that the cold dust is distributed in an arc-like structure, which adds to the complexity of the source.
Clearly, the disk of HD 142527 is in an interesting evolutionary phase. Its unusual properties might be caused by giant planet formation in the outer disk. In particular we are interested in understanding the very large far-IR excess, the geometry of the disk and the mineralogy of the dust. For this purpose we gathered a comprehensive data set on this object, consisting of SEST and ATCA millimeter photometry, a Spitzer-IRS spectrum, ISO-SWS and LWS spectra, VISIR N and Q-band imaging, VISIR N and Q-band spectroscopy, and optical, infrared and millimeter photometry. In this paper, we focus on the SED and the disk geometry. In a future paper (Min et al., in preparation) we will study the dust mineralogy. This paper is structured as follows: In Sect. 2 we motivate the adopted stellar parameters. Section 3 describes the observations and the data reduction. In Sects. 4 through 6 we carry out an in-depth analysis of these data-sets. In Sect. 7 we construct a comprehensive model of the disk geometry using a Monte Carlo radiative transfer code and address the discrepancies between model and observations. The discussion in Sect. 8 considers the emerging geometrical picture of the circumstellar matter and possible explanations for the peculiarities. Section 9 summarizes our main conclusions.
2 Stellar parameters
| Parameter | Value |
|---|---|
| Right Ascension | 15h 56m 41 89 |
| Declination | -42∘ 19 235 |
| Spectral Type | F6IIIe |
| [K] | 6250 |
| Distance [pc] | 14515 |
| 0.600.05 | |
| Luminosity [L⊙] | 202 |
| Radius [R⊙] | 3.80.3 |
| Mass [M⊙] | 2.20.3 |
| log Age [yr] | 6.70.4 |
| Group | Ia |
HD 142527 was cataloged as an F6III star by Houk (1978). Henize (1976) noted its emission line nature and Waelkens et al. (1996) classified it as a Herbig star. With Hipparcos measurements, van den Ancker et al. (1998) placed it at a distance of 200 pc, but we consider the association by Acke & van den Ancker (2004) to the star-formation region Sco OB2-2 to be more reliable and therefore adopt the distance of 145 pc (de Zeeuw et al. 1999), which is within 2 sigma of the Hipparcos distance. By comparing a Kurucz (1991) model for the photosphere associated with the given spectral type to the literature photometry, we obtained an optical extinction of = 0.600.05 and a stellar luminosity of = 152 L⊙. However, our modeling of the dust (see Sect. 7.2) demonstrates the presence of a gray extinction component. Taking this component into account, we derive a stellar luminosity of = 202 L⊙. A stellar radius of = 3.80.3 R⊙ was derived from the effective temperature and the luminosity. The position in the Hertzsprung-Russell diagram was compared with the PMS evolution tracks of Siess et al. (2000), which resulted in a stellar mass of = 2.20.3 M⊙ and an age of 106.7±0.4 yr. Table 1 summarizes the stellar parameters.
3 Observations and data reduction
3.1 SEST
HD 142527 was observed with the 15 m Swedish/ESO sub-mm Telescope (SEST) in August 2003. The 37-channel SEST imaging bolometer array (SIMBA, Nyman et al., 2001) was used to observe the continuum dust emission at 1.2 mm. The observations were performed in fast mapping mode, and maps were made of 400 by 500 in azimuth and elevation respectively. The atmospheric transparency was monitored by performing regular sky-dip measurements, the absolute flux calibration was established by observing Uranus. In total, six maps of HD 142527 were made, and the source was clearly detected in all of them. We determine the flux of HD 142527 at 1.2 mm to be 1.120.02 Jy.
| Name | Peak flux [mJy] | ||
|---|---|---|---|
| Uranus | 7.04 | - | - |
| IRSV 1540 | 10.8 | 15h 44m 39 90 | -54∘ 23 044 |
| HD 142527 | 43.15.4 | 15h 56m 41 87 | -42∘ 19 235 |
3.2 ATCA
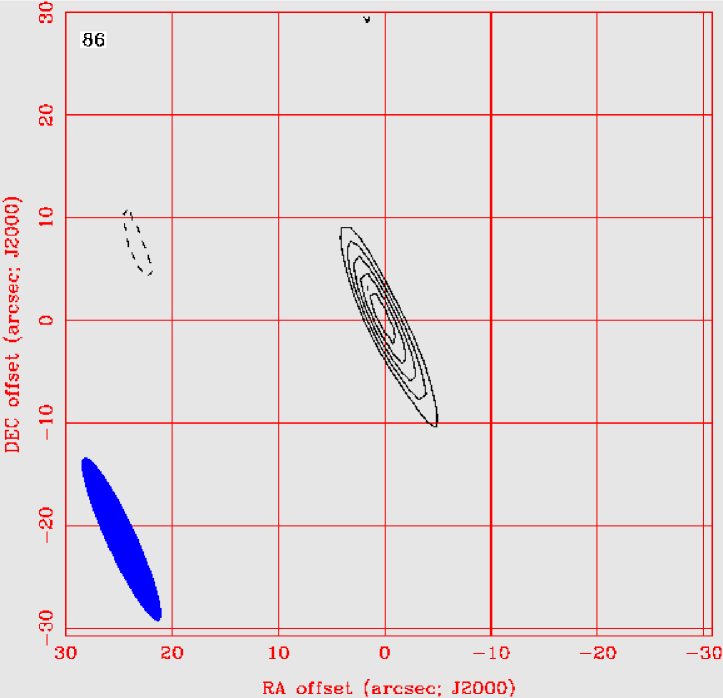
Observations at 3.476 mm were obtained with the Australia Telescope Compact Array (ATCA) on the night of June 11, 2002 in the east-west 352 m configuration using a bandwidth of 2.3 mm (see table 2). Only three antennae out of the six in the full array were available (numbers 2, 3, and 4). The resolution was 16.2 by 2.9. Observations on the target source were interleaved with observations of the bright, nearby maser source, IRSV 1540, as a phase-reference calibrator, with a cycle of two minutes on the phase-reference followed by five minutes on the target. Every half hour observations were made and every hour a new pointing solution derived using the phase-reference. The data reduction was completed using the MIRIAD data reduction package (Sault et al. 1995). The absolute flux scale and bandpass were calibrated using an observation of Uranus. The flux of Uranus was determined to be 7.0 Jy. From the variance in flux over time of the sources IRSV 1540 and 1057-797, the flux scale appears to be constant to within 10%. The measured central position matches the optical position of HD 142525 to a sub-arcsecond precision. Fitting a Gaussian to the source shown in Fig. 1 suggests that the source is marginally resolved, but the visibility data are too noisy to obtain a size estimate. The derived peak flux is 43.15.4 mJy with a spatially integrated flux of 47.16.5 mJy. This last number was previously quoted by Acke et al. (2004)333In that paper the wavelength of the ATCA data-point was incorrectly stated as 2.9 mm. as unpublished.
| Target | Filter | Chop | Time | Airmass | Seeing | Int.time | |
|---|---|---|---|---|---|---|---|
| [m] | [] | [h:m] | [] | [s] | |||
| HD 139127 | SiC | 11.85 | 9 | 05:07 | 1.07 | 0.83 | 110 |
| HD 142527 | SiC | 11.85 | 10 | 05:18 | 1.07 | 0.83 | 354 |
| HD 186791 | SiC | 11.85 | 9 | 10:07 | 1.22 | 0.77 | 110 |
| HD 142527 | Q2 | 18.72 | 8 | 02:21 | 1.05 | 0.82 | 680 |
| HD 142527 | Q2 | 18.72 | 8 | 02:37 | 1.06 | 0.75 | 680 |
| HD 139127 | Q2 | 18.72 | 9 | 02:57 | 1.09 | 0.72 | 338 |
3.3 VISIR imaging
During the nights of April 28 and June 30, 2005 N and Q-band imaging of HD 142527 was performed with VISIR, the VLT Imager and Spectrometer for mid-IR (Lagage et al. 2004). The observations were obtained in visitor mode under the VISIR GTO program on circumstellar disks. The chosen filters were the SiC and Q2, which have central wavelengths at 11.85 and 18.72 m and half-band widths of 2.34 and 0.88 m respectively. Standard chopping and nodding was applied (at 0.25 and 0.033 Hz) to suppress the dominating atmospheric background emission. All the imaging data were obtained using a pixel scale of 0.075. The observing conditions during both nights were good: the airmass was below 1.1 and the optical seeing was around 0.8. For the imaging in the SiC filter the standard stars HD 139127 (12.75 Jy) and HD 186791 (57 Jy) were bracketing the science observation and were used to estimate the photometry and the associated errors. The achieved sensitivity was estimated to be 10 mJy/10 1h averaged over the two reference stars. For the imaging in the Q2 filter the reference star, HD 139127 (4.95 Jy), was used for PSF and photometric purposes. It was selected from the database of VISIR standard stars based on the flux level and distance to the science target on the sky. The achieved sensitivity was estimated to be 70 mJy/10 1h in the Q2 filter. Table 3 summarizes the observational details. For the reduction of the data we used a dedicated pipeline, which corrects for various instrumental signatures (see Pantin et al. 2008, 2009; Pantin 2010).
| Target | R | Orient. | Time | Airmass | Seeing | Int.time | |
| [m] | [∘] | [h:m] | [] | [s] | |||
| HD 142527 | LR | 8.8 | 0 | 05:58 | 1.05 | 0.76 | 644 |
| HD 142527 | LR | 9.8 | 0 | 06:13 | 1.05 | 0.76 | 644 |
| HD 139127 | LR | 8.8 | 0 | 06:38 | 1.07 | 0.67 | 91 |
| HD 139127 | LR | 9.8 | 0 | 06:42 | 1.07 | 0.60 | 91 |
| HD 139127 | LR | 11.4 | 0 | 06:45 | 1.07 | 0.61 | 91 |
| HD 142527 | LR | 11.4 | 0 | 07:01 | 1.07 | 0.67 | 644 |
| HD 142527 | LR | 12.4 | 0 | 07:17 | 1.09 | 0.67 | 517 |
| HD 139127 | LR | 12.4 | 0 | 07:40 | 1.14 | 0.73 | 97 |
| HD 142527 | MR | 18.18 | 113 | 03:10 | 1.11 | 1.19 | 1846 |
| HD 142527 | MR | 17.82 | 113 | 03:52 | 1.18 | 1.40 | 1846 |
| HD 148478 | MR | 18.18 | 0 | 05:17 | 1.25 | 0.86 | 159 |
| HD 148478 | MR | 17.82 | 0 | 05:23 | 1.27 | 0.83 | 159 |
3.4 VISIR spectroscopy
Long-slit spectra were taken with VISIR in the N-band and the Q-band. For both observations standard parallel chopping and nodding with a chopper throw of 8 was applied to correct for the atmospheric background. In table 4 we display the observational log.
The N-band spectrum was observed in the low-resolution mode (R300) on the night of April 27, 2005. The 0.4 slit was employed in a standard north-south orientation. The entire 10 m feature was covered in four separate settings. The observing conditions were favorable; the average airmass was 1.1 and the optical seeing was 0.7. The standard star HD 139127 was observed immediately before or after the science measurements for the correction of the atmospheric absorption. The N-band spectrum of HD 142527 was observed as part of a VISIR GTO program on circumstellar disks, in which the 10 m feature of a sample of 17 Herbig Ae stars was studied (Verhoeff et al., 2010).
The Q-band spectrum was observed in the medium-resolution mode (R3000) on the night of June 30, 2007. The 0.4 slit was employed in an inclined orientation with = 67∘. The 18 m forsterite feature was mapped in two runs centered on 17.82 m and 18.18 m. The observing conditions were fair; the average airmass was 1.1 and the optical seeing was 1.4. The standard star HD 148478 was observed directly after the science measurement for the correction of the atmospheric absorption.
The first steps of the data reduction are identical to the VISIR image reduction (see Sect. 3.3). The resulting reduced spectral images contain the two-dimensional spectra in counts/s. These images were corrected for slit curvature and optical distortions. The spectra were extracted using the optimal extraction technique of Horne (1986). The wavelength calibration was performed by correlating an ALTRAN/HITRAN model with the simultaneously measured sky spectra. See Pantin (2010) for a more detailed description of the reduction process.
The N-band and Q-band spectrum were corrected for atmospheric extinction using one standard star and a simple correction for the airmass difference. The formalism is defined as
| (1) |
where and are the observed counts of the calibration and the science measurements, and are the airmass of the measurements, and and are the Cohen et al. (1999) model of the calibrator and the resulting spectrum.
| Band | [m] | F [Jy] | Reference |
|---|---|---|---|
| Johnson U | 0.36 | 0.340.01 | M98 |
| Johnson B | 0.44 | 1.120.01 | M98 |
| Johnson V | 0.55 | 1.840.02 | M98 |
| Near-IR J | 1.23 | 3.80.1 | M98 |
| Near-IR H | 1.65 | 4.60.1 | M98 |
| Near-IR K | 2.22 | 5.60.1 | M98 |
| Near-IR L | 3.77 | 7.40.3 | M98 |
| Near-IR M | 4.78 | 6.70.3 | M98 |
| SiC | 11.85 | 8.80.6 | V10 |
| IRAS 12 | 11.80 | 104 | B88 |
| Q2 | 18.72 | 14.61.5 | V10 |
| IRAS 25 | 24.38 | 215 | B88 |
| IRAS 60 | 58.61 | 10512 | B88 |
| IRAS 100 | 100.9 | 84.716 | B88 |
| CSO 0.8 | 800 | 4.20.5 | W95 |
| SEST 1.2 | 1200 | 1.120.02 | V10 |
| CSO 1.3 | 1300 | 1.190.03 | W95 |
| ATCA 3.5 | 3476 | 0.0470.006 | V10 |
3.5 Additional data
A low-resolution Spitzer-IRS spectrum of HD 142527 was taken from Juhász et al. (2010). The ISO spectrum was taken from Dominik et al. (2003). N-band interferometric visibilities observed with MIDI were taken from van Boekel et al. (2004a). Photometric data points were taken from the literature and are listed in table 5. The optical photometry of Malfait et al. (1998) were converted to the standard Johnson UBV system using the transformations of Rufener & Nicolet (1988). The Subaru/Comics 24.5 m image was taken from Fujiwara et al. (2006) and the TIMMI2 N-band spectrum from van Boekel et al. (2004b).
4 Analysis of the millimeter data
The two measurements at 1.2 and 3.5 mm together with two more measurements at 0.8 and 1.3 mm from the literature (see table 5) give us an opacity index (). Assuming the four data-points are in the Rayleigh-Jeans limit of the SED (), we obtain . Compared with other HAeBe stars this value is higher than average. Natta et al. (2007) find that computed over the wavelength interval 1.3-7 mm, the opacity index is for about 60% of the objects. Acke et al. (2004) determined the spectral index in observations from 0.35 to 2.7 mm and found an average of = 0.6 for 13 group I sources. At mm wavelengths the SED is thus steeper than that of most HAeBe stars. Considering that = 1.7 for the ISM (Weingartner & Draine 2001) and assuming an optically thin disk at millimeter wavelengths, we can conclude that the dust around HD 142527 has evolved, but that the average grain-size is relatively small compared with most HAeBe stars.
From the 1.2 mm observation, we can derive a dust mass using the formalism of Hildebrand (1983) for an optically thin cloud
| (2) |
with the grain radius and the grain density, the emissivity, and the distance to the star. Considering the emissivity per unit dust mass = , taking (250 m) = 10 cm2 g-1 from Hildebrand (1983) and extrapolating with = 1.0 we obtain (1.2 mm) = 2 cm2 g-1, which is commonly used in the literature and should be correct within a factor of 4 (see e.g. Beckwith et al. 1990). We assume an average dust temperature of = 40 K, which is not a large source of uncertainty, because in the Rayleigh-Jeans limit the derived mass scales inversely proportional with the temperature. Using the distance of = 145 pc, we calculate a total dust mass in small grains of = M⊙. This value is consistent with the model we present in Sect. 7.
5 VISIR imaging analysis
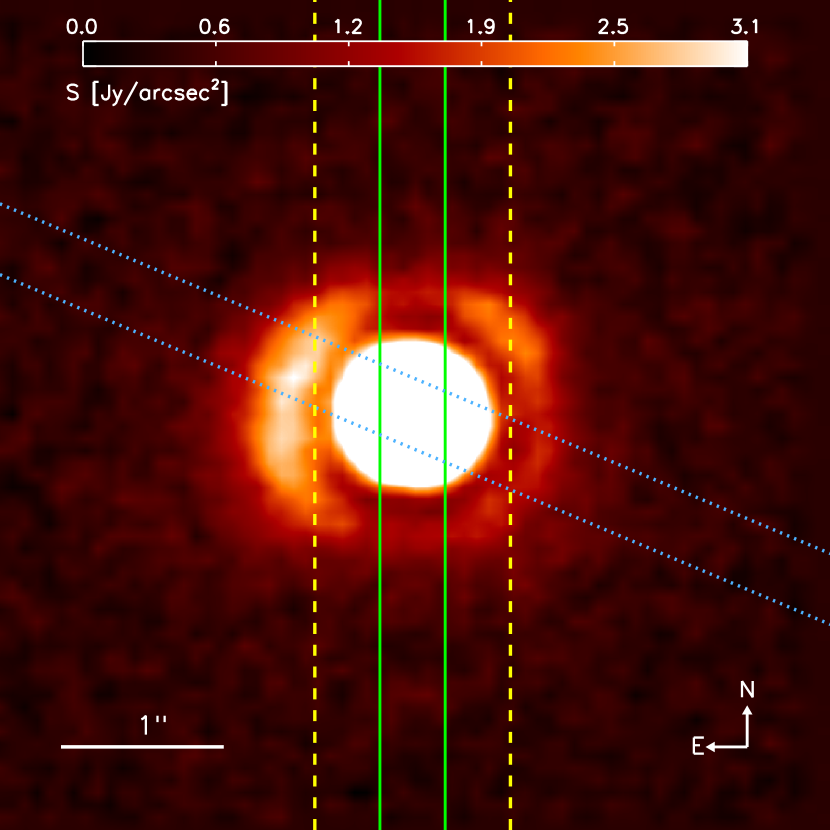
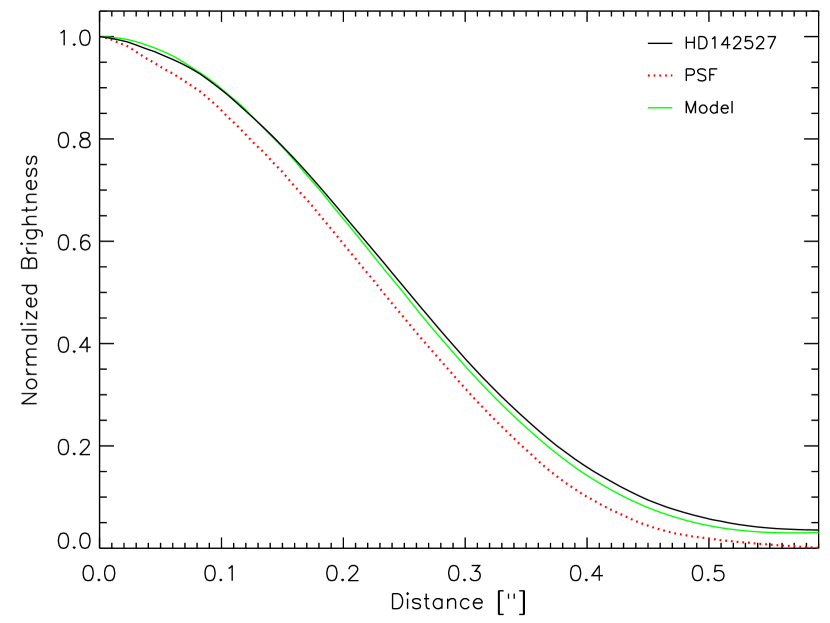
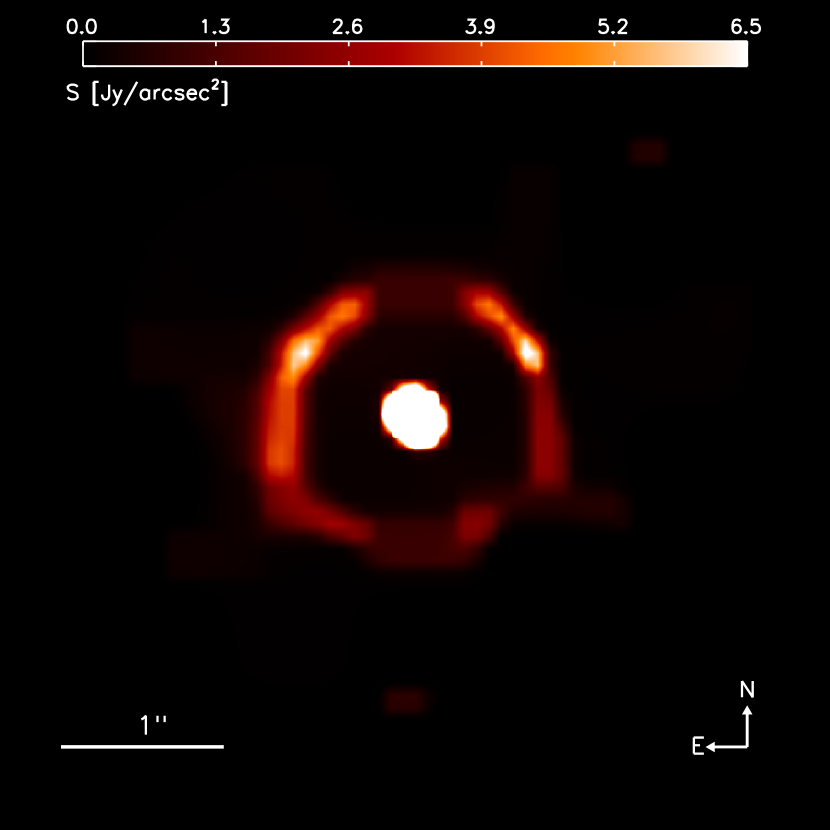
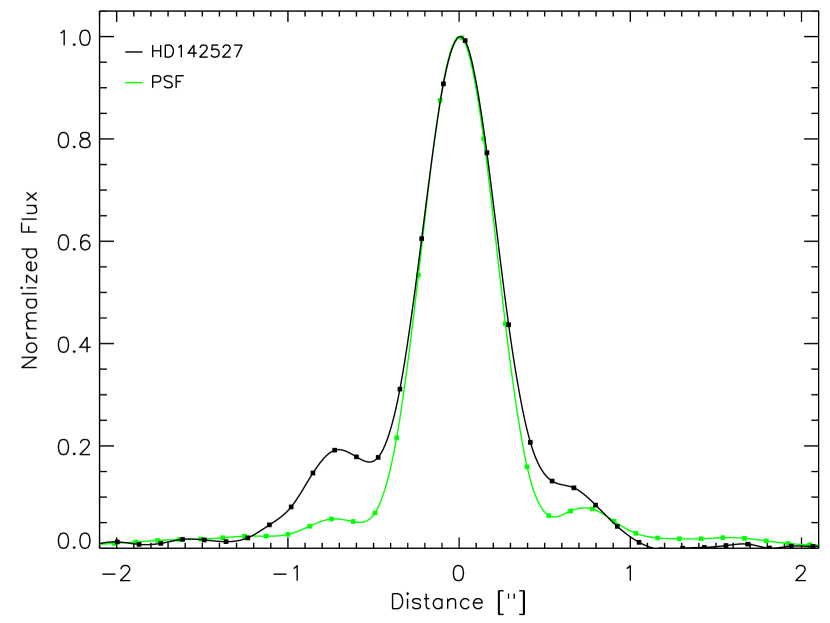
The photometric analysis yields integrated fluxes for HD 142527 of 8.80.6 Jy and 14.61.5 Jy in the SiC (11.85 m, spectral resolution R = 5) and Q2 (18.72 m, R = 20) filters respectively. Because the emission of the star is negligible at these wavelengths, these fluxes can be attributed to the circumstellar disk. We searched for extended emission components at both wavelengths with a central component subtraction technique at a sub-pixel (1/10) precision level. The PSF in both filters was derived from the observation of standard stars just before or after HD 142527. In the SiC filter, no visible extension is detected. This constrains the angular extent of the central component to 0.35 in FWHM (50 AU at 145 pc). In the Q-band, extended emission is clearly detected. A visual inspection of the observed image in Fig. 2 demonstrates that the emission is divided between a compact central component and an extended region. We find that the emission in the central component is also marginally spatially resolved (see Fig. 3). A quadratic subtraction of the PSF leads to a FWHM of the spatial emission profile of 0.210.04, which corresponds to 30 AU at a distance of 145 pc.
The extended component that is visible after central component
subtraction (figure 4) has an elliptical shape. An
ellipse fitting of the outer boundary isophotes indicates a position
angle of 11020∘ and an aspect ratio of 1.3 (i =
4020∘ from face-on). The integrated flux in the
residuals after central component subtraction is 2.90.5 Jy and
the integrated flux of the subtracted central source is
11.11.1 Jy. However, the method used here of separating the
photometry of the central component and the extended region is not
very accurate, because their flux was mixed in the observation process
by the PSF. In Sect. 5.2 we present results of a more
precise deconvolution method.
5.1 Comparison with previous Q-band imaging
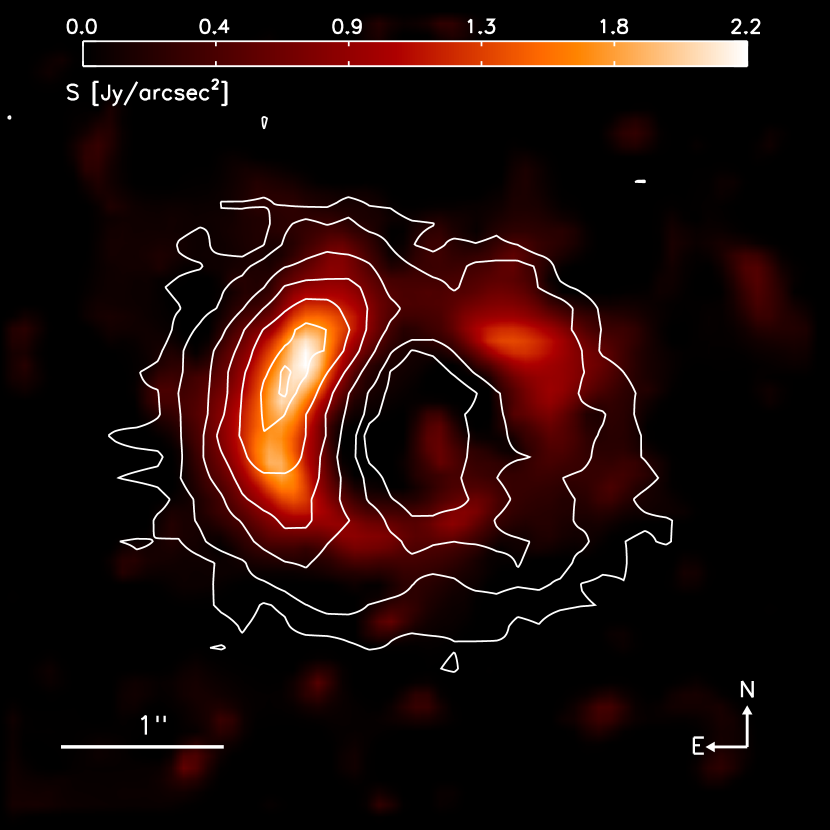
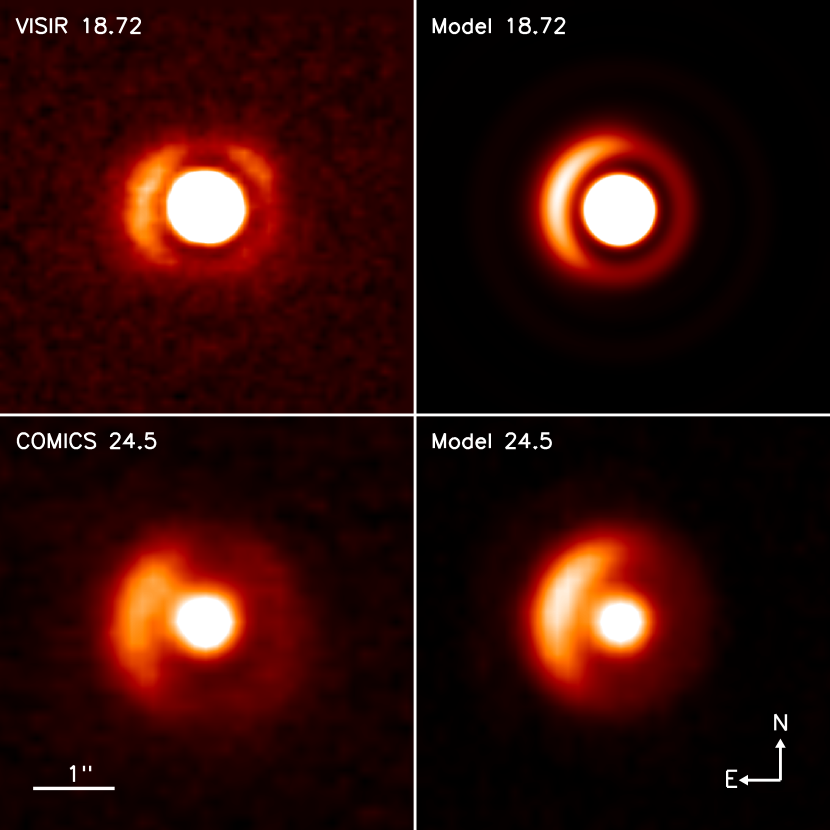
We compared our VISIR 18.72 m image with the SUBARU/COMICS 24.5 m image of Fujiwara et al. (2006), applying the same central component subtraction technique as described above. In Fig. 4 we overplotted the central component-subtracted COMICS image with white contours. It shows that the eastern emission peak shifts to the south when going from 18.72 to 24.5 m. This cannot be explained with a disk inclination or with flaring of the disk and is therefore an indication of azimuthal dust opacity variation, which must be linked to an azimuthal density variations. We will return to this point in Sect. 8.4.
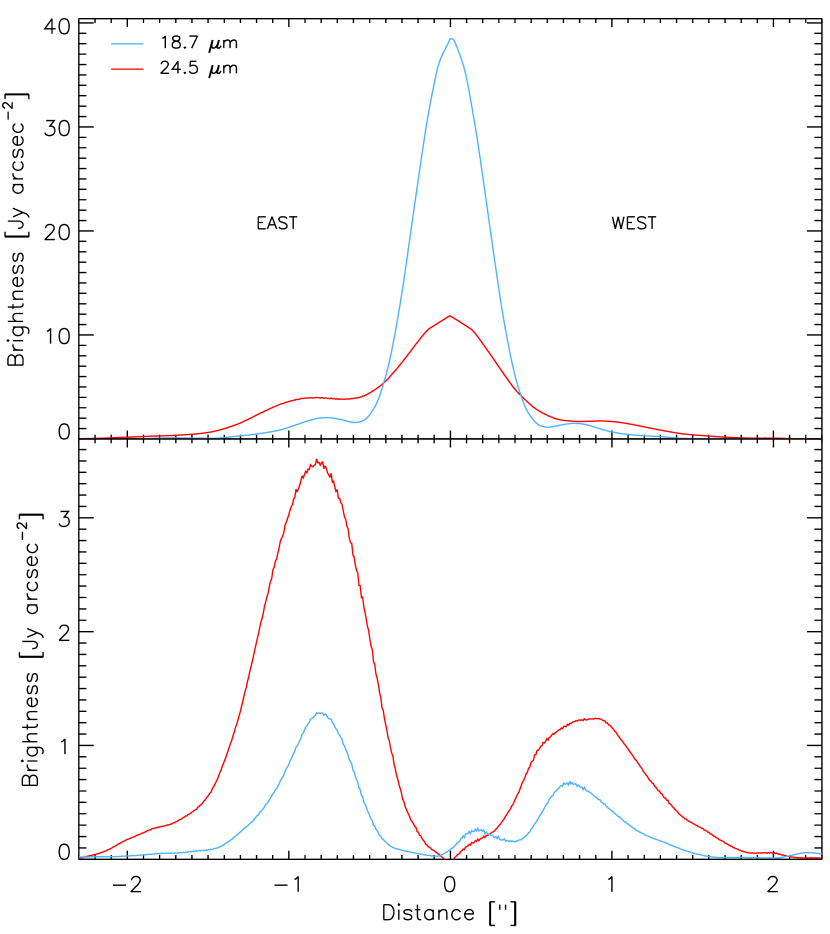
We also analyzed the mean surface brightness as a function of distance from the star. In Fig. 5 we plot these spatial profiles for our VISIR image and for the COMICS image. The position of the star was assumed to coincide with the locus of the emission optimum, which was derived to an accuracy of a tenth of a VISIR pixel with a two dimensional Gaussian fit. Following the same analysis approach as in Fujiwara et al. (2006), we treated the eastern and western components separately: the eastern profile was averaged over the = 0-180∘ and the western profile was averaged over the = 180-360∘. The observed profiles in the top panel show that the flux ratio of substantially decreases from the inner to the outer region. The bottom panel shows that the COMICS image is more extended. These features are consistent with a radially decreasing dust temperature.
5.2 Deconvolution
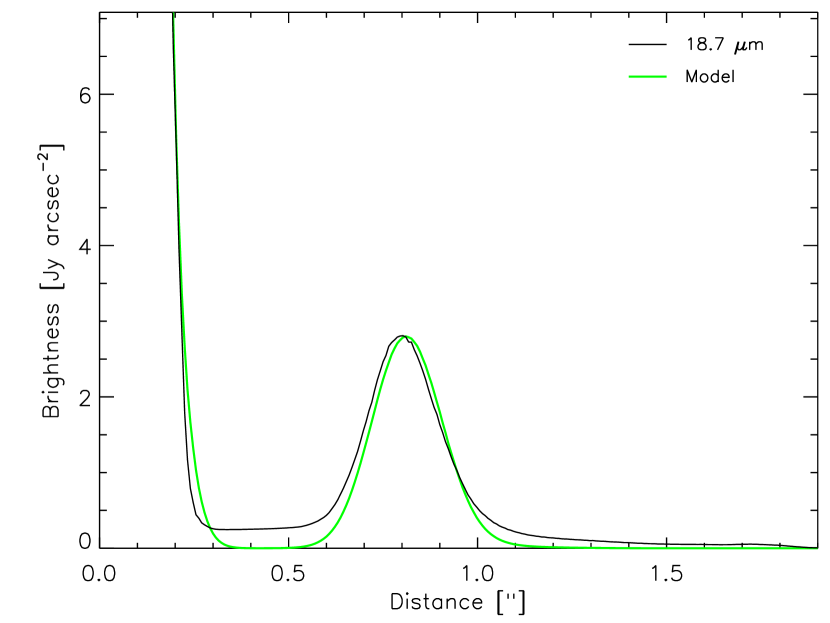
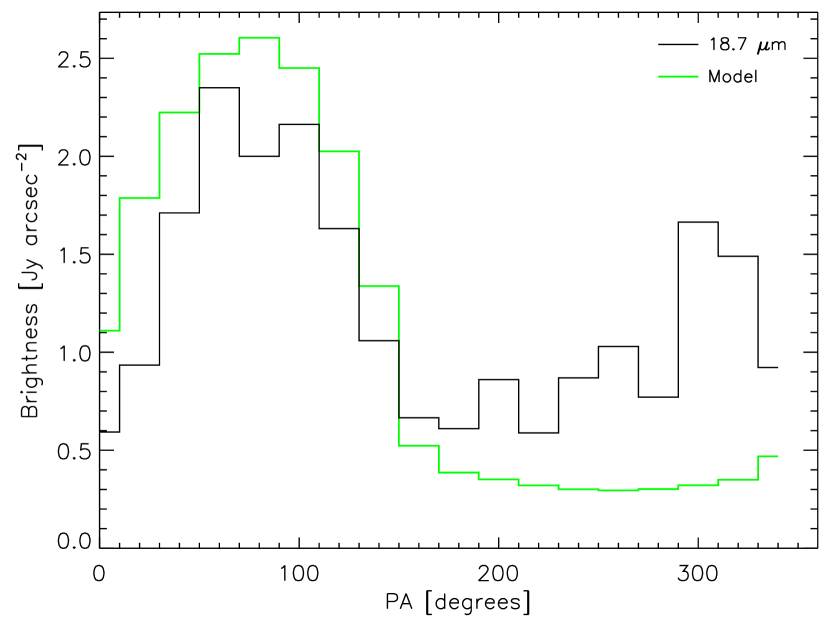
A more precise method to separate the central and outer emission components is to deconvolve the image. We deconvolved the Q2 image with the MEM-multi-resolution method (Pantin & Starck 1996) and obtained the image shown in Fig. 6. The spatial resolution in the deconvolved image was limited to 0.1, which is on the order of the Shannon limit imposed by the spatial sampling. At that resolution the image is composed of two components. The central component is marginally resolved (FWHM of 0.15) and has an integrated flux of 10.84 Jy. The second component, located farther away at a distance of 0.8, has a narrow ring-like shape. The ridge drawn by the maximum of emission in the ring can be fitted by an ellipse with an aspect ratio of 1.2 ( = 2010∘ from face-on) and a position angle of = 12020∘. These numbers are slightly different from those obtained from the central component-subtracted image. We will return to this in Sect. 7.5. The emission ring has a mean distance to the star (measured on the semi-major axis) of 0.8 (130 AU) and a FWHM of 0.2 (30 AU, see Fig. 7). Figure 7 displays the mean radial profile of the deconvolved image, obtained by averaging the emission over 360∘. The surface brightness as a function of azimuth averaged over the radii from 0.5 to 1.1 has minima of 0.6 Jy/arcsec2 at , 180∘, and 230∘ and a maxima of 2.4 Jy/arcsec2 at = 60∘ and 1.7 Jy/arcsec2 at = 300∘(see Fig. 8).
6 VISIR spectroscopy analysis
6.1 N-band
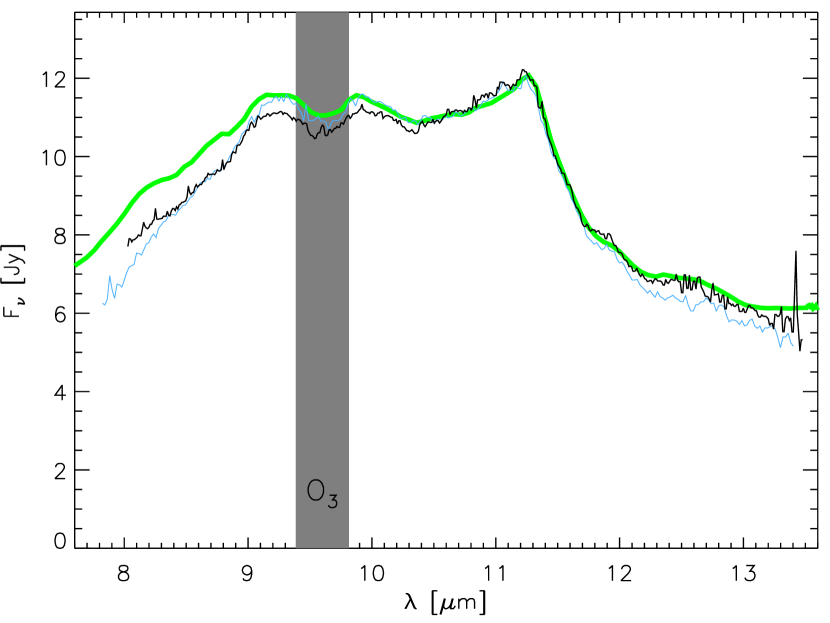
To achieve a continuous VISIR low-resolution N-band spectrum, we spliced the four wavelengths settings together. We scaled them with the ratio of the median values of the overlapping regions. The flux of the spectrum was then scaled to the flux of the Spitzer spectrum at 10.6 m with an average factor of 1.24. We present the resulting spectrum in Fig. 9. We also plotted the Spitzer and TIMMI2 spectra for comparison. The excess at the blue end of the Spitzer spectrum is suggestive of extended low surface brightness PAH emission. Although there is no direct observational evidence in our data, this extended emission could be linked to the components visible at 18.72 and 24.5 m that largely fall outside the VISIR and TIMMI2 slits (see Fig. 2). The small differences at 9.2, 10.0 and at 12.6 m are not well understood.
6.2 Q-band
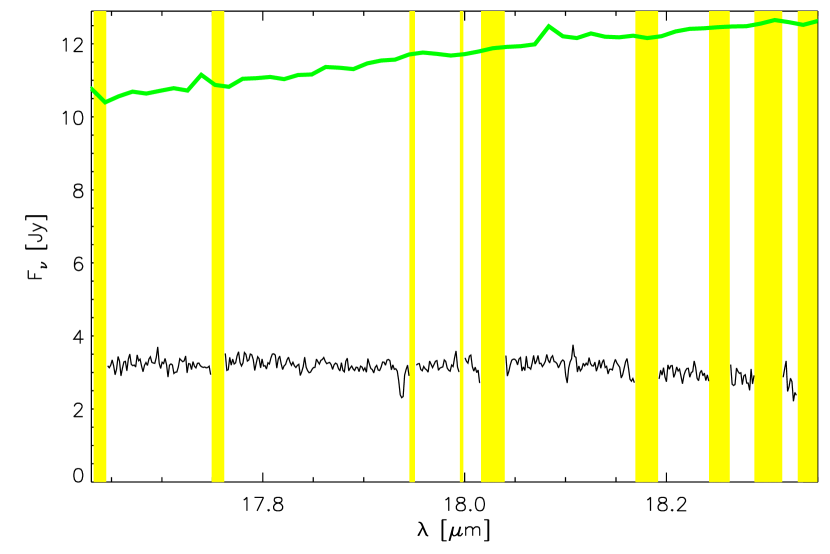
Figure 2 shows the chosen slit orientation of the VISIR medium-resolution Q-band spectrum. The spectrum contains a contribution from the central component and a contribution from the eastern component. In Fig. 10 we plot the integrated spectrum. The spectral setting centered on 18.18 m has been scaled by a factor 1.15 to continuously connect to the spectral setting centered on 17.82 m. The wavelength regions where the atmospheric transmission as measured with the standard star is less than 30% of the maximum are masked out with yellow bands. We overplotted in thick green the Spitzer spectrum, which shows a significant difference in slope compared with the VISIR spectrum. The bluer slope of the VISIR spectrum is in accordance with expectations, because the VISIR slit has selected the inner, hotter parts of the disk, while the Spitzer spectrum covers the entire disk, including all colder outer parts.
The chosen slit orientation allows us to spatially separate the spectra of the central and eastern components. This is illustrated in Fig. 11, where we plotted the spatial profile of the spectral section centered on 17.82 m after a collapse of the wavelength dimension. In green we overplotted the calibrator. The eastern (left) and western (right) components are both significantly detected. Even the central component seems to be marginally resolved, although the statistics are poor. We also extracted from the 2D spectral image two five pixel wide traces centered on the central emission and the eastern peak respectively. Their ratio showed no reliable spectral structures.
7 Modeling
To better understand the circumstellar matter around HD 142527 we created a detailed geometric model that is capable of reproducing the described observations. We begin by explaining the principles of the model, the basic assumptions, and the setup. Then we constrain the free parameters and construct the final best-fit model using radiative transfer calculations and the observations. This final model is tuned to accurately fit the SED, the Spitzer and ISO IR spectra, and the general features of the IR images of the star. We conclude our modeling effort with a discussion of the discrepancies between the simulated and observed data.
7.1 Model basics and setup
Our model consists of an axisymmetric structure that surrounds a single star. This structure is defined by its density distribution, composition, inclination, position angle, and inner and outer radius. We use the Monte Carlo radiative transfer code MCMax (Min et al., 2009) to obtain a corresponding temperature distribution and simulated observables. To constrain the model parameters we start with a basic setup which is refined after the radiative transfer calculation and comparison of simulated data with observables. In the radiative transfer calculation we only take the flux from the central star into account. Possible heating by viscous processes in the disk can be ignored because the mass accretion rate of the disk is negligible.
For the basic setup of the surface density of the disk we use a simple power law
| (3) |
where denotes the distance to the central star, the exponent is set to the commonly used value -1 (see e.g. Dullemond et al. 2006), and the scaling factor, , determines the mass of the disk. It is clear from the images (Figs. 4 and 6) that the surface density of the disk is not continuous. We therefore split the disk into an inner and an outer disk separated by a gap. The structure of the two regions is treated separately.
The vertical density distribution of the disk is solved by iterating the density and temperature structures until they are self-consistent under the assumption of hydrostatic equilibrium (see e.g. Dullemond et al. 2007). Very small grains couple well to the gas and thus follow this hydrostatic equilibrium density distribution. However, larger grains may partly decouple from the gas and settle towards the midplane of the disk through gravitation. To simulate this we added an extra parameter that scales the height of the dust in the disk (; see Ratzka et al. 2007; or Acke et al. 2009). For values of lower than unity, this can be interpreted as a settling of the grains to the midplane, hence we refer to this as the sedimentation parameter.
We fixed the composition and the grain size and shape distribution of the silicate component of the dust of the inner disk to be equal to that obtained by van Boekel et al. (2005). In that paper the continuum flux was represented by emission from a single blackbody, which is sufficient for modeling the 10 m feature. Here, we use a continuum opacity in the form of amorphous carbon grains with a variable abundance to improve the fitting accuracy in the optical and millimeter regimes. For the shape of the carbon grains, we used the distribution of hollow spheres (DHS; see Min et al. 2005), and for the refractive index we used the data by Preibisch et al. (1993). The continuum component could also be reproduced by small grains of metallic iron and/or iron sulfide, as well as large grains of various dust species. However, this will have no great influence on the modeled geometry. For the outer disk we used the same basic compositional setup except for the addition of small water-ice grains. This is motivated by the clear water-ice feature around 45 m as seen in the ISO spectrum.
We assume that all types of dust species in the disk have the same temperature as the gas. This can be taken to mean that the different species are in thermal contact. To simulate the presence of composite grain-like ice-mantles on silicate and carbon grains we simply added the opacities of the individual species. It would of course be physically more realistic to take the interactions of the different components in the composite grain into account (see e.g. Min et al., 2008), which would likely lead to a slightly different best-fit composition and grain size distribution. However, for understanding the geometrical characteristics and the general composition of the disk, the simple approach suffices.
The prime puzzle of HD 142527 is its extremely large flux in the far-IR. The wavelength-integrated flux in the IR regime is almost equal to the integrated flux from the star (). Any successful disk model will first and foremost need to explain this remarkable observation. Secondly, the peculiar spatial distribution of the IR emission as seen at 18.72 and 24.5 m will need to be reproduced and the mid-IR interferometric visibilities have to be matched as well. Below we discuss several options to correctly model the SED and show how we arrived at our final best-fit model using the IR images and mid-IR interferometric constraints.
7.2 Structure of the outer disk
The central ingredient to obtain a high ratio is to move the bulk of the disk mass a large radial distance from the star where it can form a very high vertical wall and reprocess a large fraction of the stellar flux (see e.g. Deroo 2007). This can be understood in the following way. The fraction of the solid angle covered by the disk is approximately , where is the height of the optically thick disk over the midplane and is the distance from the star. can be written as the pressure scale height times an approximate constant (Chiang & Goldreich 1997). The standard disk theory shows that where is the isothermal sound speed at temperature , with being the mean molecular weight. is the local Kepler frequency. The temperature of a freely irradiated wall decreases as a function of distance with , so and . This means that the larger the distance from the star, the higher and will be.
We find that a gap extending to 130 AU will allow the disk wall to rise high enough to account for most of the IR excess. The inclination and position angle of the disk were constrained by fitting the IR images and their radial surface brightness profiles (Figs. 3, 4, 6, 7, and 12). The arc-like structures are well reproduced by the radiation from the inner edge of an inclined outer disk (see Fig. 13). The outer radius was constrained by fine-tuning the fit to the narrow bump around 40 m in the SED (see Fig. 14). The disk mass was constrained by fine-tuning the fit of the flux level of the SED fit in the millimeter regimes. We note that for the necessary scale height of the outer disk to be achieved in a natural way, it is important that the stellar radiation reaches it largely unhindered. As we will see, combined with other observations, this poses significant constraints on the structure of the dust close to the star.
| Parameter | Inner disk | Halo | Outer disk |
|---|---|---|---|
| Inner radius ( [AU]) | |||
| Outer radius ( [AU]) | |||
| Inclination () | - | ||
| Position Angle () | - | ||
| Sedimentation par. () | - | ||
| Power law exponent () | -1 | -1 | -1 |
| Dust mass ( [M⊙]) | 2.510-9 | 1.310-10 | 1.010-3 |
| Silicate abundance [%] | 63 | 63 | 34 |
| Carbon abundance [%] | 37 | 37 | 20 |
| Ice abundance [%] | - | - | 45 |
| Grain size [m] | 0.1,1.5∗ | 0.1,1.5∗ | 2.5 |
| Crystallinity [%] | 23 | 23 | 0 |
7.3 Structure of the inner disk
The inner radius is constrained by fine-tuning the SED fit in the near-IR regime. For the vertical distribution of the material close to the star we consider two scenarios. In the first the material is confined in an optically thick disk and in the second the material is confined in an optically thin dust component with very large scale height.
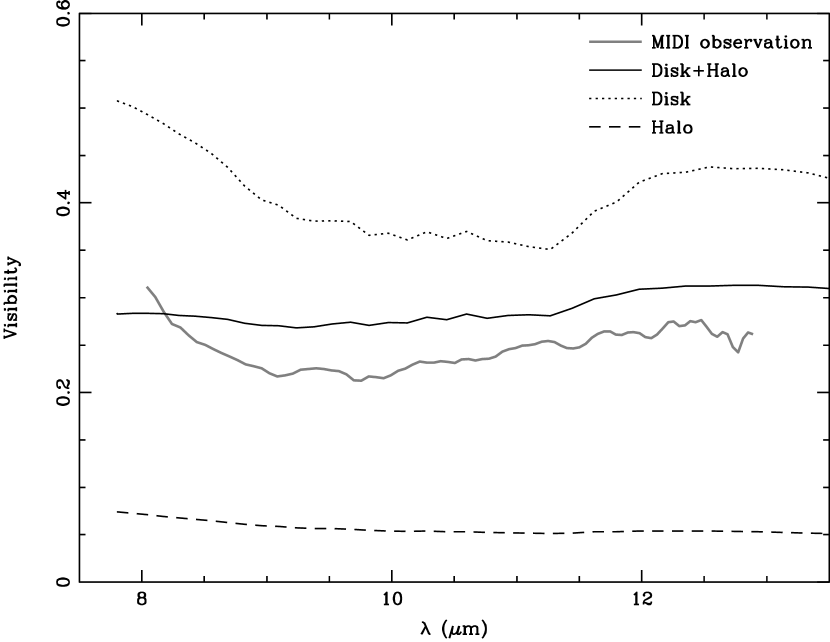
An optically thick inner disk? When we include a standard inner disk in the radiative transfer, the disk is strongly optically thick and casts a shadow on the outer disk. Furthermore, we need to artificially increase the scale height of this disk by roughly a factor of 3. While this produces the correct near-IR flux, it also casts a wide shadow onto the outer disk. The resulting loss of irradiated outer disk surface, and consequently the decrease in temperature, decreases the scale height and emission from the outer disk. To preserve the match with the observed mid- and far-IR flux, we would need to artificially increase the scale height of the outer disk as well, and that by a factor of over the self-consistent hydrostatic equilibrium value. A model like this has several shortcomings. First of all, there is no physically realistic explanation for the increased scale height of the outer disk over hydrostatic equilibrium, because this would require very high gas temperatures in the mid-plane, for which we have no justification. Second, the resulting model images are more axisymmetric than the observed IR images. And third, we compared the mid-IR visibilities obtained by van Boekel et al. (2004a) with MIDI with those obtained from this model and found that the model visibilities are a factor 1.5 too high (see Fig. 15). This means that the emission is too much peaked toward the center of the disk.
A halo-like component? As suggested by
Mulders et al. (2010), a way to avoid the extended
shadow on the outer disk is to put the material in the inner region
into an optically thin dust component, which extends to a very high altitude, for
example in a halo (Vinković et al. 2003, 2006).
Although halos have been the topic of much controversy, there are also other stars that
show some indication of optically thin material extending to a high altitude
in the inner disk (e.g. HD163209, Benisty et al. 2010).
We will discuss the possible origin of these halo-like structures in Sect. 8.2.
For our radiative transfer simulations, we modeled this component as a spherical
halo, but we do not mean to imply that it has to be
fully spherical in reality. Using an inner dust shell we can obtain a
very good fit to both the images and the SED. Because we kept the
composition and grain size distribution of the halo the same as for the
inner disk, the halo causes a measure of gray extinction at optical
wavelengths (). This means a slightly higher stellar
luminosity = 20 L⊙ is required than would be the case
when only taking the interstellar extinction into account. The resulting slight
decrease in scale height of the outer disk by a factor of 0.8 can be easily
understood in terms of settling of the grains toward the midplane. However, in order to
fit the spectral shape (i.e. the range of temperatures) of the
emission from the inner region, the powerlaw for the surface density
needs to be very flat (). This leads to
mid-IR visibilities that are a factor 4 lower than the observed
visibilities (see Fig. 15).
7.4 Final model
We saw that the optically thick inner disk or the halo-like component alone do not deliver a satisfactorily model. The solution is to combine a low-mass inner disk in hydrostatic equilibrium with an optically thin halo-like component of dust. This allows us to obtain a very good agreement for the SED, the IR images and the mid-IR visibilities.
We summarize our final best-fit model in Fig. 17 and table 6. We assume an axisymmetric disk that is slightly inclined. It has a settled inner disk, which extends from 0.3 to 30 AU, and a sedimentation parameter of . At 0.3 AU the disk has a vertical height of AU above the midplane (as traced by the radial =1 surface in the optical). The dust reaches a temperature of 1600 K, which we deem acceptable. There is a small mass in an optically thin spherical halo between 0.3 AU and 30 AU. However, the outer radius of this halo is not well constrained by the observations. The outer disk starts at 130 AU. Vertically it was scaled to times the hydrostatic equilibrium height, which puts the vertical height of the disk wall at 60 AU (=1 surface). The inner region contains silicate dust with the same composition as obtained by van Boekel et al. (2005), and we used 37% carbonaceous grains to represent all continuum opacity sources. In order to correctly reproduce the wavelength position of the slope of the SED in the far-IR, we set the size of the grains in the outer disk to 2.5 m and used 20% carbonaceous grains. We also added 45% of crystalline water-ice to the dust-mixture of the outer disk to reproduce the observed 45 m ice feature.
7.5 Comparison of the model with the observations
The disk model described above is capable to generally reproduce the various observations. We are confident that the small discrepancies between observational and modeling results reflect details in the geometry and/or mineralogy that will not strongly affect the emerging general picture of the system. Here we list the comparison and discrepancies.
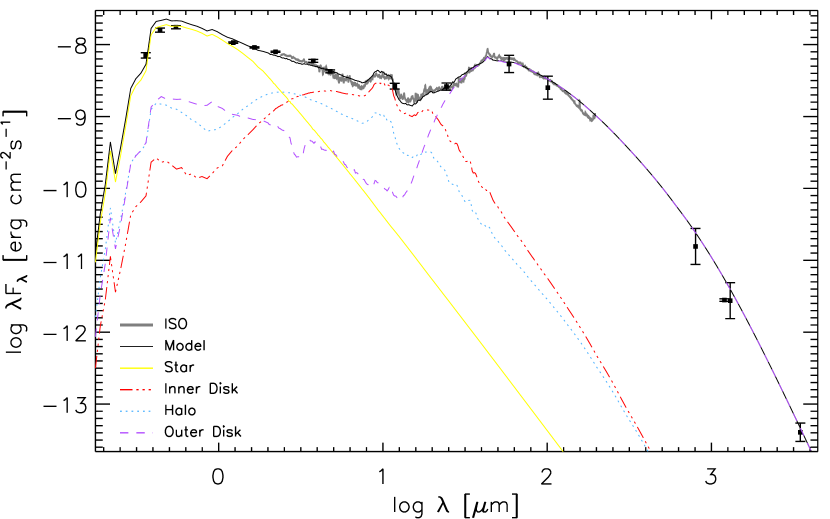
Photometry. The fit to the literature photometry and ISO spectrum is presented in Fig. 14. The flux level and general slope of the photometry, as well as the features of the ISO spectrum are reproduced. The model overestimates the long wavelength part of the ISO spectrum by about 20%.
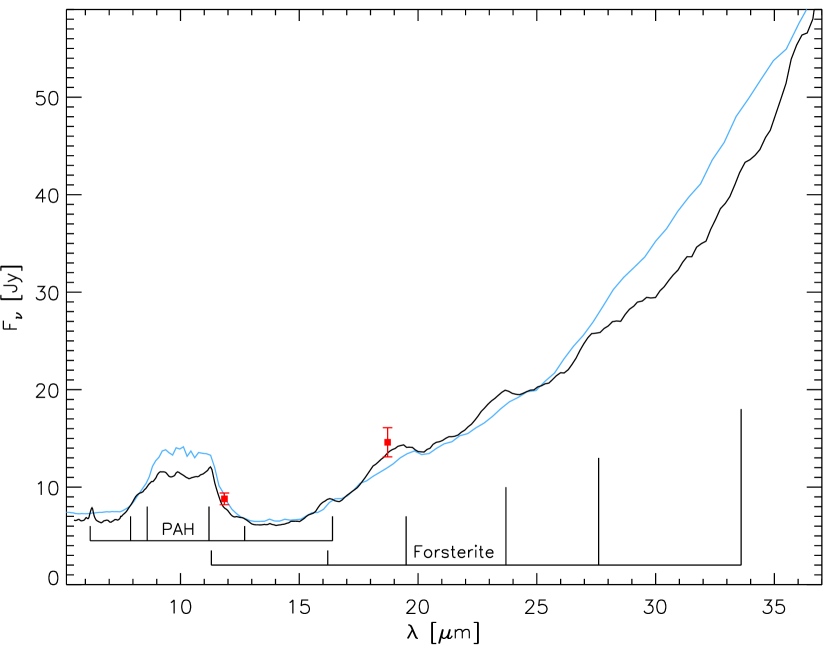
Spitzer. The fit to the Spitzer spectrum is presented in Fig. 16. The flux level and general shape are reproduced, but the 10 m feature is overestimated by about 10%. The forsterite features at longer wavelengths are underestimated because we did not include small crystalline grains in the outer disk.
MIDI. In Fig. 15 the MIDI visibilities were compared with the different models. Our final model reproduces the spatial scales probed by these MIDI visibilities. The differences are most likely caused by gradients in the crystallinity of the disk, which we did not take into account.
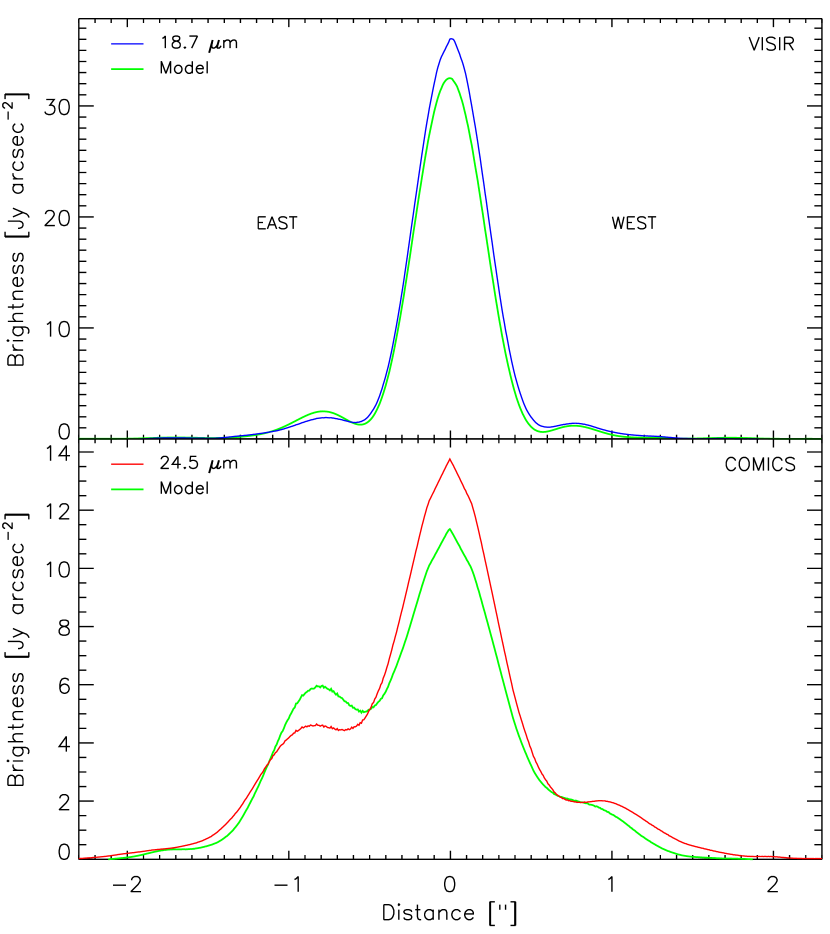
VISIR and COMICS. The modeled VISIR 18.72 m and COMICS 24.5 m images are compared with the observations in Fig. 13. The simulated images were obtained by taking the output of the model at the specified wavelengths and by convolving them with their associated PSF. The overall spatial distribution of the emission matches very well. In Fig. 3 we zoom in on the radial profile of the inner disk as seen in the VISIR image. In Fig. 12 we plot the radial profile of the mean surface brightness of the eastern and western sides of the images. There is a slight discrepancy in the flux ratio of the eastern lobe over the central component of the COMICS image.
VISIR deconvolved. Figure 7 shows the radial profile of the mean surface brightness of the deconvolved VISIR image. To model the deconvolved image we convolved the model output at 18.72 m with a 2D Gaussian with a FWHM of 0.1. This way we mimicked the obtained resolution of the deconvolved image. The fit is quite excellent, although the emission in the gap is not reproduced. This likely indicates that some dust is present in the gap. Figure 8 shows the azimuthal profile of the outer disk that results from the deconvolved image. The and the brightness of the eastern lobe are quite well reproduced, but the brightness peak at the western side of the outer disk is not reproduced. Furthermore, the image analysis gives a larger PA of the disk itself then the model does. These are indications that the density distribution and geometry of the outer disk are more complex than assumed by our model (compare with Fig. 12), we will return to this in Sect. 8.4.
8 Discussion
8.1 General picture
Our modeling effort shows that the circumstellar matter around HD 142527 consists of three geometrically distinct components, as depicted in Fig. 17. First, there is a small inner disk structure running from 0.3 to 30 AU, with a puffed up inner rim and a self-shadowed disk further out. Second, there is a small amount of dust in an optically thin component extending to extremely high altitude. The third component is a fairly massive outer disk, consisting of an extremely high wall at 130 AU, which is in hydrostatic equilibrium, and a self-shadowed outer part running up to 200 AU.
8.2 Inner disk and halo-like structure
In our model the inner disk and the halo-like structure together are responsible for the near-IR flux, the slightly resolved inner component of the VISIR image (see Fig. 3), most of the 10 m feature and the MIDI visibilities. The inner disk contains very little mass in small dust grains ( M⊙). One likely explanation is that all the material is already locked up in planetesimals or larger bodies. The degree of sedimentation of the dust compared with the gas ( = 0.4) seems to point at an advanced state of evolution as well. Expressed in the radial =1 surface in the optical, the height of the material at 0.3 AU reaches up to AU.
For the halo-like structure we estimated a dust mass of M⊙, which is one order of magnitude less than the inner disk. However, the halo-dust particles dominate the near-IR flux. The origin of the halo-like structure is not clear. It is generally expected that a dust halo decays naturally from stellar radiation pressure and gravity, therefore a mechanism is needed to replenish it. A possible replenishment scenario can be constructed with a dynamically highly excited debris disk. An attempt to model the effects of such a scenario is underway (Krijt & Dominik 2010, in prep.). An observational hint for this type of replenishment was already found by Malfait et al. (1998), who observed variable obscuration. There is also the possibility that some dust is entrained in the upper disk layers where gas and dust temperatures strongly differ (Woitke et al. 2009), and the vertical distribution of the gas is much more extended than in models like ours, where gas and dust are coupled everywhere (Thi et al. 2010). A third possibility may be a disk-wind carrying small dust grains.
8.3 Disk gap
Our analysis of the VISIR 18.72 m image and the modeling effort (see Fig. 7) demonstrate the presence of an extensive disk gap ranging from 30 to 130 AU, which is relatively void of small dust grains. One might speculate about the presence of one or more large Jupiter-mass planets in the gap that are responsible for the clearing of the material. In the light of recent findings this seems a very likely possibility. Marois et al. (2008) and Kalas et al. (2008) found Jupiter-like planets in wide orbits around young A-type stars with direct imaging. Lagrange et al. (2009) consider the presence of a Jupiter-like planet in the debris disk of Pictoris very likely. Furthermore, models of the solar nebula generally rely on an early formation of Jupiter, which then promotes the formation of the terrestrial planets (Pollack et al. 1996). This argument favors the presence of planetesimals or larger bodies in the inner disk (see Sect. 8.2).
To check whether photoevaporation could be responsible for the clearing of the gap we consulted Gorti & Hollenbach (2009), who describe the following scenario for the dispersal of a disk around a 1 M⊙ PMS star. In the outer regions of the disk FUV photoevaporation dominates accretion and the disk is expected to rapidly shrink to a truncation radius, 150 AU. Under favorable conditions a gap is created at 3-30 AU, after which the inner disk rapidly disappears on a viscous timescale of yr. The outer disk is subsequently rapidly eroded ( yr) from the inside out. The authors estimate disk lifetimes of 106 yr. Because the gap of HD 142527 is located at larger radii and there is still material in the inner disk, it is unlikely that photoevaporation is the dominant cause of the disk geometry.
8.4 Outer disk
The most distinct and curious aspect of the appearance of HD 142527 is its large IR excess (), which was noted by Dominik et al. (2003). We managed to self-consistently explain this flux level by invoking the presence of an extremely high wall of material at 130 AU which is in hydrostatic equilibrium. We found that the height of this material reaches up to 60 AU, as expressed in the radial =1 surface in the optical. This means that the outer disk covers 42% of the sky as seen from the star. It is this covering fraction that allows the disk to reprocess so much stellar light and emit IR radiation in two relatively small solid angles (2x29%). This wall is also the cause of the bright spot in the IR images. A frontal irradiation over almost the entire vertical surface is required in order for this wall to puff up the way it does. This is guaranteed by the small solid angle of the flattened inner disk (2%).
Further out the disk is self-shadowed and runs up to 200 AU. From our model we estimated the total dust mass in small grains in the outer disk to be M⊙, consistent with our simple analysis of the millimeter data (see Sec. 4). Assuming a gas-to-dust ratio of 100, the total disk mass is well below the gravitational instability limits (see e.g. Gammie 2001), but it is at the high end of the range in disk masses (10-3 to 10-1 M⊙) found for other Herbig stars by Acke et al. (2004).
The dust of the outer disk is also responsible for the scattering seen in the Subaru images of Fukagawa et al. (2006). The larger outer radius stated by these authors is likely caused in part by PSF smearing and in part by a very low-density dust component. This component does not contribute to our observations, so we did not take it into account. The cold dust of the outer disk is very processed, because it contains both crystalline ice (see also Malfait et al. 1999) and forsterite. Ohashi (2008) find convincing evidence for strong gas depletion on the basis of (3-2) emission, which is also an indication of advanced disk evolution.
The overall spatial brightness distribution was fairly well modeled, but from the overlay of the images at 18.72 and 24.5 m in Fig. 4 it is clear that the peak of the emission of the eastern lobe shifts to the south when going to longer wavelengths. This asymmetry cannot be explained with an axisymmetric density distribution; thus this is an indication of azimuthal variation in the density. Also, Figs. 6 and 13 show that there are some discrepancies between the observed images and the modeled images in the azimuthal direction. Previous modeling efforts of protoplanetary disks have made the existence of spiral density waves likely (see Durisen et al. 2007 for a review). It is possible that we are witnessing the signature of these waves here in HD 142527.
To add to the complexity of the geometry, the sub-millimeter mapping by Ohashi (2008) showed that the spatial distribution of the bulk of the material is in an arc-like structure enclosing the central star. Their image shows concentrations to the northeast and northwest and a surprising absence of material to the south. The similarity to our deconvolved 18.72 m is striking (see Fig. 6). From our azimuthal analysis we concluded that the emission maxima are actually at and (see Fig. 8). The resemblance that comes to mind is that of the Trojan asteroids of Jupiter, who reside in the two Lagrangian points of stability that lie 60∘ ahead and behind the planet’s orbit. This would imply the presence of a large planetary body 0.8 (120 AU) north of the star. Such a body could also cause the inner edge of the outer disk to have an eccentric shape. This could explain the discrepancy found in the PA of the disk between the modeling and the image analysis (Sect. 5.2). A modeling of the gravitational dynamics is called for to determine whether this configuration is physically possible and to constrain the exact orbital parameters and mass of such a body.
9 Conclusions
We presented an observational and modeling study of the circumstellar environment of HD 142527. The main conclusions of our work can be summarized as follows:
-
•
We obtained observations with SEST and ATCA, which pin the millimeter flux to the optical position of HD 142527. From the spectral slope in the millimeter we derived an opacity index of = 1.00.1, indicative of a relatively small grain size. From the SEST flux at 1.2 mm we derived a total dust mass in small grains of 1.010-3 M⊙.
-
•
Mid-infrared imaging of the disk surrounding HD 142527 using VISIR confirms the presence of a large gap extending from 30 to 130 AU. We find that the disk is unresolved in the 10 m window with no sign of emission from the outer disk. The emission in the VISIR 18.72 m image is dominated by the marginally resolved inner disk and by the inner rim of the outer disk. A comparison between VISIR 18.72 m and SUBARU 24.5 m imaging (Fujiwara et al., 2006) shows good agreement; the spatial scale of the emission increases with wavelength, which is consistent with an outward decreasing dust temperature.
-
•
We modeled the VISIR, SUBARU, MIDI, Spitzer, ISO and millimeter data with the MCMax radiative transfer code (Min et al., 2009). The large infrared excess can be understood with a self-consistent disk model with the following properties: (i) a geometrically flat inner disk running from 0.3 AU up to 30 AU, (ii) an optically thin halo-like component of dust in the inner disk regions, (iii) an extensive disk gap, and (iv) a massive outer disk running from 130 AU up to 200 AU. The inner rim of the outer disk is directly irradiated by the central star, which causes a huge scale-height (h = 60 AU). The derived mass in small dust grains is consistent with our millimeter analysis ( M⊙).
-
•
As a consequence of the gray extinction caused by the halo-like component we obtained new stellar parameters, including a stellar luminosity of L = 202 L⊙ and a stellar age of log t = 6.70.4 yr.
-
•
The deconvolved VISIR image shows azimuthal intensity variations that suggest a more complex structure of the outer disk than can be accounted for with our model. This suggests a non-axisymmetric distribution of material.
-
•
The presence of the halo-like component, the low mass in small grains and the high degree of sedimentation in the inner disk suggest the presence of planetesimals or larger bodies in the inner disk. The large disk gap, the highly processed nature of the grain population and the large mass of the outer disk suggest that planet formation is also on-going in the outer disk. HD 142527 is thus likely to evolve into a system similar to those recently found around young A-type stars (Marois et al., 2008; Kalas et al., 2008).
Acknowledgements.
This research was sponsored by NWO under grant number 614.000.411. Part of this work was supported by the German Deutsche Forschungsgemeinschaft, DFG project number Ts 17/2–1. M. Min acknowledges financial support from the Netherlands Organization for Scientific Research (NWO) through a Veni grant. E. Pantin acknowledges financial support from the Agence Nationale de la Recherche (ANR) of France through contract ANR-07-BLAN-0221. We gratefully acknowledge helpful discussions with A. Quillen.References
- Acke et al. (2009) Acke, B., Min, M., van den Ancker, M. E., et al. 2009, A&A, 502, L17
- Acke & van den Ancker (2004) Acke, B. & van den Ancker, M. E. 2004, A&A, 426, 151
- Acke et al. (2004) Acke, B., van den Ancker, M. E., Dullemond, C. P., van Boekel, R., & Waters, L. B. F. M. 2004, A&A, 422, 621
- Beckwith et al. (1990) Beckwith, S. V. W., Sargent, A. I., Chini, R. S., & Guesten, R. 1990, AJ, 99, 924
- Beichman et al. (1988) Beichman, C. A., Neugebauer, G., Habing, H. J., Clegg, P. E., & Chester, T. J., eds. 1988, Infrared astronomical satellite (IRAS) catalogs and atlases. Volume 1: Explanatory supplement, Vol. 1
- Benisty et al. (2010) Benisty, M., Natta, A., Isella, A., et al. 2010, A&A, 511, A74+
- Chiang & Goldreich (1997) Chiang, E. I. & Goldreich, P. 1997, ApJ, 490, 368
- Cohen et al. (1999) Cohen, M., Walker, R. G., Carter, B., et al. 1999, AJ, 117, 1864
- de Zeeuw et al. (1999) de Zeeuw, P. T., Hoogerwerf, R., de Bruijne, J. H. J., Brown, A. G. A., & Blaauw, A. 1999, AJ, 117, 354
- Deroo (2007) Deroo, P. 2007, PhD thesis, Institute for Astronomy, Catholic University Leuven, Celestijnenlaan 200D, B-3001 Leuven, Belgium
- Dominik et al. (2003) Dominik, C., Dullemond, C. P., Waters, L. B. F. M., & Walch, S. 2003, A&A, 398, 607
- Dullemond et al. (2006) Dullemond, C. P., Apai, D., & Walch, S. 2006, ApJ, 640, L67
- Dullemond et al. (2007) Dullemond, C. P., Hollenbach, D., Kamp, I., & D’Alessio, P. 2007, in Protostars and Planets V, ed. B. Reipurth, D. Jewitt, & K. Keil, 555–572
- Durisen et al. (2007) Durisen, R. H., Boss, A. P., Mayer, L., et al. 2007, in Protostars and Planets V, ed. B. Reipurth, D. Jewitt, & K. Keil, 607–622
- Fujiwara et al. (2006) Fujiwara, H., Honda, M., Kataza, H., et al. 2006, ApJ, 644, L133
- Fukagawa et al. (2006) Fukagawa, M., Tamura, M., Itoh, Y., et al. 2006, ApJ, 636, L153
- Gammie (2001) Gammie, C. F. 2001, ApJ, 553, 174
- Gorti & Hollenbach (2009) Gorti, U. & Hollenbach, D. 2009, ApJ, 690, 1539
- Henize (1976) Henize, K. G. 1976, ApJS, 30, 491
- Hildebrand (1983) Hildebrand, R. H. 1983, QJRAS, 24, 267
- Honda et al. (2009) Honda, M., Inoue, A. K., Fukagawa, M., et al. 2009, ApJ, 690, L110
- Horne (1986) Horne, K. 1986, PASP, 98, 609
- Houk (1978) Houk, N. 1978, Michigan catalogue of two-dimensional spectral types for the HD stars, ed. N. Houk
- Juhász et al. (2010) Juhász, A., Bouwman, J., Henning, T., et al. 2010, ApJ, 721, 431
- Kalas et al. (2008) Kalas, P., Graham, J. R., Chiang, E., et al. 2008, Science, 322, 1345
- Kurucz (1991) Kurucz, R. L. 1991, in Precision Photometry: Astrophysics of the Galaxy, ed. A. G. D. Philip, A. R. Upgren, & K. A. Janes, 27–+
- Lagage et al. (2004) Lagage, P. O., Pel, J. W., Authier, M., et al. 2004, The Messenger, 117, 12
- Lagrange et al. (2009) Lagrange, A.-M., Gratadour, D., Chauvin, G., et al. 2009, A&A, 493, L21
- Malfait et al. (1998) Malfait, K., Bogaert, E., & Waelkens, C. 1998, A&A, 331, 211
- Malfait et al. (1999) Malfait, K., Waelkens, C., Bouwman, J., de Koter, A., & Waters, L. B. F. M. 1999, A&A, 345, 181
- Marois et al. (2008) Marois, C., Macintosh, B., Barman, T., et al. 2008, Science, 322, 1348
- Meeus et al. (2001) Meeus, G., Waters, L. B. F. M., Bouwman, J., et al. 2001, A&A, 365, 476
- Min et al. (2009) Min, M., Dullemond, C. P., Dominik, C., de Koter, A., & Hovenier, J. W. 2009, A&A, 497, 155
- Min et al. (2005) Min, M., Hovenier, J. W., & de Koter, A. 2005, A&A, 432, 909
- Min et al. (2008) Min, M., Hovenier, J. W., Waters, L. B. F. M., & de Koter, A. 2008, A&A, 489, 135
- Mulders et al. (2010) Mulders, G. D., Dominik, C., & Min, M. 2010, A&A, 512, A11+
- Natta et al. (2007) Natta, A., Testi, L., Calvet, N., et al. 2007, in Protostars and Planets V, ed. B. Reipurth, D. Jewitt, & K. Keil, 767–781
- Nyman et al. (2001) Nyman, L.-Å., Lerner, M., Nielbock, M., et al. 2001, The Messenger, 106, 40
- Ohashi (2008) Ohashi, N. 2008, Ap&SS, 313, 101
- Pantin (2010) Pantin, E. 2010, to be published as Habilitation Diriger des Recherches (HDR) manuscript, Paris VII-Diderot University, http://tel.archives-ouvertes.fr
- Pantin et al. (2008) Pantin, E., Doucet, C., Käufl, H. U., et al. 2008, in Society of Photo-Optical Instrumentation Engineers (SPIE) Conference Series, Vol. 7014, Society of Photo-Optical Instrumentation Engineers (SPIE) Conference Series
- Pantin et al. (2009) Pantin, E., Siebenmorgen, R., Käufl, H. U., & Sterzik, M. 2009, in Science with the VLT in the ELT Era, ed. A. Moorwood, 261–+
- Pantin & Starck (1996) Pantin, E. & Starck, J.-L. 1996, A&AS, 118, 575
- Pollack et al. (1996) Pollack, J. B., Hubickyj, O., Bodenheimer, P., et al. 1996, Icarus, 124, 62
- Preibisch et al. (1993) Preibisch, T., Ossenkopf, V., Yorke, H. W., & Henning, T. 1993, A&A, 279, 577
- Ratzka et al. (2007) Ratzka, T., Leinert, C., Henning, T., et al. 2007, A&A, 471, 173
- Rufener & Nicolet (1988) Rufener, F. & Nicolet, B. 1988, A&A, 206, 357
- Sault et al. (1995) Sault, R. J., Teuben, P. J., & Wright, M. C. H. 1995, in Astronomical Society of the Pacific Conference Series, Vol. 77, Astronomical Data Analysis Software and Systems IV, ed. R. A. Shaw, H. E. Payne, & J. J. E. Hayes, 433–+
- Siess et al. (2000) Siess, L., Dufour, E., & Forestini, M. 2000, A&A, 358, 593
- Thi et al. (2010) Thi, W., Woitke, P., & Kamp, I. 2010, ArXiv e-prints
- van Boekel et al. (2004a) van Boekel, R., Min, M., Leinert, C., et al. 2004a, Nature, 432, 479
- van Boekel et al. (2005) van Boekel, R., Min, M., Waters, L. B. F. M., et al. 2005, A&A, 437, 189
- van Boekel et al. (2004b) van Boekel, R., Waters, L. B. F. M., Dominik, C., et al. 2004b, A&A, 418, 177
- van den Ancker et al. (1998) van den Ancker, M. E., de Winter, D., & Tjin A Djie, H. R. E. 1998, A&A, 330, 145
- Verhoeff et al. (2010) Verhoeff, A. P., Waters, L. B. F. M., Veerman, H., et al. 2010, submitted to A&A
- Vinković et al. (2006) Vinković, D., Ivezić, Ž., Jurkić, T., & Elitzur, M. 2006, ApJ, 636, 348
- Vinković et al. (2003) Vinković, D., Ivezić, Ž., Miroshnichenko, A. S., & Elitzur, M. 2003, MNRAS, 346, 1151
- Waelkens et al. (1996) Waelkens, C., Waters, L. B. F. M., de Graauw, M. S., et al. 1996, A&A, 315, L245
- Walker & Butner (1995) Walker, H. J. & Butner, H. M. 1995, Ap&SS, 224, 389
- Weingartner & Draine (2001) Weingartner, J. C. & Draine, B. T. 2001, ApJ, 548, 296
- Woitke et al. (2009) Woitke, P., Kamp, I., & Thi, W. 2009, A&A, 501, 383