∎
University of Utah
Salt Lake City, USA
11email: tim.garrett@utah.edu.
How persistent is civilization growth?
Abstract
In a recent study GarrettCO2_2009 , I described theoretical arguments and empirical evidence showing how civilization evolution might be considered from a purely physical basis. One implication is that civilization exhibits the property of persistence in its growth. Here, this argument is elaborated further, and specific near-term forecasts are provided for key economic variables and anthropogenic CO2 emission rates at global scales. Absent some external shock, civilization wealth, energy consumption and carbon dioxide emissions will continue to grow exponentially at an average rate of about 2.3% per year.
1 Introduction
Through combustion, carbon dioxide (CO2) is emitted as a by-product of the primary energy consumption that is used to run the economy Raupach2007 . Anthropogenic CO2 emissions accumulate in the atmosphere KeelingWhorf2005 , and are a primary control of changes in global mean climate Lacis2010 .
Studies of the response of the atmosphere to changing greenhouse concentrations are informed by a mixture of observations and a basic understanding of underlying processes. The evidence is that about 40% of emitted carbon remains in the atmosphere Joos1996 ; LeQuere2003 ; Knorr2009 . Numerical and theoretical models, combined with paleoclimate data, point to an equilibrium surface temperature response to a doubling of CO2 concentrations that lies somewhere between 2 ∘C and 4.5 ∘C IPCC_WG12007 .
Meanwhile, economic scientists consider the evolution of civilization and its emissions to be driven by decisions made by individuals, organizations and governments IPCC_WG32007 . The judgement is that human perceptions and behavior control the rate at which civilization consumes fossil energy. Policy guides sources of primary energy, rates of human reproduction, individual wealth and lifestyles, and how efficiently energy is consumed to produce economic output Raupach2007 . Global CO2 emission trajectories are determined by these choices.
Unfortunately, there is an exceptionally broad range of CO2 emission trajectories that is considered to be humanly plausible, and this greatly amplifies the uncertainty in the physics Stott2002 . Arguably, this is a real problem, especially if climate change becomes a negative feedback on economic growth IPCC_WG22007 . If human adaptation to climate change is to be anything more than purely responsive, constrained forecasts of global CO2 emission trajectories will certainly be needed.
In a recent paper in this journal GarrettCO2_2009 , I suggested that predictability might be greatly improved if, like climate systems, human systems were also approached from a physical viewpoint. To this end, I proposed a thermodynamically-based framework for the evolution of civilization wealth and its rate of energy consumption at globally integrated scales. At the core of the prognostic model is a hypothesis that the instantaneous rate of primary energy consumption by civilization is linked through a constant to its inflation-adjusted economic value (or civilization wealth) , where wealth is the time-integral of global economic production (or GDP) , adjusted for inflation at market exchange rates (MER), and aggregated over the entirety of civilization history Maddison2003 ; UNstats
| (1) |
Taking to be in units of Watts, and in units of 1990 MER US dollars per second, then wealth has units of 1990 MER US dollars, and the constant has units of Watts per 1990 MER US dollar.
While this formulation is highly unorthodox from traditional economic standpoints (see a discussion in Appendix B of Garrett (2011)), it is nonetheless transparent, and therefore easy to test. What was found was that for the period 1970 to 2005 for which global statistics for were available AER2009 , the mean value of amounts to 9.7 milliwatts per 1990 US dollar, with an uncertainty in the mean at the 95% confidence level of just 0.3 milliwatts per 1990 US dollar.
It appears then that is indeed constant with time. This is the empirical support behind the initial hypothesis expressed in Eq. 1, that real global economic value is an expression of the global capacity to consume primary energy resources. More recent data extending to 2008 has not changed the value of the derived result (see Table 1 and the supplementary material). If anything, the inter-annual variability in calculated values of is diminishing with time
| 1970 | 1975 | 1980 | 1985 | 1990 | 1995 | 2000 | 2005 | 2008 | |
|---|---|---|---|---|---|---|---|---|---|
| 7.2 | 8.4 | 9.6 | 10.3 | 11.7 | 12.2 | 13.2 | 15.3 | 16.4 | |
| 821 | 884 | 960 | 1048 | 1151 | 1266 | 1398 | 1536 | 1656 | |
| 8.8 | 9.4 | 10.0 | 9.8 | 10.2 | 9.6 | 9.4 | 9.9 | 9.9 | |
| 11.5 | 13.9 | 16.8 | 19.2 | 22.3 | 24.8 | 29.3 | 33.6 | 37.1 | |
| (% per year) | 1.40 | 1.57 | 1.75 | 1.83 | 1.93 | 1.96 | 2.09 | 2.17 | 2.24 |
.
2 Precision versus predictability in economic quantities
Here, the implications of being constant for long-range predictability are discussed in greater detail. The main implication is that global civilization has inertia. Eq. 1 shows that the current rate of energy consumption is intrinsically determined by the entirety of past economic productivity , which, when adjusted for inflation, yields our current global wealth . Because the past is unchangeable, civilization will carry its current wealth into the future, and also its associated rate of energy consumption . Unless there is very rapid decay from some severe external shock, near-term reductions in energy consumption and wealth are physically implausible. They would require civilization to somehow “forget” its past accumulation of wealth .
In general, the variance of any externally forced system demonstrates the property of “reddening”, meaning that it is the most slowly evolving components of the system that exhibit the most power. The analogy that could be drawn is to a growing child, or in fact any other organism Montieth2000 ; Brown2004 . Whether the child is growing or shrinking, energy must still be consumed to sustain all the internal circulations that have developed through prior growth of body mass. Accident or a disease could rapidly change rates of energy consumption through sickness and death. But otherwise, the child will tend to follow a slowly evolving growth trajectory.
In the same manner, civilization as a whole consumes energy in order to sustain the material flows that enable it to survive. The current capacity to consume has evolved from the activities of our ancestors, through their creation of us, as well as their construction of farms, towns, communication networks and machines. This past production and consumption continues to enable us to consume. And, since civilization is currently very large, it is this accumulated past that will most strongly govern our future energy consumption and emission rates of carbon dioxide.
The growth rate of civilization and its energy consumption can be expressed in a variety of ways, all of which follow from Eq. 1:
| (2) |
There is currently no fundamental theory for describing what controls the evolution of in civilization. However, the data indicate that the growth rate evolves slowly itself. In 2008 it reached a historical high of 2.24 % per year (Table 1), up from 1.93% per year in 1990. It is probably a safe bet to assume that that similar growth rates will persist in the near-term.
The point here is that persistence is an effective tool for forecasting, but most especially when applied to ”reddened” variables like global wealth , that are highly integrated over time and space. When predicting the evolution of any system, there is always a trade-off. Integral quantities are easier to forecast, but at the sacrifice of temporal and spatial resolution. Specifically, integration biases variability in towards its more slowly varying components. If is much larger than , then even wild short-term fluctuations in can have only limited impact on the total integral over time. Indeed, as shown in Table 1, this is the scenario we currently experience. Annual GDP () is only about 2% of total global wealth (). So even in an artificial scenario where GDP were to suddenly halve for the next five years, it would not have a large impact on global wealth and rates of energy consumption.
The value of examining globally and temporally integrated quantities was a point that was largely missed in two critiques that appeared with Garrett (2011). Cullenward et al. (2011) and Scher and Koomey (2011) argued that there cannot be a constant relationship between energy consumption rates and wealth because the relationship between and is highly dynamic, both temporally and between sectors/nations.
This misrepresents the arguments in Garrett (2011) because the discussion of Eq. 1 in Garrett (2011) was explicitly referenced, not to nations or economic sectors, but to civilization as a whole. More importantly, Eq. 1 does not apply to , but rather to the integral quantity . Certainly, there has been past discussion among economists that there exists a strong correlation between rates of energy consumption and economic production at the national level (e.g., Costanza1980 ). However, and are not at all the same thing, and they have no obvious relationship to one another. They might be statistically correlated, but only if is growing exponentially.
In fact, if is constant, then it is gains in “energy productivity” that drive global economic growth. Essentially, is a measure of the capacity of civilization to turn current energy consumption into its own growth, where growth enables civilization to consume more energy in the future. Combining Eqs. 1 and 2, one finds that the growth of wealth and energy consumption follow
| (3) |
Thus, contrary to what is normally assumed Raupach2007 , higher energy productivity corresponds to accelerated growth in energy consumption rates (see also Jevons1865 ; Saunders2000 ; Owen2010 ). Similarly, the growth in real global GDP follows
| (4) |
For example, the mean value of between 1970 and 2008 was 61 micro-dollars per joule, where dollars are expressed in inflation-adjusted 1990 MER units. Thus, the mean value of for this period is 5.910-8 % per second or 1.87 percent per year. A linear least-squares fit to the observed trend in is 1.00 % yr-1. Thus, the thermodynamically based model provides a mean calculated growth rate for world real GDP between 1970 and 2008 of 1.87 1.00 2.97 % per year. The actual observed value based on a least-squares fit to the data is 2.90% per year. The difference between observations and theory is just two percent.
Such accuracy in the global GDP growth calculation is really just a consequence of there being a constant factor relating global wealth to energy consumption rates (Table 1); the rest is just basic math. But, perhaps since increased by more than a factor of three between 1970 and 2008, this analysis might lend further reassurance that the model is empirically validated, and that it can provide simplified forecasts of global GDP growth without having to resort to explicit representations of nations, sectors, people or their lifestyles111In fact, it is the absence of people in the model that is the justification for evaluating fiscal quantities in units of MER rather than purchasing power parity (PPP) currency, as has been advised Cullenward2010 . .
3 Persistence in growth
To reiterate, available statistics show that wealth, when it is integrated over the entire global economy and integrated over the entire history of economic production, has been related to the current rate of global primary energy consumption through a factor that has been effectively constant over nearly four decades of civilization growth. Its implications for the future are that civilization has inertia, and therefore its current rate of consumption growth is unlikely to cease in a hurry.
From Eq. 2, is the rate of growth of real wealth and energy consumption rates . The value of is intrinsically tied to the energy productivity through Eq. 3. Thus, the rate of growth in itself, or , can be termed as the “real innovation rate” since it corresponds to greater energy productivity. In an innovative world, the deterministic solution for the growth of energy consumption rates , wealth and CO2 emission rates (assuming they stay tied to energy consumption rates) is of form GarrettCO2_2009
| (5) |
where refers to any of , , or . is some initial condition and is the time constant for growth in
| (6) |
Note that the solution for (Eq. 5) condenses to the simple exponential growth form of in the limit that innovation slows to the point that . If there is innovation, however, then is positive and finite, and growth is super-exponential (i.e. the exponent of an exponent).
Another way of expressing innovation and its relationship to growth is to think of doubling-times. The doubling times for wealth and growth rates are given by
| (7) |
| (8) |
Effectively represents the time required for civilization to double its wealth at current rates, and is the time required for the growth rate to double (or to halve). Thus, from Eq. 5, a deterministic solution for growth in wealth, energy consumption or CO2 emissions follows
| (9) |
Historical statistics for and are shown in Fig. 1. For the purpose of the calculations, the definition of exponential growth rates is (Eq. 2). The data show that, over the past century or so, there has been a long term tendency for wealth to double over ever shorter intervals. As a whole, the world is getting richer faster.
More interesting than the growth rate, however, is the innovation time, which itself shows marked inflection points. There were two periods of particularly rapid innovation. The first was in the late 1800s and early 1900s, when the growth rate doubled in 40 years. Following 1950, the growth rate doubled over a remarkably short timespan of just 20 years.
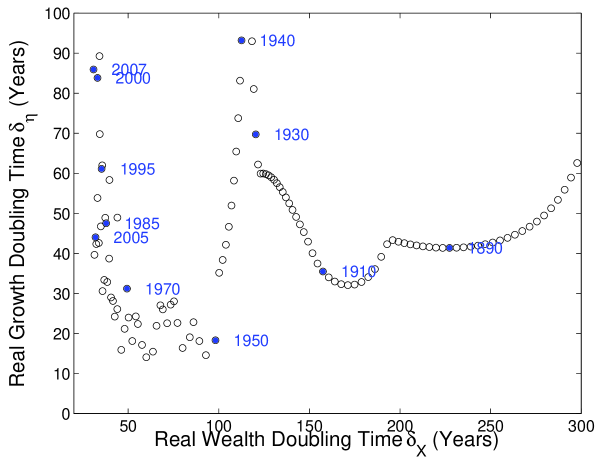
For contrast, both the 1930s and the past decade have been characterized by more stagnant innovation, or a relaxation from super-exponential to simple exponential growth. Currently, wealth is doubling more quickly than ever before; it now takes only about 30 years for global wealth to double. Still, for the first time since the Great Depression, the doubling time has nearly ceased to shorten.
It is interesting to speculate as to what might be driving the variability in . Perhaps it is access to important new oil reservoirs in the late 1800s and around 1950 that led to bursts in innovation, and an absence of large discoveries is slowing real innovation today. If so, it hints at a more fundamental thermodynamic theory for civilization evolution that incorporates the accessibility and depletion of geological reservoirs.
In the meantime, one can take advantage of recent stagnation in innovation to make simplified near-term forecasts for the growth of the human system and its CO2 emissions (Table 2). Assuming persistence, on average, global energy consumption rates and wealth will continue to grow at a rate of about 2.3% per year, or a doubling time of 30 years. Assuming that global decarbonization continues to be extremely slow Raupach2007 , the same rate will apply to global emissions of CO2, . From Eq. 4, global real GDP will grow at a rate that is only marginally faster than the growth rate for wealth, since the innovation rate is approaching zero.
| Growth rate (% yr-1) | 2.3 | 2.3 | 2.3 | 2.3 |
| Doubling time (yr) | 30 | 30 | 30 | 30 |
As a strong word of caution, persistence is never something to carry too far. As a guess, the rates provide in Table 2 apply only for timescales significantly less than the wealth doubling time of 30 years. Essentially the future is unknowable, and unforeseen catastrophes or boons cannot be excluded. Equally, exponential growth cannot continue unabated because, sooner or later, civilization must face up to resource depletion or environmental degradation.
4 Conclusions
Sometimes one sees the naive argument that climate scientists are presumptuous to make long-range forecasts of climate when short-term weather forecasts are so often wrong. What makes climate forecasts possible is top-down energetic constraints. It is not necessary to explicitly model weather in order to make long-term forecasts of globally-averaged surface temperatures. With certain assumptions about relative humidity and clouds, the key ingredients for a simple 1D radiative-convective equilibrium climate model are the rate of solar energetic input, and the concentration of greenhouse gases ManabeWetherald1967 . Long-range predictions of regional climate variability require greater sophistication. But even here, top-down constraints dictate the plausible range of climatolological parameter space IPCC_WG12007 .
Scher and Koomey (2011) have argued that “Economic systems are not the same as physical systems, and we shouldn’t model them as if they are”. Nonetheless, civilization is part of the physical universe. As with climate and weather, its evolution should also be constrained by global scale energetic flows. The evidence presented here and in Garrett (2011) suggests that it is indeed possible to make long-term forecasts of global energy consumption rates, without having to explicitly model the internal, short-term details of people and their lifestyles. Long-range forecasts of energy consumption by specific countries or economic sectors will be more difficult Scher2010 and require additional sophistication. But, from the standpoint of determining emission rates of a long-lived gas such as CO2, the internal details are largely irrelevant. So long as there is atmospheric mixing and international trade, it is only global scale energy consumption and CO2 emissions that matter.
The main point made in Garrett (2011) was that the global economy can be placed on a physical footing, through a constant coefficient that links economic wealth (not wealth production) to the global consumption rate of primary energy resources. The relevant physics is still too primitive to provide a fully deterministic solution into the future. Still, as argued here, one can apply the principle of persistence based on recent trends, provided one is looking at quantities that are highly integrated over space and time. Just as one might make the purely statistical argument that recent trends in globally-averaged surface temperatures will continue into the near future, here it is suggested that near-term growth in economic wealth and energy consumption rates will also persist. The qualification is that the growth will not be super-exponential, as it has been in past decades, but more purely exponential. The forecasted growth rate is about 2.3 per year.
References
- (1) Climate Change 2007 - Mitigation of Climate Change. Cambridge University Press (2007)
- (2) Annual Energy Review 2009. Tech. Rep. DOE/EIA-0384(2009), Department of Energy, Energy Information Administration (2009). URL www.eia.doe.gov/aer/inter.html
- (3) United Nations Statistical Databases (2010). URL unstats.un.org/unsd/snaama
- (4) Brown, J.H., Gillooly, J.F., Allen, A.P., Savage, V.M., West, G.B.: Toward a metabolic theory of ecology. Ecology 85, 1771–1789 (2004)
- (5) Costanza, R.: Embodied energy and economic valuation. Science 210, 1219–1224 (1980)
- (6) Cullenward, D., Schipper, L., Sudarshan, A., Howarth, R.B.: Psychohistory revisited: fundamental issues in forecasting climate futures. Clim. Change 3, 457–472 (2011)
- (7) Garrett, T.J.: Are there basic physical constraints on future anthropogenic emissions of carbon dioxide? Clim. Change 3, 437–455 (2011). DOI 10.1007/s10584-009-9717-9
- (8) IPCC: Climate Change 2007 - Impacts, Adaption and Vulnerability. Cambridge University Press (2007)
- (9) IPCC: Climate Change 2007 - The Physical Basis. Cambridge University Press (2007)
- (10) Jevons, W.S.: The Coal Question. Macmillan and Co. (1865)
- (11) Joos, F., Bruno, M., Fink, R., Siegenthaler, U., Stocker, T.F., Le Quéré, C., Sarmiento, J.L.: An efficient and accurate representation of complex oceanic and biospheric models of anthropogenic carbon uptake. Tellus B 48, 397–417 (1996)
- (12) Keeling, C.D., Whorf, T.P.: Trends: A Compendium of Data on Global Change, chap. Atmospheric CO2 records from sites in the SIO air sampling network. Carbon Dioxide Information Analysis Center, Oak Ridge National Laboratory, U.S. Department of Energy, Oak Ridge, Tenn., U.S.A. (2005)
- (13) Knorr, W.: Is the airborne fraction of anthropogenic CO2 emissions increasing? Geophys. Res. Lett. 36, L21,710 (2009). DOI 10.1029/2009GL040613
- (14) Lacis, A.A., Schmidt, G.A., Rind, D., Ruedy, R.A.: Atmospheric co2: Principal control knob governing earth’s temperature. Science 330, 356–359 (2010). DOI 10.1126/science.1190653
- (15) Le Quéré, C., Aumont, O., Bopp, L., Bousquet, P., Ciais, P., Francey, R., Heimann, M., Keeling, C.D., Keeling, R.F., Kheshgi, H., Peylin, P., Piper, S.C., Prentice, I.C., Rayner, P.J.: Two decades of ocean CO2 sink and variability. Tellus B 55, 649–656 (2003). DOI 10.1034/j.1600-0889.2003.00043.x
- (16) Maddison, A.: The World Economy: Historical Statistics. OECD (2003)
- (17) Manabe, S., Wetherald, R.T.: Thermal equilibrium of the atmosphere with a given distribution of relative humidity. J. Atmos. Sci. 24, 241–259 (1967)
- (18) Montieth, J.L.: Fundamental equations for growth in uniform stands of vegetation. Agricult. Forest. Meteorol. 5-11 (2000)
- (19) Owen, D.: The efficiency dilemma. The New Yorker pp. 78–85 (2010)
- (20) Raupach, M.R., Marland, G., Ciais, P., Le Quéré, C., Canadell, J.G., Klepper, G., Field, C.: Global and regional drivers of accelerating CO2 emissions. Proc. Nat. Acad. Sci. (2007). DOI 10.1073/pnas.0700609104
- (21) Saunders, H.D.: A view from the macro side: rebound, backfire, and Khazzoom-Brookes. Energy Policy 28, 439–449 (2000)
- (22) Scher, I., Koomey, J.: Is accurate forecasting of economic systems possible? An editorial comment. Clim. Change 3, 473–479 (2010). DOI 0.1007/s10584-010-9945-z
- (23) Stott, P.A., Kettleborough, J.A.: Origins and estimates of uncertainty in predictions of twenty-first century temperature rise. Nature 416, 723–725 (2002)