On the mass distribution of neutron stars
R.Valentim, E. Rangel and J.E. Horvath
Instituto de Astronomia, Geofísica e Ciências Atmosféricas
Universidade de São Paulo, 05570-010 Cidade Universitária SP, Brazil
Abstract
The distribution of masses for neutron stars is analyzed using the Bayesian statistical inference, evaluating the likelihood of proposed gaussian peaks by using fifty-four measured points obtained in a variety of systems. The results strongly suggest the existence of a bimodal distribution of the masses, with the first peak around , a much wider second peak at . The results support earlier views related to the different evolutionary histories of the members for the first two peaks, which produces a natural separation (even if no attempt to “label” the systems has been made here), and argues against the single-mass scale viewpoint. The bimodal distribution can also accommodate the recent findings of masses quite naturally. Finally, we explore the existence of a subgroup around , finding weak, if any, evidence for it. This recently claimed low-mass subgroup, possibly related to core collapse events, has a monotonically decreasing likelihood and does not stand out clearly from the rest of the sample.
Keywords Stars: neutron
1. Introduction
The measurements of masses and radii of neutron stars have the potential to constrain stellar evolution and dense matter physics alike. In fact, matching stellar evolution results and arguments to actual neutron star observations is crucial to test the whole theory. As is well-known, he standard Stellar Evolution theory suggests the mass at the main sequence to be the most important parameter for the final outcome of massive stars. The lowest end of is expected to produce very degenerate cores which eventually collapse because of electron captures. Some possible systems in which the collapse can occur have been discussed in Siess (2007), Poelarends et al. (2008) , Nomoto & Kondo (1991) Nomoto & Iben (1985) and Nomoto (1987), among other works. Podsiadlowski et al. (2005) elaborated on this problem and suggested that, due to the “characteristic mass” expected for the core, the equation of state and amount of ejected mass would produce low-mass neutron stars in the ballpark of , also expected to receive small natal kicks in their birth events and therefore showing a low eccentricity. Further evidence in favor of this proposal has been presented by Schwab, Podsiadlowski & Rappaport (2010) after analyzing a sample of 14 well-measured neutron stars. In addition, a group of has been also identified and associated with the standard scenario of iron core collapse.This group features a much higher natal kick, and comprises some of the binary pulsar systems such as PSR 1913+16.
On the other hand, increasing evidence for massive neutron stars has been mounting, with several systems in the range and the very recent report of a (Demorest et al. 2010). Interestingly enough, most of these neutron stars typically have a white dwarf companion, and thus a distinct evolutionary history. However, systems in HMXRB and in a binary pulsar also exist. The mass could be the direct result of the existence of massive iron cores for in the Main Sequence (Timmes, Woosley & Weaver 1996), a view advocated by van den Heuvel (2010) and others.
The knowledge of this mass distribution is therefore fundamental to understand the mechanisms involved in the final stages of stellar evolution. In this work, we consider the sample of know neutron star masses. We applied a Bayesian analysis for all set of masses overcome an a priori distribution. This work is motivated by a similar earlier approach by Finn (1994), who applied the Bayesian approach for to estimate the upper and lower limit for the neutron star masses, using one small set of data with only four well-measured neutron star binary pulsar systems. He observed the coincidence that all binary pulsar systems have constrained the masses close to . Schwab, Posialdowski & Rappaport (2010) recently argued for the existence of two distinct neutron stars populations, the first with high-mass and the second with low-mass , in a work that analyzed fourteen well-measured objects with uncertainties of . They interpreted these two populations as to be result of distinct evolutionary formation scenarios: low-mass populations originates in electron-capture SNe and feature low kicks, while the high-mass population is the result of iron core collapse SNe. Both the situations, the authors proposed that masses are bounded the formation mechanisms restrict the range of neutron stars and the existence of the two channels for the production of neutron stars. Work by Thorsett and Chakrabarti (1999) a decade ago concluded that a very narrow range of masses around was found analyzing a sample of 50 objects, ruling out accretion at the level of for the binary pulsars known at that time. Very recently, Zhang et al. (2010) concluded that a substantial accretion was present in recycled objects using an enlarged sample. Clearly, a reanalysis of this subject is in order.
2.Neutron star sample
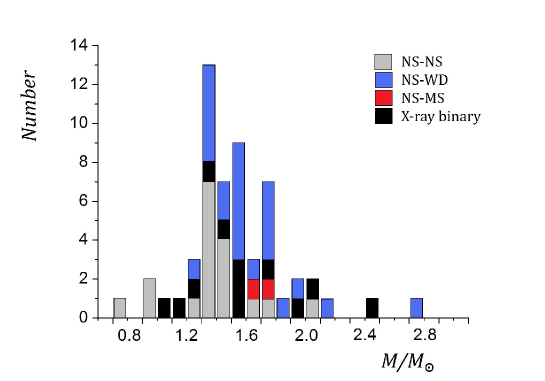
Our adopted sample is the compilation by Lattimer and collaborators, publicly available at http://stellarcollapse.org/nsmasses . After finding the central values for each source (Fig. 1), we included the 55 neutron stars with error bars varying between and in our work. The full references to the original works, including the label letter employed in the compilation are listed in the References. The uncertainties for each mass are quite different because the methods of measurement were distinct at different times, and the methods had been improved in many cases.
3. Statistical methodology
In this work the analysis the sample of neutron star masses has been studied using Bayesian Statistics based on conditional probabilities, usually stated as , where is the probability priori, is the likelihood function, is the posteriori probability and is the predictive probability. This approach has been shown to be particularly powerful for the treatment of scarce/inaccurate data, yielding nonetheless quite accurate estimate of the parameters in most cases. One of the main tools to evaluate the quality of the results is the Bayesian Information Criterion (BIC), which considers the ratio of the likelihood models, the available data and models, and explicitly penalizes the model having more parameters. A crucial (and often criticized) ingredient is the a priori expectations from theoretical inference which is weighed by the BIC. An earlier study by Finn (1994) used radio observations for four neutron star binary pulsar systems and employed Bayesian Statistics, approximating each observed point by a gaussian function (on mass and standard deviation). He used one flat a priori distribution between an assumed upper limit of mass and the lower limit . The values found were (lower limit) and (upper limit). We aimed to improve this kind of analysis by working with the much larger sample and exploiting the potential of the Bayesian formalism.
3.1 Likelihood
Our tasks in this section is to construct the likelihood function. The likelihood distribution is the key point of Bayesian analysis because it considers the data and the theoretical knowledge about the measurements together. Here, we assumed that the likelihood function is simply the product of independent probabilities for what was measured and what was expected to be measured
Where represents the space of parameters, is the data set, the models, is the probability of the data to be measured and is the expected probability for the measured data. The likelihood weights the sampling probability given the data () and assuming the model (). The likelihood in our case is
Where is a function that involves the peak masses , , is the relative amplitude of the first peak, 111Where . is the amplitude centered on the , with assumed standard deviation , , are the standard deviations of the theoretical peaks and is a gaussian function (actually the product of two gaussian distribution integrated).
Where and are
and
is the scale parameter, , are the standard deviations of the and . Finally, is
3.2 The a priori distributions
The a priori distribution is the assumed knowledge about the phenomenon that is treated. In many previous works, notably those of Finn (1994) and Schwab, Podsiadwolski and Rappaport (2010), gaussian distributions were employed, and are a “natural” choice employed in our work (see Finn 1994 for a discussion of this gaussian form within the Bayesian approach). We then assumed, to make contact with the work of Schwab, Podsiadwolski and Rappaport (2010), a distribution peaked on two masses, around , and . Those authors restricted their analysis to a set of 14 well-measured NS, and did not include the large error bar points of the X-ray binaries and several WD-NS systems, consistently with their frequentist approach. With the aim of exploring the full distribution, we have chosen a second, higher value of to match the plain mean value of the NS in WD-NS and X-ray binary systems of the sample first but, as we shall see below, the precise value is not too important at this point. We performed a first run within this two-value hypothesis, and compared it with the occurrence of a single mass peak for all objects, including NS-NS binaries, WD-NS binaries, X-ray binaries and MS-NS systems. The motivation for this first bold comparison was to see whether a single mass scale was still possible with the present data, as many works insisted on till a few years ago.
After this “first run”, and still working within the two-peak hypothesis, and adopting the same values as Schwab, Podsiadwolski and Rappaport (2010) for and , we looked for evidence of a subgroup attributed by them to cores producing low-mass neutron stars. In addition to the main peaks, we examined the distribution to identify the presence of this subgroup by defining as the peak amplitude of a , that is, relative to the two main identified peaks.Again, since the claimed masses lie at the low end, the calculation is not sensitive to the precise value of . We defined and calculated the relevant likelihood of a third peak, physically related to the formation of light NS out of cores of the lighter progenitors, of this second run.
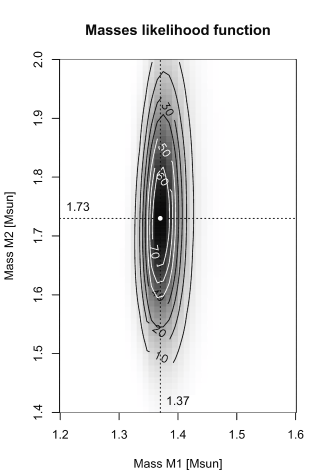
In a third run we left the values of the masses and to be determined directly by the raw available data, together with their standard deviations values and . That is, while still imposing the distribution to be composed of two gaussian forms, we sought for the optimal values without restrictions as driven by the data sample. The purpose here is to let the Bayesian tools to indicate which are the possible values given the full error bars and within a definite gaussian hypothesis.
4. Results and Conclusions
We first address the basic results provided by the first run: the likelihood of still a single mass-scale as an explanation of all the data points is much lower than (at least) two peaks in them, in spite of the introduction of extra parameters penalized by the Bayesian approach. This results may not be meaningful for some, since it has been known for years that the more massive systems should have accreted or more, and therefore detach from the original mass value. However, the first run is important to overcome the idea that a single value of the NS mass will be enough: even if the two peaks are quite close, this distribution is preferred to a single wide peak. This is somewhat expected, since the extremes of the determined masses, around , (van der Meer et al. 2007, see the recent work by Rawls et al. 2011 released after the completion of this work) at the lowest and (Demorest et al. 2010), with a few more massive candidates (Clark et al. 2002, Freire et al. 2008b), are now separated by at least .
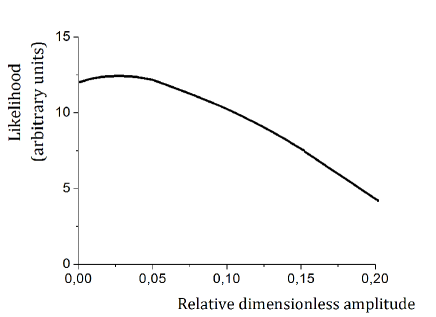
The results of the second run are summarized in Fig.2. The calculated likelihood of the third peak is a monotonically falling function of the amplitude, being maximal around zero amplitude (relative to the prominent main peaks). Therefore, we conclude that there is little evidence for the presence of a low-mass subgroup, and that the four objects in this range may be in fact members of the peak . However, the confirmation of this result would have important consequences, since the progenitor stars are quite abundant. The lack of strong evidence of a peak could be due to still poor sample/bias, or it could alternatively mean that most of the become AGB, an issue that deserves serious consideration.
The results of the third run rendered two masses, as shown in Fig.3. The first mass is not substantially different from the result of Schwab, Podsiadwolski and Rappaport (2010), a fact we interpret as the robustness of the distribution at this scale; while the second one is now around . This is not surprising, since the known WD-NS and X-ray binary systems have large uncertainties but also high values of the central NS masses. The full advantage of the Bayesian techniques suggest here that masses around are not unexpected, even less when considering the obtained value of (for comparison, the value of is very narrow, as expected). The recently announced value of the object in the system, according to Demorest et al. 2010 (not included in the sample), is just an example of this higher figure for the systems of this kind, and suggests a mean accreted mass of several tenths of , although the precise value is model-dependent and should be estimated for each individual case. This subgroup may also include members coming from masses in the Main Sequence (Timmes, Woosley and Weaver 1996, van den Heuvel 2004), born with higher masses without suffering any substantial accretion..
In summary, we have presented an analysis of an available NS mass sample which indicates a) a bimodal distribution with a narrow peak at (fully compatible with the findings of Schwab, Podsiadwolski and Rappaport (2010), and a higher peak at , the latter with a wide shape capable of accommodating masses, b) little evidence for the expected low-mass NS descendants from the range in the Main Sequence, and c) the unsustainability of the “one-mass-fits-all” picture, since the adopted Bayesian scheme properly weights the large uncertainties and extra parameters of the bimodal hypothesis applied to an imperfect dataset. Given the potential implications for the stellar evolution, the need of further pursuing these kind of analysis and a continuous improvement by incorporating new data can not be overstated.
After the completion of this work we noticed the public release of a Bayesian analysis by Kiziltan, Kottas and Thorsett (2010), tackling the same problem and with a very detailed treatment of the calibration. Also their sample is restricted to avoid the inclusion of WD-NS and X-ray binary systems with large error bars. Within this analysis, the authors find two peaks, one at , and a second one located at . Given the different sampling and their reliance on simulated distributions (not performed by us), it is fair to say that there is enough room for a convergence of results. It is important to note that these authors warn against the inclusion of more uncertain points because of a possible contamination of the sample. While we agree with this judgement, we believe that unless the higher masses happen to be completely and systematically overestimated, the emergence of a bump at a mass even higher than is strongly expected. Our value for that “second peak” should reflect to a large extent the difference of including these loose observational data as processed by the Bayesian formalism, acknowledged to handle this kind of situations better than well-known frequentist approaches. In addition, the quest for a low-mass bump remains in that work, since the peak at the lower hosts the low-mass systems attributed by Schwab, Podsiadwolski and Rappaport (2010) to the lower end of progenitor masses.
Finally, we acknowledge the works of Steiner, Lattimer and Brown (2010) and Zhang et al. (2010), the first aimed to reveal the nuclear equation of state and the second focusing on the evolutionary features of the systems. Steiner, Lattimer and Brown found independently, from an analysis of a subset of X-ray bursters, that the maximum mass had to be quite high, as demanded by the 2- determination by Demorest et al. (2010) released shortly after their paper. We did not attempt any specific inference about the nuclear equation of state here, although our results also demand a theoretical description capable to accommodate the objects in the second peak. On the other hand, Zhang et al. used almost the same sample, but their calculations attempted to link the period to the mass, rather than discriminating between single-peak and multimodal distributions. Even their statements about the NS-NS systems alone does not allow a firm conclusion about the existence of the low-mass peak at , since they focus just on the mean values and dispersions. In all cases the relatively high values of the latter dispersions seem to be a consequence of this methodology.
Acknowledgments
We would like to acknowledge the financial support of the FAPESP (São Paulo) Agency and CNPq (Brazil). Drs. M.G. Pereira and F. D’Amico are gratefully acknowledged for their scientific advice during this work. An anonymous referee is acknowledged for useful suggestions and criticisms that improved the first version of this work.
References
Barziv, O., Karper, L., van Kerkwijk, M.H., Telging, J.H., van Paradijs, J. (b), 2001, A&A, 377, 925
Bassa, C.G., van Kerkwijk, M.H., Koester, D., Verbunt, F. (O), 2006, A&A 456, 295
Bhat, N.D.R., Bailes, M., Verbiest, J.P.W. (j), 2008, Phys. Rev. D 77, 124017
Casares, J., González Hernández, J.I., Israelian, G., Rebolo, R. (d), 2010, MNRAS, 401, 2517
Champion, D.J., Lorimer, D.R., McLaughlin, M.A., Xilouris, K.M., Arzoumanian, Z., Freire, P.C.C., Lommen, A.N., Cordes, J.M., Camilo, F. (z), 2005, MNRAS, 363, 929
Clark, J.S. et al.(a), 2002, A&A, 392, 909
Corongiu, A., Kramer, M., Lyne, A.G., Lohmer, O., D’Amico, N., Possenti, A. (A), 2004, Mem. S. A. It. Suppl. 5, 188
Demorest, P., Pennucci, T., Ransom, S., Roberts, M., Hessels, J. 2010, Nature, 467, 1081
Ferdman, R.D. (J), 2008, Ph.D. thesis, Univ. of British Columbia
Finn, L.S., 1994, Phys. Rev. Lett., 73, 1858
Freire, P.C.C.(N), 2009, talk given at the Hirschegg 2009:Nuclear Matter at High Density Workshop, available at http://crunch.ikp.physik.tu-darmstadt.de/nhc/pages/events/hirschegg/2009/prog-2009.html
Freire, P.C.C., Camilo, F., Kramer, M., Lorimer, D.R., Lyne, A.G., Manchester, R.N., D’Amico, N. (w), 2003, MNRAS, 340, 1359
Freire, P.C.C., Ransom, S.M., Gupta, Y. (D), 2007, ApJ 662, 1177
Freire, P.C.C., Wolszcan, A., van den Berg, M., Hessels, J.W.T (l), 2008a, ApJ 679, 1433
Freire, P.C.C., Ransom, S.M., Bégin, S., Stairs, I.H, Hessels, J.W.T., Frey, L.H., Camilo, F. (H), 2008b, ApJ, 675, 670
Freire, P.C.C., Jacoby, B.A., Bailes, M. (L), 2008, in 40 YEARS OF PULSARS: Millisecond Pulsars, Magnetars and More, AIP Conference Proceedings 983, 488
Gelino, D.M., Tomsick, J.A., Heindl, W.A. (I), 2003, Bull. Am. Astron. Soc., 34, 1199
Hotan, A.W., Bailes, M., Ord, S.M. (u), 2006, MNRAS 369, 1502
Jacoby, B.A., Cameron, P.B., Jenet, F.A., Anderson, S.B., Murty, R.N., Kulkarni, S.R. (x), 2006, ApJL, 644, L113
Janssen, G.H., Stappers, B.W., Kramer, M., Nice, D.J., Jessner, A., Cognard, I., Purver, M.B.A (C), 2008, A&A, 490, 753
Jonker, P.G., van der Klis, M., Groot, P.J. (n), 2003, MNRAS, 339, 663
Kramer, M., Stairs, I.H., Manchester, R.H., McLaughlin, M.A., Lyne, A.G., Ferdman, R.D., Burgay, M., Lorimer, D.R., Possenti, A., D’Amico, N., Sarkisian, J.M., Hobbs, G.B., Reynolds, J.E., Freire, P.C.C., Camilo, F.(i), 2006, Science 314, 97
Kiziltan, B., Kottas, A., Thorsett, S.E., arXiv:1011.4291v1 (2010)
Lange, Ch., Camilo, F., Wex, N., Kramer, M., Backer, D.C., Lyne, A.G., Doroshenko, O. (m), 2001, MNRAS 326, 274
Lorimer, D.R., Stairs, I. H.; Freire, P. C.; Cordes, J. M.; Camilo, F.; Faulkner, A. J.; Lyne, A. G.; Nice, D. J.; Ransom, S. M.; Arzoumanian, Z.; Manchester, R. N.; Champion, D. J.; van Leeuwen, J.; Mclaughlin, M. A.; Ramachandran, R.; Hessels, J. W.; Vlemmings, W.; Deshpande, A. A.; Bhat, N. D.; Chatterjee, S.; Han, J. L.; Gaensler, B. M.; Kasian, L.; Deneva, J. S.; Reid, B.; Lazio, T. J.; Kaspi, V. M.; Crawford, F.; Lommen, A. N.; Backer, D. C.; Kramer, M.; Stappers, B. W.; Hobbs, G. B.; Possenti, A.; D’Amico, N.; Burgay, M. (B), 2006, ApJ, 640, 428
Mason, A.B., Norton, A.J., Clark, J.S., Negueruela, I., Roche, P. (f), 2010, A&A, 509, 79
Nice, D.H.(M), 2004, in Proceedings of the IAU Symposium 218: Young Neutron Stars and their Environment, eds. F.M. Camilo & B.M. Gaensler, Ast. Soc. Pac., San Francisco
Nice, D.H., Splaver, E.M., Stairs, I.H. (h), 2001, ApJ 549, 516
Nice, D.J., Splaver, E.M., Stairs, I. H. (g), 2003, in Radio Pulsars, ed. M. Bailes, D. J. Nice, and S. E. Thorsett (Ast. Soc. Pac. 302, San Francisco), 75
Nice, D.J., Stairs, I.H., Kasian, L.E. (y), 2008, in 40 YEARS OF PULSARS: Millisecond Pulsars, Magnetars and More, AIP Conference Proceedings 983, 453
Nomoto, K., 1987, ApJ, 322, 20
Nomoto, K., Iben, I., Jr., 1985, ApJ, 297, 531
Nomoto, K., Kondo, Y., 1991, ApJ, 367, L19
Podsiadlowski, Ph., Langer, N., Poelarends, A. J. T., Rappaport, S., Heger, A., Pfahl, E., 2004, ApJ, 612, 1044
Podsiadlowski, Ph., Dewi, J. D. M., Lesaffre, P., Miller, J. C., Newton, W. G., Stone, J. R., 2005, MNRAS, 361, 1243
Poelarends, A. J. T., Herwig, F., Langer, N., Heger, A., 2008, ApJ, 675, 614
Quaintrell, H., Norton, A.J., Ash, T.D.C., Roche, P., Willems, B., Bedding, T.R., Baldry, I.K., Fender, R.P. (c), 2003, A&A, 401, 303
Ransom, S.M., Hessels, J.W.T., Stairs, I.H., Freire, P.C., Camilo, F., Kaspi, V.M., Kaplan, K.L. (t), 2005, Science 307, 892
Schwab, J., Podsiadwolski, Ph., Rappaport, S., 2010, ApJ, 719, 722
Siess, L., 2007, A&A, 476, 893
Splaver, E.M., Nice, D.J., Stairs, I.H., Andrea, A.N., Backer, D.C. (r), 2005, ApJ 415, 405
Stairs, I.H., Thorsett, S. E., Taylor, J.H., Wolszczan, A. (K), 2002, ApJ, 581, 501
Steeghs, D., Jonker, P.G. (F), 2007, ApJL, 669, L85
Steiner, A.W., Lattimer, J.M., Brown, E.F., 2010, ApJ, 722, 33
Thorsett, S. E., Chakrabarty, D. (e), 1999, ApJ, 512, 288
Timmes, F. X., Woosley, S. E., Weaver, T.A., 1996, ApJ 457, 834
van den Heuvel, E. P. J. 2004, in ESA SP 552, 5th INTEGRAL Workshop on the INTEGRAL Universe, eds. V. Schoenfelder, G. Lichti, & C. Winkler (Noordwijk: ESA), 185
van den Heuvel, E. P. J. 2010, in , Astrophysics of Neutron Stars 2010, ed. E. Gogus et al. (AIP Conference Proceedings), in the press.
van der Meer, A., Kaper, L., van Kerkwijk, M.H., Heermskerk, M.H.M., van den Huevel, E.P.J. (E), 2007, A&A, 473, 523
van Kerkwijk, M.H., van Paradijs, J., Zuiderwijk, E.J. (k), 1995, A&A 303, 497
Verbiest, J.P.W., Bailes, M., van Straten, W., Hobbs, G.B., Edwards, R.T., Manchester, R.N., Bhat, N.D.R., Sarkissian, J.M., Jacoby, B.A., Kulkarni, S.R. (p), 2008, ApJ 679, 675
Weisberg, J.M., Taylor,J.H. (q), 2005, in ASP Conf. Ser. 328, Binary Radio Pulsars, eds. F. A. Rasio & I. H. Stairs, Ast. Soc. Pac., San Francisco, 25
Zhang, C.M., Wang, J., Zhao, Y.H. Yin, H.X., Song, L.M., Menezes, D.P., Wickramasinghe, D.T., Ferrario, L., Chardonnet, P., 2010, A&A, in the press.