Hierarchical organization of brain functional network during visual task
Abstract
In this paper, the brain functional networks derived from high-resolution synchronous EEG time series during visual task are generated by calculating the phase synchronization among the time series. The hierarchical modular organizations of these networks are systematically investigated by the fast Girvan-Newman algorithm. At the same time, the spatially adjacent electrodes (corresponding to EEG channels) are clustered into functional groups based on anatomical parcellation of brain cortex, and this clustering information are compared to that of the functional network. The results show that the modular architectures of brain functional network are in coincidence with that from the anatomical structures over different levels of hierarchy, which suggests that population of neurons performing the same function excite and inhibit in identical rhythms. The structure-function relationship further reveals that the correlations among EEG time series in the same functional group are much stronger than those in different ones and that the hierarchical organization of brain functional network may be a consequence of functional segmentation of brain cortex.
pacs:
87.19.lj, 87.19.le, 87.19.lt, 89.75.FbI Introduction
Human brain, which is consisting of ten thousand million neurons and even more synapses, is perhaps the most complex system ever known. Benefiting from the development of brain anatomy since the nineteenth century, we now know that the neuronal elements of the brain constitute an extremely complex structural network, which supports a wide variety of cognitive functions and neural activities Cajal1995 ; Swanson2003 . Recently, it has gained great interests of scientists to investigate functional connectivity of brain based on complex network theory in which the brain can naturally be abstracted as a functional network. A brain functional network can be extracted based on functional MRI (fMRI), electroencephalography (EEG), magnetoencephalography (MEG), or multielectrode array (MEA) data, which record electric, magnetic, or other signals representing cognitive cortical activities of brain Bullmore2009 . Vertices of brain functional network derived from fMRI data describe anatomically localized regions of interest (ROIs) or voxels of fMRI image, whereas the vertices of those derived from EEG, MEG, or MEA data mimic the surface electrodes or sensors. The functional connectivity (or edge) between pairs of vertices is usually estimated using correlation between records of different vertices.
It has been widely observed that the brain functional networks demonstrate properties such as small-worldness Watts1998 and power-law degree distribution Barabasi1999 , which distinguish brain functional network from regular and random networks Stam2004 ; Eguiluz2005 ; Bassett2006 ; Achard2006 ; Heuvel2008 ; Gong2009 . However, the small-worldness and power-law degree distribution only represent the global properties of brain functional networks. To understand brain functional networks imposed by structural and functional constraints more comprehensively, other aspects, which are expected to reflect both local and global organization of brain functional network (e.g. hierarchical modular organization), need to be investigated.
Hierarchical organization, also called community structure and modular architecture, describes that some nodes in a network are densely connected as groups, and these groups are only sparsely connected among themselves, which is a common phenomenon in diverse networks such as World Wide Web, scientist collaborating networks, genetic networks, protein-protein interaction networks, and financial networks Newman2004 ; Wilkinso2004 ; Jonsson2006 ; Cai2010 . A large number of algorithms are developed to detect the hierarchical organizations of real networks Girvan2002 ; Newman2004 ; Capocci2005 ; Arenas2008 ; Zhang2009 ; Zhang2010 (also see review work Fortunato2010 ). Interestingly, several recent works have also found the hierarchical organization of brain functional network derived from resting-state fMRI data Salvador2005 ; Ferrarini2009 and epileptic MEG signals Chavez2010 , respectively.
Since the large-scale neuronal networks of brain emerge from synchronized delta oscillations, the cortical EEG time series are able to distinguish the ongoing from the evoked activities of brain Langheim2006 ; Lu2007 . In our work, the brain functional networks are derived from high-resolution synchronous EEG time series, which consist of 238 channels and are recorded during a cognitive task involved in visual, judgment and motor functions of brain. In particular, vertices correspond to surface electrodes (i.e. channels), and edges are determined by correlation (degree of phase synchronization) of EEG time series from pairs of channels. In fact, the electrodes can also be clustered into functional groups by their spatial positions on the scalp and specifically priori knowledge of anatomical parcellation of brain cortex. For example, electrodes near visual cortex area mainly represent visual function, and are therefore clustered together. The anatomical parcellation of brain cortex is performed according to Brodmann segmentation scheme Brodmann . The fast Girvan-Newman (GN) algorithm is first applied to analyze the hierarchical organizations of brain functional networks. Strong evidence for the existence of modular architecture is found. Comparing the clustering results from the brain functional network and the anatomical segmentation, we find significant coincidence of the modular architecture in the network derived from EEG data and anatomical organization of the cortex over different levels of hierarchy. This result suggests that vertices are more tightly coupled in same functional cortex region than those belonging to different ones and that the patterns of neural activities of brain cortex are to a large extent determined by the anatomical modular architectures of the brain.
II Materials and methods
II.1 Data acquisition
The high-resolution EEG time series were synchronously recorded during visual task by using a large number of scalp electrodes (238-channels). Therefore, they had a high spatial and temporal resolution, which provide very helpful and detailed information of electrical activity of cortical surface. Specifically, the single-subject data set was recorded by A. Delorme et al. in the Swartz Center, UCSD, with the sampling rate 256 Hz using a Biosemi Active Two system web . Experiments were performed as follows: Filled white disks appeared briefly inside one of five empty squares, and one of the five outlines was colored green to mark the square as a visual target, then the candidate made a motor response by pressing a mouse button with their right hand as quickly as possible whenever the filled white disk appeared at the attended location. It is noted that these locations were counterbalanced across blocks in pseudorandom order. The more detailed description of experiment can be found in several previous works Makeig2002 ; Makeig2004 . In this data set, each visual target was represented by a synchronous EEG recording with five sections, and about three thousands trials of experiment were performed. In addition, there are 235 channels of EEG used in our work by dropping 3 channels of EOG.
II.2 Network construction based on Phase synchronization
The concept of phase synchronization is introduced to study synchronization of coupled oscillators and has gained particular interests to investigate coupling among nonlinear complex systems Kuramoto1984 ; Yeung1999 ; Timme2002 . The phase of a real-value time series is defined using Gabor’s analytic signal approach Gabor1946 :
| (1) |
where the imaginary part is the Hilbert transformation of . Hence, the degree of phase synchronization between time series and is evaluated by a bivariate phase coupling index Schelter2006 :
| (2) |
which is in the interval [0,1]. If the phases of two time series are completely synchronized, the phase coupling index will be maximum.
The phase synchronization method is able to reduce the nonstationary effect, compared with the calculation of the correlation of two EEG time series directly. The functional connectivity (edge) between pairs of electrodes (vertices) has been estimated using the measure of phase synchronization, and then it is thresholded to generate functional networks. Herein each vertex is connected to its nearest neighbors (i.e. those channels that are most phase-synchronized with itself) xiaoke . Notice that the resulting brain functional networks are not necessarily symmetric, i.e. if vertex is a neighbor of vertex , vertex may not necessarily be a neighbor of vertex , and vice versa. Though the edges are intrinsically directed, we analyze the networks in an undirected way for convenience. The mean degree of network is generally determined by . However, since the directed edges are identified as undirected ones, the actual mean degree is a little larger than . In this way, the connectivity of brain functional network is naturally guaranteed without dense connections, which will otherwise disturb the hierarchy detection.
II.3 Clustering EEG channels by electrode position and anatomical parcellation of brain cortex
EEG time series recorded through each channel mainly represent the electrical activities of neurons near the corresponding electrode. Thus, the EEG channels can be directly clustered into functional groups according to the spatial position of electrodes and anatomical parcellation of brain cortex based on Brodmann area. We used the Brodmann template image distributed with MRIcro , which is restricted to the standard MNI space MRIcro . Resolution of image is and size of voxels is . Each hemisphere is partitioned into 41 areas according to cytoarchitecture of neurons, together with the same labels suggesting same cognitive functions in two hemispheres. The locations of electrodes are registered to MNI space using SPM8 toolbox (open-source software) SPM8 . By checking Brodmann areas in which the electrodes belong to, the electrodes that are spatially nearby are labeled by the same Brodmann areas index. At last, these 235 channels are clustered into 25 functional groups corresponding to 25 Brodmann areas (e.g. functional group 47 corresponds Brodmann area 47). Other Brodmann ares are absent due to deeply inside position of the brain cortex. The size of functional groups varies from 1 to 29, as shown in Tab.1. Moreover, Brodmann areas can be roughly scaled into 9 major substructures according to specific physiological functions, by which the EEG channels can be further clustered at a higher hierarchy, as shown in Tab.2. Hence, the EEG channels are organized into two levels of hierarchy according to the above mentioned segmentation.
| Brodmann | EEG channel | Brodmann | EEG channel |
| area | number | area | number |
| 20 | 29 | 4 | 7 |
| 19 | 26 | 10 | 7 |
| 6 | 19 | 8 | 5 |
| 18 | 16 | 22 | 5 |
| 9 | 14 | 38 | 5 |
| 37 | 13 | 44 | 5 |
| 45 | 12 | 43 | 4 |
| 40 | 11 | 48 | 4 |
| 7 | 10 | 1 | 3 |
| 21 | 9 | 2 | 3 |
| 46 | 9 | 5 | 2 |
| 17 | 8 | 47 | 1 |
| 39 | 8 |
| Functional | Brodmann | EEG channel |
| substructure | area | number |
| Broca’s(B) | 44, 45 | 17 |
| Audition(A) | 22 | 5 |
| Cognition(C) | 9, 10, 46, 47 | 31 |
| Emotion(E) | 38 | 5 |
| Vision(V) | 17, 18, 19 | 50 |
| Vision-parietal(Vp) | 7, 39 | 18 |
| Vision-temporal(Vt) | 20, 21, 37 | 51 |
| Motor(M) | 4, 6, 8 | 31 |
| Sensory(S) | 1, 2, 5, 40 | 19 |
The hierarchical organization of EEG channels have two aspects, modular architecture of brain functional networks detected by fast GN algorithm and functional groups according to anatomical parcellation of brain cortex based on Brodmann area. Thus, the association of these two kinds of hierarchical organizations, e.g. the overlap between the communities of the channel sets and the functional groups, is a key question which is expected to shed lights onto the relation between brain function and structure.
III Empirical results
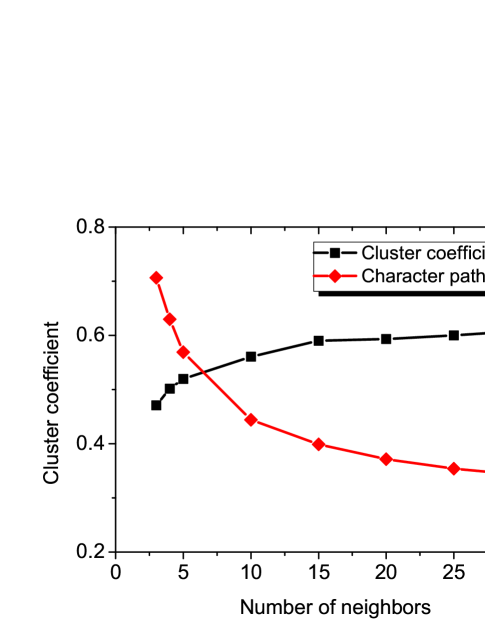
We calculate the phase-synchronization index matrix of all the sections which consist of continuously recorded multi-channel EEG time series. An average is performed over all twenty-five sections. Then the brain functional networks are generated using an alterable (the number of nearest neighbors). The average cluster coefficient (CC) and character path length (CPL) are computed as a function of (see in Fig. 1). The brain functional networks behave large CC and short CPL, which suggests the small-world property in consistency with previous works.
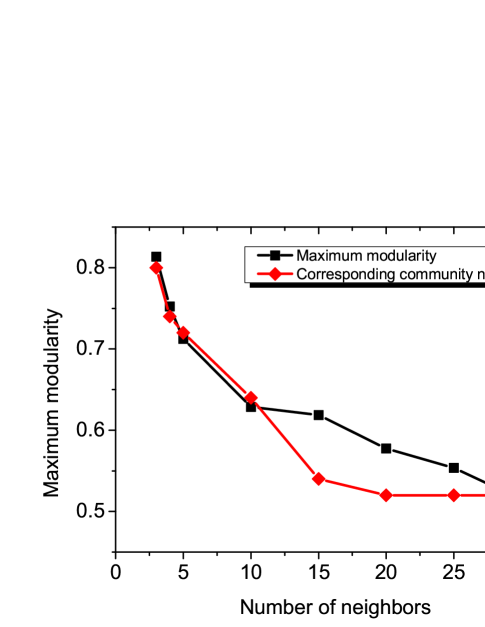
Community structure and modular architecture are two crucial properties of brain functional networks during visual task. The fast GN algorithm is applied to explore these hierarchical organizations of these networks. Results are shown in Fig. 2 for different , of which the minimum value is . Figure 2 concretely shows that maximum modularities monotonously decrease with , all above 0.5 even when , which obviously differs from that of randomly connected network. Furthermore, small maximum modularity also corresponds to large mean degree of network, which suggests that the more edges bridge the communities to reduce gaps of clusters and render community structure less visible. Obviously, the number of community corresponding to maximum modularity is also a monotonously decreasing function of . With these considerations in mind, we mainly investigate the community structure and modular architecture of brain functional network with .
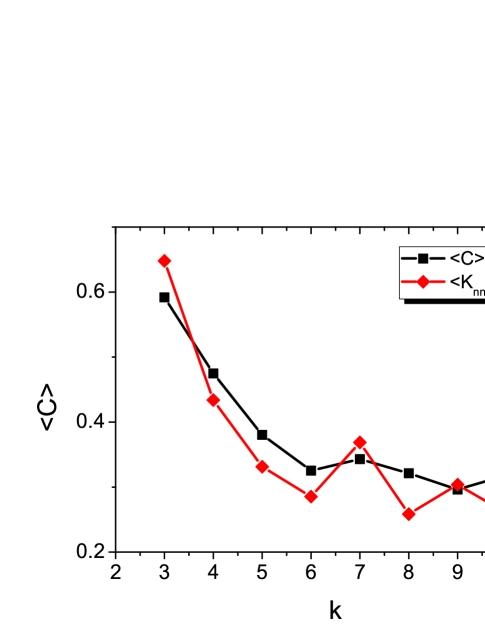
To better understand the architecture structure of brain functional network, we study the average cluster coefficient for vertices with degree . Their relation reveals a negative correlation, which suggests that low-degree vertices generally belong to well connected clusters while the neighbors of high-degree vertices belong to many different communities which are not directly connected among themselves, namely hierarchical organization (see Fig. 3). Simultaneously, the assortative mixing pattern (degree-degree correlation of vertices) is investigated by using a measure of average nearest-neighbor degree that defined as the average over vertices with degree (see Fig. 3). Degree mixing can be organized into two patterns: assortative behavior if increases with , which indicates that high-degree vertices are preferentially connected with other high-degree vertices, and disassortative behavior if decreases with , which denotes that links are more easily built between high-degree vertices and small ones. In Fig. 3, we find that decreases with , which indicates a disassortative behavior of brain functional network.
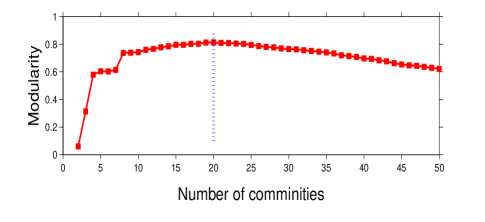
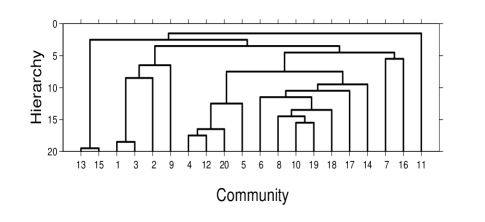
The community structure of brain functional network is further described by a dendrogram plot computed with fast GN algorithms, as shown in Fig 4. In Fig. 4, the number of community corresponding to maximum modularity is 20, which is marked by a dash-line. Thus, in Fig. 4, the dendrogram plot only shows hierarchical tree that splits the network into 20 communities. Note that we do not present the whole dendrogram plot so that the end points of hierarchical tree still denote communities with numeric labels from to that are randomly ordered in Fig. 4.
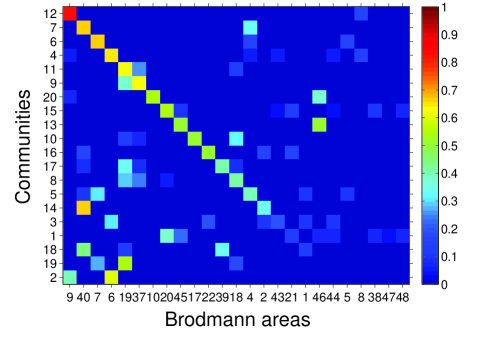
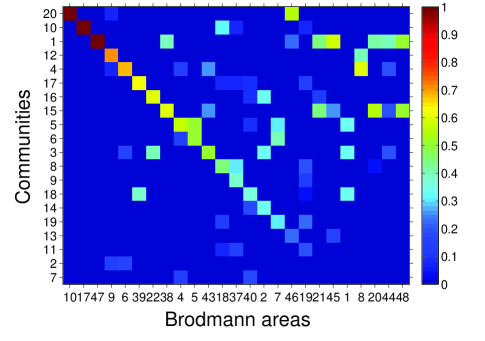
To further investigate the coincidence of the two kinds of hierarchical organizations, we compute the overlap between modular architecture of brain functional network and functional groups based on anatomy parcellation of brain cortex in two ways. On one hand, we check how many EEG channels of same community belong to the same function group, which is represented by the composition of community written as
| (3) |
On the other hand, we investigate whether EEG channels of the same functional group are exactly divided into an identical community, which is described by participation of functional group defined as
| (4) |
In Eqs. 3 and 4, and denote the channel set of community and functional group , respectively. If there is a perfect one-to-one correspondence between communities and functional groups, we will have and . Figure 5 shows the composition of the communities, which suggests that most of communities are mainly formed by channel sets that are restricted to the same Brodmann area. For instance, the community (numeric label) almost overlaps with Brodmann area , i.e. the channels belonging to the same function group (by anatomical parcellation) are densely connected, or coupled in the corresponding brain functional network. In Fig. 5(b), the participation of functional group reveals that most of channel sets restricted to the same Brodmann areas are divided into the same communities. In particular, Brodmann areas , , and are completely overlapped with the communities , , and (numeric labels), respectively. It is noticed that some channel sets of functional groups are divided into several large communities because Brodmann areas involved with these functional groups are distributed in both left and right cerebral hemisphere with much larger spatial distance which reduces the coupling strength among neurons. For instance, Brodmann area 21 is mainly divided into two larger communities with numeric labels and , which are distributed in left and right cerebral hemispheres, respectively. This explains why the one-to-one correspondence between communities and functional groups are not perfect (i.e. ).
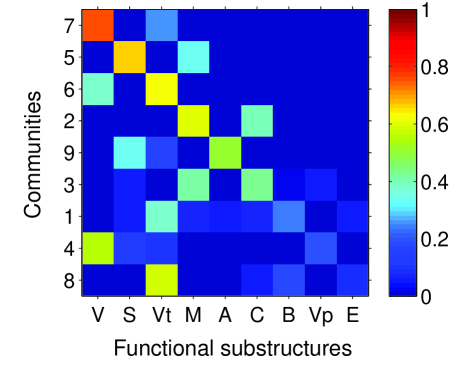
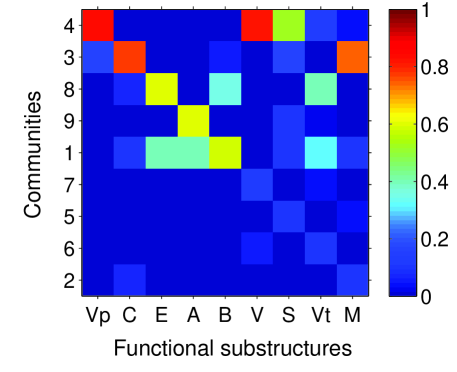
In a higher level of hierarchy, the coincidence of modular architectures (i.e. larger communities) of brain functional network and functional substructures (see Tab.2) of brain cortex is also studied in aforementioned ways. Concretely, the brain functional network is partitioned into 9 larger communities. The composition of the communities shows that the communities are mainly formed by channel sets associated with functional substructures like Vision, Sensory, Vision-temporal, Motor, which is well consistent with the visual task involved in visual, judgment and motor functions of brain (see Fig. 6(a)). For the participation of functional substructure, most of functional substructures are almost divided into unique communities, except for the Visual-temporal part, which is symmetrically distributed in two hemispheres and is separated into two communities, see Fig. 6(b).
In addition, the electrical activity of neuronal networks is known to oscillate at various frequencies and amplitudes. The densely interconnected oscillators in same communities will synchronize more easily than those in different communities, which suggests that the synchronization reveals hierarchical organization for a network with a nontrivial community structure Arenas2006 ; Zhou2006a ; Gardenes2007 ; Arenas2007 ; Yan2007 . Moreover, the simulation of neuronal activity based on anatomical cat brain network determines that the correlated clusters are consistent with anatomical areas of same brain functions zhou2006b ; Zemanova2006 ; zhou2007c . Thus, the coincidence of modular architectures of brain functional network and function groups of brain cortex at two levels of hierarchy suggests that the correlation of EEG time series in same functional groups is much stronger than that in different ones and the hierarchical organization of brain functional network may be a consequence of functional segmentation of brain cortex.
IV Conclusion
In conclusion, we have investigated the hierarchical organization of brain functional network derived from high-resolution synchronous EEG time series during visual task through defining vertices as EEG channels and evaluating connectivity between channels using a measure of phase synchronization. The resulting brain functional networks show common small-world property and community structure organized in hierarchical way. Meanwhile, by clustering EEG channels into functional groups based on anatomical parcellation of brain cortex, we find that the modular architectures of brain functional networks are in coincidence with these functional groups at different levels of hierarchy via computing overlap between communities of channel sets and functional groups. These interesting results suggest that population of neurons performing the same functions excite and inhibit in identical rhythms. This is reflected by that the correlation between pairs of EEG time series (channels) representing the neuroelectrical activity of same functional cortex region is enhanced during tasks related to vision, judgement and motor functions of brain. The structure-function relationship further reveals that the strong connection of channels and community formation in brain functional networks may be a consequence of functional segmentation of brain cortex.
Acknowledgements.
This work is supported by the National Natural Science Foundation of China under Grant Nos. 60874090, 60974079, 61004102. S-MC appreciates the financial support of K.C. Wong Education Foundation, China Postdoctoral Science Foundation, and the Fundamental Research Funds for the Central Universities.References
- (1) S. R. Cajal, Histology of the Nervous System of Man and Vertebrates, Oxford Univ. Press, New York, 1995.
- (2) L. W. Swanson, Brain Architecture, Oxford Univ. Press, Oxford, 2003.
- (3) E. Bullmore and O. Sporns, Nature Rev. Neurosci. 10, 1 (2009).
- (4) D.J. Watts and S.H. Strogatz, Nature 393, 440 (1998).
- (5) A. L. Barabási and R. Albert, Science 286, 509 (1999).
- (6) C. J. Stam, Neurosci. Lett. 355, 25 (2004).
- (7) V. M. Eguiluz, D. R. Chialvo, G. A. Cecchi, M. Baliki, and A. V. Apkarian, Phys. Rev. Lett. 94, 018102 (2005).
- (8) D. S. Bassett and E. Bullmore, The Neurosicentist 12, 512 (2006).
- (9) S. Achard, R. Salvador, B. Whitcher, J. Suckling, and E. Bullmore, J. Neurosci. 26, 63 (2006).
- (10) M. P. Van den Heuvel, C. J. Stam, M. Boersma, and H. E. Hulshoff Pol, NeuroImage 43, 528 (2008).
- (11) G. L. Gong, Y. He, L. Concha, C. Lebel, D. W. Gross, A. C. Evans, and C. Beaulieu, Cereb. Cortex 19, 524 (2009).
- (12) M. E. J. Newman and M. Girvan, Phys. Rev. E 69, 026113 (2004).
- (13) D. M. Wilkinson and B.A. Huberman, Proc. Natl. Acad. Sci. USA 101, 5241 (2004).
- (14) P. F. Jonsson, T. Gavanna, D. Zicha, and P. A. Bates, BMC Bioinf. 7, 2 (2006).
- (15) S. M. Cai, Y. B. Zhou, T. Zhou, and P. L. Zhou, Int. J. Mod. Phys. B 21(3), 433 (2010).
- (16) M. Girvan and M. E. J. Newman, Proc. Natl. Acad. Sci. USA 99, 7821 (2002).
- (17) A. Capocci, V. D. P. Servedio, G. Caldarelli, and F. Colaiori, Physica A 352, 669 (2005).
- (18) A. Arenas, A. Fernández, and S. Gómez, New J. Phys. 10(5), 053039 (2008).
- (19) J. Zhang, K. Zhang, X. Xu, C. K. Tse and M. Small, New J. Phys. 11, 113003 (2009).
- (20) J. Zhang, C. Zhou, X. Xu, and M. Small, Phys. Rev. E 82, 026116 (2010).
- (21) S. Fortunato, Phys. Rep. 486, 75 (2010).
- (22) R. Salvador, J. Suckling, M. R. Coleman, J. D. Pickard, D. Menon, and E. Bullmore, Cereb. Cortex 15, 1332 (2005).
- (23) L. Ferrarini, I. M. Veer, E. Baerends, M. van Tol, R. J. Renken, N. van der Wee, D. J. Veltman, A. Aleman, F. G. Zitman, B. Penninx, M. A. van Buchem, J. Reiber, S. Rombouts , and J. Milles, Hum. Brain Map. 30, 2220 (2009).
- (24) M. Chaveez, M. Valencia, V. Navarro, V. Latora, and J. Martinerie, Phys. Rev. Lett 104, 118701 (2010).
- (25) F. J. P. Langheim, A. C. Leuthold, and A. P. Georgopoulos, Proc. Natl. Acad. Sci. USA 103, 455 (2006).
- (26) H. B. Lu, Y. T. Zou, H. Gu, J. A. Waltz, C. A. Scholl, W. Rea, Y. H. Yang, and E. A. Stein, Proc. Natl. Acad. Sci. USA 104, 18265 (2007).
- (27) Introduction to Brodmann area, http://en.wikipedia.org/wiki/Brodmann_area
- (28) A Human Electrophysiology Data Resource, http://sccn.ucsd.edu/eeglab/data/headit.html.
- (29) S. Makeig, M. Westerfield, T. P. Jung, S. Enghoff, J. Townsend, E. Courchesne, and T. J. Sejnowski, Science 295, 690 (2002).
- (30) S. Makeig, A. Delorme, M. Westerfield, J. Townsend, E. Courchense, and T. J. Sejnowski, PLOS Biology 2, 742 (2004).
- (31) Y. Kuramoto, Chemical Oscillations, Waves, and Turbulence, Springer, Berlin, 1984.
- (32) M. K. S. Yeung and S. H. Strogatz, Phys. Rev. Lett. 82, 648 (1999).
- (33) M. Timme, F. Wolf and T. Geisel, Phys. Rev. Lett. 89, 258701 (2002).
- (34) D. Gabor,“Theory of information”, J. IEE, 1946.
- (35) B. Schelter, M. Winterhalder, R. Dahlhaus, J. Kurth, and J. Timmer, Phys. Rev. Lett. 96, 208103 (2006).
- (36) X. Xu, J. Zhang, and M. Small, Proc. Natl. Acad. Sci. 105, 19601 (2008).
- (37) Introduction to MRIcro, http://www.sph.sc.edu/comd/rorden/mricro.html.
- (38) Download software from website, http://www.fil.ion.ucl.ac.uk/spm/software/spm8/.
- (39) A. Arenas, A. Diaz-Guilera, and C. J. Perez-Vicente, Phys. Rev. Lett. 96, 114102 (2006).
- (40) C. S. Zhou and J. Kurths, Chaos 16, 015104 (2006).
- (41) J. Gomez-Gardenes, Y. Moreno, and A. Arenas, Phys. Rev. Lett. 98, 034101 (2007).
- (42) A. Arenas and A. D az-Guilera, Euro. Phys. Jour. B 143(1), 19 (2007).
- (43) G. Yan, Z.-Q. Fu, J. Ren, and W. X. Wang, Phys. Rev. E 75, 016108 (2007).
- (44) C. S. Zhou, L. Zemanová, G. Z. López, C. C. Hilgetag, and J. Kurths, Phys. Rew. Lett. 97, 238103 (2006)
- (45) L. Zemanová, C. S. Zhou, and J. Kurths, Physica D 224, 202 (2006).
- (46) C. S. Zhou, L. Zemanová, G. Z. López, C. C. Hilgetag, and J. Kurths, New J. Phys. 9, 178 (2007).