Shocks and Cavities from Multiple Outbursts in the Galaxy Group NGC 5813:
Abstract
We present results from Chandra observations of NGC 5813, the dominant central galaxy in a nearby galaxy group. We focus on three main results. 1) The diffuse gas shows clear signatures from three distinct outbursts of the central AGN, with three pairs of roughly collinear cavities. The inner two cavity pairs are associated with unambiguous elliptical shock fronts, with Mach numbers and for the inner and outer shocks, respectively. 2) The mean power of the two most recent outbursts differs by a factor of six, indicating that the mean jet power varies over long ( yr) time scales. 3) The heating from the shocks alone is sufficient to balance radiative cooling of the gas within at least the central 10 kpc, allowing feedback to operate isotropically at small radii.
keywords:
galaxies: active — galaxies: clusters: general — galaxies: groups: individual (NGC5813) — galaxies: individual (NGC5813) — X-rays: galaxies1 Introduction
Early Chandra and XMM-Newton observations revealed that the amount of gas radiatively cooling to low temperatures is less than what is predicted by the classical cooling flow models (David et al., 2001; Peterson et al., 2001), the implication being that the central gas must be heated. A promising heating candidate is feedback from energy injection by the central AGN of the cD galaxy (for a review see McNamara & Nulsen, 2007). Generally, studies have found that the internal energies and ages of these cavities give AGN kinetic powers that are sufficient, in principle, to balance cooling (e.g., Bîrzan et al., 2004). However, it is unclear how the cavity internal energy is released to heat the ICM near the central AGN. Outburst shocks, driven by the expansion of cavities when they are first inflated, will also work to heat the central ICM. Here we use Chandra observations of the galaxy group NGC 5813 to study AGN feedback in detail.
2 NGC 5813
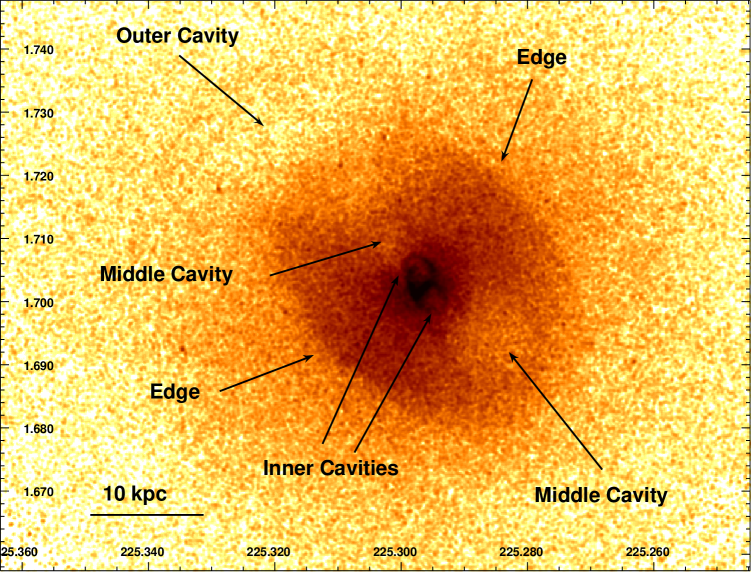
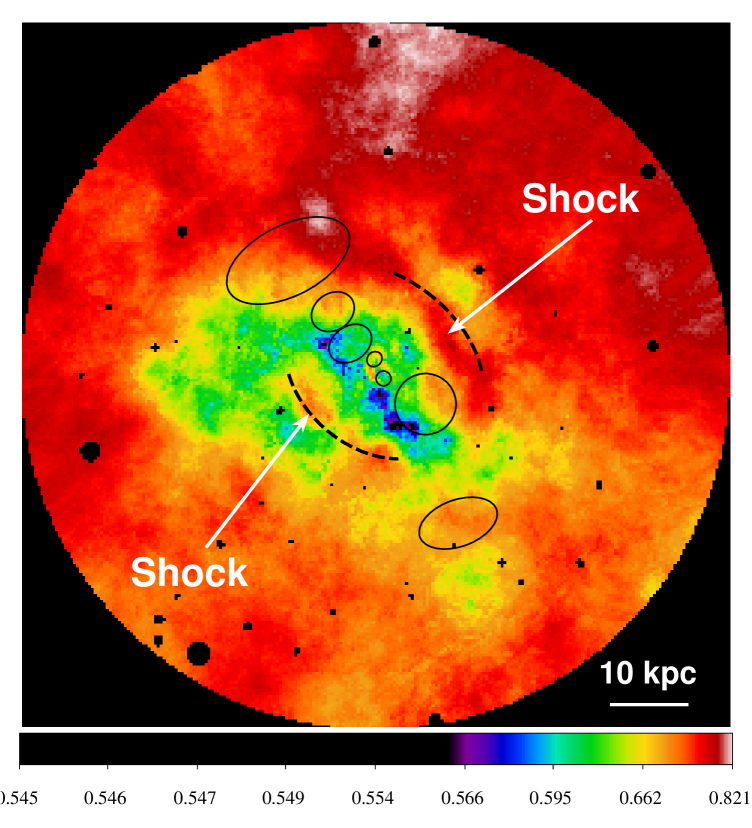
NGC 5813 (UGC 09655) is the central dominant member of a nearby (redshift ) subgroup in the NGC 5846 galaxy group (Mahdavi et al., 2005). It was observed for a total of 150 ks with the Chandra X-ray Observatory. Details of the data analysis are presented in (Randall et al., 2011). The Chandra image (Fig. 1) shows three pairs of collinear cavities. The inner two pairs are surrounded by sharp, elliptical surface brightness edges. The corresponding temperature map, shown in Fig. 2, reveals hot gas just inside the bright edges, indicating that these are shock fronts. Detailed temperature and density profiles across the edges confirm that they are shocks, with Mach numbers and for the 10 kpc and 1.5 kpc shocks, respectively (Randall et al., 2011).
3 Discussion
For each outburst, the total energy is the internal energy of the cavities plus the shock energy (the radiative energy output is negligible). The cavity energy is estimated as , where is the gas pressure at the radius of the cavity. The shock energy is estimated by matching 1D hydrodynamic point explosion simulations with the X-ray image. We find that the mean power of the current outburst is less than that of the previous outburst by about a factor of six ( erg/s vs. erg/s). This demonstrates that the mean jet power of the central AGN varies significantly over the timescale between outbursts ( yr).
The heating of the ICM locally at each shock front can be determined from the measured shock properties. To offset radiative cooling in the gas, the heating mechanism is required to increase the gas entropy . Expressed as a fraction of the local thermal energy of the gas , the heat input at the shock front is . We find this fraction to be 10% for the inner and 5% for the outer shock, respectively. Therefore, 1/0.1 = 10 (1/0.05 = 20) shocks are needed per local cooling time of the gas to offset radiative cooling at the 1.5 kpc (10 kpc) shock front. The cooling time of the gas is yr ( yr), so that the outburst interval of yr gives 20 (90) shocks per cooling time. Thus, the heat input from shocks alone is sufficient to balance radiative cooling of the gas within at least the central 10 kpc.
References
- Bîrzan et al. (2004) Bîrzan, L. et al. 2004, ApJ, 607, 800
- David et al. (2001) David, L. P. et al. 2001, ApJ, 557, 546
- Mahdavi et al. (2005) Mahdavi, A., Trentham, N., & Tully, R. B. 2005, 130, 1502
- McNamara & Nulsen (2007) McNamara, B. & Nulsen, P. J. E. 2007, ARA&A, 45, 117
- Peterson et al. (2001) Peterson, J. R. et al. 2001, A&A, 365L, 104
- Randall et al. (2011) Randall, S. W. et al. 2011, ApJ, 726, 86