A large HPGe detector for the non-destructive radioassay of an ultra-low-background counting facility
Abstract
We present the use of a low background counting facility, equipped with a p-type 80% relative efficiency HPGe detector, protected by active and passive shielding, and large enough to count a 10” photo-multiplier tube (PMT). A GEANT4 Monte-Carlo of this detector was developed and tuned to 3% accuracy. We report the U, Th, and K content in three different types of PMTs used in current neutrino experiments, with accuracies of ppb for U and Th and of ppm for K.
keywords:
HPGe detector , gamma spectrometry , low background , Monte-Carlo simulation , photomultiplier tube.1 Introduction
The aim of this paper is to present the use of a High Purity Germanium gamma-ray detector (HPGe) in an underground counting room at Saclay near Paris, France, along with a Monte-Carlo simulation and analysis software suite. This low-background facility is a joint project between the University of California at Davis and the Commissariat à l’Energie Atomique et aux Energies Alternatives (French Atomic Energy and Alternative Energies Commission or CEA). The counting room is being used by the Double-Chooz (Ardellier et al., 2006) and Nucifer (Porta, 2010) neutrino detection projects, whose low radioactivity background requirements warrant precise radioassays of all detector building materials. Both detectors use large volumes of liquid scintillator and detect light pulses with large area photo-multiplier tubes (8 or 10 inch tubes). The large inner volume (27 cm diameter by 38 cm height) of the lead shield surrounding the HPGe detector was used to radioassay large samples which could not fit in other counting rooms from collaborating institutes, especially photo-multiplier tubes (PMTs). Furthermore, because of its closeness with the Chooz site (Ardennes, France), this counting room was used extensively during the detector’s construction.
We will first present a detailed description of the counting room’s set up, and then show the details of the development and tuning of a GEANT4-based Monte-Carlo simulation (Agostinelli et al., 2003) of the HPGe detector. The simulation was used to predict the gamma-ray detection efficiency at all energies for a variety of geometries. Finally we will detail the simulation and radio-assay results of three photo-multiplier tubes (PMT), used in Double-Chooz, Nucifer and Antares (Ageron et al., 2009). The simulation allows a complete description of the geometry of complex objects, improving the accuracy of the radioassay. In turn these measurements were used to predict the background from radioactivity in the neutrino detectors, improving their sensitivities.
2 Description of the detection system
2.1 HPGe crystal
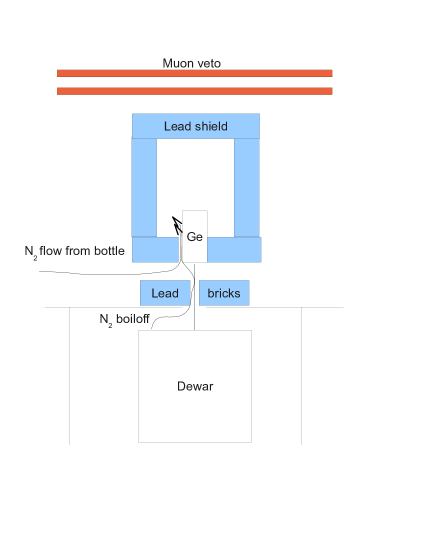
The HPGe detector is a p-type coaxial detector of 80% relative efficiency, manufactured by ORTEC. It is mounted on a vertical cryostat, 30 cm directly on top of a nitrogen dewar. The crystal and its preamplifying electronics are enclosed in a high-purity copper endcap, and the crystal is protected by a commercial lead shield from ORTEC described below. Note that the position of the crystal within the shield is not fixed: it can be moved up and down to increase the available space in the counting chamber. In this work the crystal was placed as low as possible, with the bottom edge of the endcap flush with the bottom of the shield (see figure 1). This configuration is non standard and increases the amount of background since the shielding is less efficient, but it allows us to fit a 10” PMT inside the shield.
The HPGe detector is connected to an ORTEC DSPEC jr 2.0 digital spectrometer, and ORTEC’s MAESTRO 32 program is used for data acquisition. Spectra are then translated to ASCII and processed with custom-made programs based on ROOT(Brun and Rademakers, 1997). Automatic pulse shaping and pole-zero correction settings were used, and the energy scale was calibrated using radioactive sources.
2.2 Underground laboratory at Saclay
The whole counting facility is placed underground in an alcove of an old experimental hall at the Saclay center of the Commissariat à l’Énergie Atomique et aux Énergies Alternatives (French Atomic Energy and Alternative Energies Commission or CEA) near Paris, France. This underground hall previously housed an electron accelerator (Accélérateur Linéaire de Saclay or ALS). After its decommissioning in the 1990s, the hall was cleared and is no longer considered a radioactive area. However some of the concrete in the walls and ground has a slight residual activity. The impact of this ambient noise has been studied, and reduced as much as possible with lead shielding.
The main advantages of this experimental hall are in its availability at no cost, great proximity and ease of access for our team. In addition, it has a fairly large concrete and soil overburden, reaching at least 15 meters of water equivalent (mwe) in all directions.
2.3 Background rejection methods
Unshielded measurements with a small, portable germanium counter inside the hall revealed the main -ray lines to be 152Eu and 60Co. These two elements have been shown (Ladvanskij et al., 1989) to be produced by activation of concrete, which did occur to some extent when an accelerator was in use in this hall. The walls also show strong 40K and 208Tl activity. In order to protect the spectrometer from this ambient noise, a lead shield from ORTEC was used. This lead shield is cylindrical, and 10 cm thick, with an inner 3-mm copper lining. It protects the crystal from ambient gamma radiation on all sides, except the bottom (see figure 1), which is therefore sensitive to gamma rays from the ground and cryostat. In order to reduce this background, two layers of lead bricks were placed on top of a table located between the cryostat and the crystal. The table and lead shield have circular holes, allowing the cryostat to poke through (see figure), and the bricks were arranged so that only a small gap around the cryostat is left unshielded.
Since our shield is not airtight, radon gas is a troublesome source of background, as 214Pb and 214Bi cause many strong gamma lines in our spectra. In order to reduce this background, the lead shield was lined with 5-mm thick rubber insulation along its main openings. The bottom of the shield was covered with a sealed plastic sheet, and the boil-off nitrogen gas from the dewar was directly piped into the shield. A small permanent flow of nitrogen gas at 190 mL/min is constantly maintained using bottles. With these measures we observe a reduction of a factor of roughly 7 in radon activity, however radon gas remains a significant background with typically counts/s in the 609 keV 214Bi line. The detector, cryostat and electronics are also kept inside an ISO 7 clean tent to reduce the amount of dust that enters the experimental area.
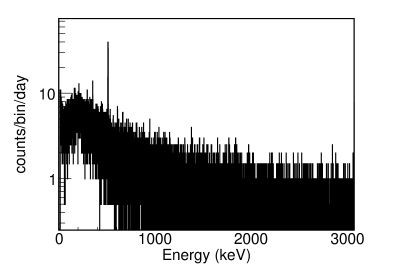
Finally, the cosmic ray contribution is reduced by an active veto made of two plastic scintillator panels, inch thick. These two panels are both laid on top of the lead shield, centered around it, one above the other. They are each viewed by a pair of 2-inch PMTs. The output of each PMT is sent to a constant fraction discriminator, and the OR of the discriminated signals is used to generate a long TTL gate with a Lecroy 222 gate generator. Pulses from the HPGe detector occurring a few s after the veto was triggered are vetoed, taking only those in anti-coincidence with the TTL gate. The veto’s average trigger rate is roughly 600 Hz, leading to 0.6% dead-time. The observed reduction between veto on and veto off is a factor of about 1.8 on the 511 keV peak (see figures 2 and 3) but the overall effect on the spectrum is small. Improving the light collection system could lead to a higher muon detection efficiency and therefore more efficient vetoing, consistent with what has been reported by many authors.
With all these rejection techniques, our typical background spectrum obtained with an empty counting chamber is shown in figure 3.
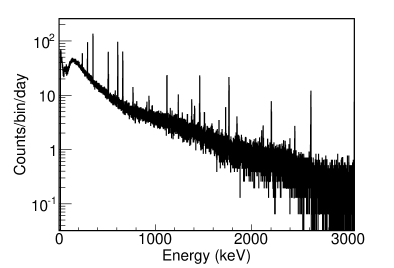
The overall shape is characteristic of muon-induced background (Semkow et al., 2002), with several prominent X and -ray lines. The main lines that can be observed are those of 222Rn daughters (214Pb and 214Bi) as well the annihilation line at 511 keV, caused by cosmic rays. Below 100 keV, Pb-X-rays are strongly reduced by the copper lining of the shielding, at the cost of increasing the background at higher energies (Canberra Industries, 1995). 40K and 208Tl are also clearly visible. A small contamination by 137Cs can also be seen in this figure. This comes from the use of contaminated lead bricks in an experiment in the hall, which were promptly removed, but left small trace contamination. Our background rate varies from 0.2 to 0.3 counts/second/100 cm3 of detector between 50 and 2700 keV, for a counting chamber with a total volume of about 22 L.
3 Analysis method
A dedicated spectral analysis program was developed for this analysis. It is written in Python and uses ROOT (Brun and Rademakers, 1997) to perform fits and histogram-based calculations. First, a peak finding algorithm identifies good peak candidates based on statistical and goodness of fit criteria. This algorithm is based on the one from GRABGAM described in Winn (2000).
For each identified peak or user-input region of interest (ROI), gross counts and net counts are calculated, as well as their respective errors. To obtain net counts, continuum subtraction is performed using the formulas from Morel et al. (1998), which take into account a smoothly varying background with different heights before and after the peak. Using a database of X- and gamma-ray peaks, each peak is identified.
When performing an actual radioassay, the sample’s spectrum and a “blank spectrum” (taken immediately before or after the measurement) are compared, and statistical calculations are carried out to extract either an upper limit or a measurement on each relevant gamma ray line. The results are presented as in GRABGAM (Winn, 2000), but the usual Currie (1968) minimum detectable activity (MDA) and decision thresholds are also computed. The program is fully automatic and produces a report in PDF format.
An important input for accurate results is the detection efficiency as a function of gamma ray energy, which we obtain with the Monte-Carlo simulation described in the next section.
4 Tuning the Monte-Carlo simulation
The subject of HPGe Monte-Carlo tuning is an active topic in the literature. The basic technique is always the same: using a Monte-Carlo simulation software tool, the geometry and materials of the germanium crystal and all surrounding layers are coded. At first, the manufacturer’s dimensions are used, but they are usually not known precisely enough, leading to large data/simulation discrepancies. Using measurements with various point sources, the simulation is tuned by varying several geometry parameters until satisfactory agreement with data is reached. For our material screening purposes, Monte-Carlo accuracy of under 5% is considered sufficient.
Among the extensive literature on this topic, we have tried to follow the method of Budjas et al. (2009), outlining the tuning of a smaller p-type detector similar to the one we use.
4.1 Implementation of the geometry in the Monte-Carlo simulation
We used the GEANT4 (Agostinelli et al., 2003) simulation package developed at CERN for our Monte-Carlo (MC) simulation. Users are required to precisely describe the geometry and material of each detector component in the program’s code. The package can then calculate the detector’s response to the passage of particles, propagating each particle step by step and taking into account all physics effects, including secondary particle production.
The active detector is simply a volume of pure germanium. The detector response is simulated using the measured FWHM as a function of energy, and is assumed to be Gaussian. The energy deposited in the active volume by ionizing particles is added up, and then smeared using the measured resolution. All MC peaks therefore have Gaussian shapes, which is only approximately correct.
A critical part of the simulation is the geometry of the detector, its mount cup and end cap, as well as any other material that stands between the crystal and the source. Several authors, e.g. Hardy et al. (2002), explain how they described the bulletized edge of their germanium crystal by approximating the detector with stacked cylinders of varying radii. In this work we chose to describe the germanium crystal as a Boolean union of two cylinders and one torus. The bulletized edge’s radius of curvature (small radius of the torus) was set to 0.8 cm, as reported on the manufacturer’s data sheet.
4.2 Dead layer tuning
The “dead layer” is an inactive germanium layer on the surface of p-type crystals, usually about 700 m thick, caused by the drifting of Li ions to dope the semi-conductor. Its thickness has a strong effect on the detector’s efficiency below a few hundred keV and is the main tuning parameter in our simulation.
In order to describe the dead layer, a “daughter volume” of the germanium crystal with the same shape, but slightly smaller, adjustable dimensions was implemented and declared to be the active volume. The small outer region of the germanium volume which does not belong to the active daughter volume is the dead layer of the simulated detector. The main advantage of this method is that its dimensions can then be easily changed without complicated geometry calculations.
Using a 3.33 MBq 241Am-Be source, we tuned the thickness of this region, following the method outlined in Budjas et al. (2009). The source itself was not precisely calibrated, but the method uses the ratio between several lines, eliminating the need for precise source calibration. The source was placed on a custom made holder, 26.0 cm above the center of the detector’s endcap, and left to count for a few hours to accumulate enough statistics for a negligible statistical error. The dead time recorded by the spectrometer () was deemed small enough to trust the measurements. No significant peak-sum effect was found.
We measured the full-energy peak efficiency of the 59 keV line. Our detector having good enough energy resolution, we could distinguish a multiplet with four lines, at 96 keV, 99 keV, 101 keV, and 103 keV, the two lines at 99 keV and 103 keV being the strongest. In order to avoid systematic effects coming from line separation, we used a region of interest (ROI) spanning all four lines, from 95 keV to 105.5 keV, and performed continuum subtraction on the whole multiplet. We computed the efficiency ratio between the 59 keV line and the multiplet, , to cancel the systematic error from absolute source calibration as outlined in Budjas et al. (2009).
Since we were interested in gamma ray lines below 150 keV, any material located along the path of the photons had to be taken into account. We carefully implemented the 5 mm thick plastic source housing, with two 1 mm thick Be sheets surrounding the 11 mm diameter Am deposit. The source was laid flat on top of an adjustable, 2 mm thick plastic holder, which was also measured with calipers and implemented in the simulation. Having observed wrong results in the GEANT4 simulation of the gamma lines associated with 241Am decays111This has also been reported in Budjas et al. (2009), and has apparently been fixed in later versions of GEANT4. Other elements are unaffected and are in agreement with ENSDF., we implemented our own Am generator, using the main X and gamma lines from ENSDF databases, and neglecting all cascade and angular correlation effects (such effects are negligible considering the very small branching ratios of all lines above 59 keV).
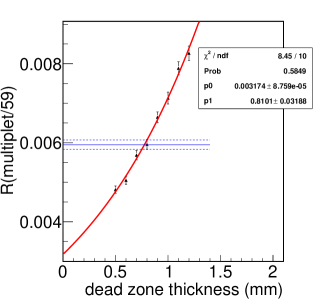
Figure 4 shows the variation of the ratio with dead layer thickness, after reducing the copper layer. The data measurement with its error bar is also shown (see discussion below for our systematic error estimation). The best-fit dead layer is mm thick, in good agreement with the manufacturer’s rough estimate of 700 microns. During this run the side dead layer thickness was kept fixed to its nominal value. The error is statistical only at this stage.
We placed another Am source (40 kBq, guaranteed with 5% uncertainty by its vendor) on one side of the crystal, 1 cm from the side of copper endcap. The same methods yields mm thickness for the side dead layer, having fixed the top dead layer to the previous best fit.
Iterating the procedure once more shows that the two previously found values are stable and correspond to the best fit.
4.3 Systematic error budget
Several sources of systematic uncertainty affect our measurements. We estimate the distance from the source to the endcap with a 1 mm uncertainty, and the distance to the center with a 3 mm inaccuracy (conservatively). We varied the source position in the simulation by mm and used the count-rate variation (4.3%) as the systematic error coming from inaccurate distance measurements. The plastic thickness of the source housing and of the source holder was estimated with a 0.3 mm accuracy. Using variations of this amount in the simulation led to a 1.4% variation of the count-rate. The high activity of the source causes a dead-time below 10%. Any systematic error in the dead-time measurement affects all lines equally, therefore this source of error does not contribute to the total error. Summing up the different contributions in quadrature, we estimate that our dead zone measurement has a 5% systematic error.
4.4 Tuning of the active volume
After tuning the dead layer around the crystal, we took spectra using the following sources:
-
1.
22Na, kBq
-
2.
60Co, kBq
-
3.
137Cs, kBq
-
4.
228Th, kBq
All sources except the thorium source are from the same manufacturer (LEA-CERCA) and were purchased and calibrated to with 2% precision by the manufacturer in March 2009. They have the same housing: a plastic cylinder 25 mm high and 9 mm in diameter. The active area is circular and flat, located 1 mm from one end of the cylinder, and is 7 mm in diameter. The 228Th source is a plastic cylinder, 25.4 mm in diameter and 6.35 mm high. The active area is 5 mm in diameter and 3.18 mm high, encased in the plastic housing. It was purchased in July 2002 and is guaranteed by the manufacturer to be known to better than 3.3%.
We used GEANT4’s radionuclide decay module to simulate the relevant gamma ray lines. For thorium this includes all its daughter nuclei.
All sources were uncollimated. The first three were placed 26.0 cm above the center of the detector endcap, and the thorium source was placed 8.0 cm above the detector endcap. All were placed on the same plastic holder as the AmBe source used at the previous stage. The sources’ plastic housings as well as the holder were simulated.
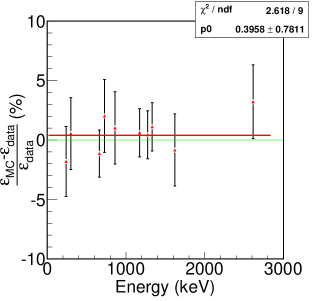
We compared the full energy peak efficiencies in the data and in the Monte-Carlo simulations, and found a mean negative bias of about -5% in the simulation compared to the data. This shows that at this stage, after tuning of the dead zone, our simulation was underestimating the efficiency of the crystal by a few percent. As explained by other authors (e.g. Hurtado et al. 2004), this is a sign that the active volume of the germanium crystal is not well known and should also be tuned.
In order to compensate for the higher observed efficiency, we increased the active volume in the simulation by reducing the radius of the borehole and enlarging the radius of the whole detector. We found that a tuned borehole radius of 3.0 mm (instead of the nominal 4.5 mm) and a radius of 41.1 mm (instead of the nominal 40.9 mm) reduced the negative bias to (best fit to a constant), over an energy range covering 300 keV to 2.6 MeV, sufficient for our radioassay measurements. The results of the tuning are shown in figure 5. With these parameters, the active volume of the germanium crystal is 362.5 cm3.
At this stage, the efficiency of the detector is known to better than 3% (since all points are within the lines), which is sufficient for our needs.
5 Application to the radioassays of photo-multiplier tubes
After tuning the detector’s Monte-Carlo simulation to the required accuracy, we used the large counting chamber inside the shield to radioassay three photo-multiplier tubes (PMT). One is an 8-inch, Hamamatsu R5912 tube and the other two are 10-inch, Hamamatsu R7081 tubes. They are used respectively in the Nucifer (Porta, 2010), Double-Chooz (Ardellier et al., 2006) and Antares (Ageron et al., 2009) experiments. Both Nucifer and Double-Chooz PMTs are low-background, using specially chosen glass to lower its radioactive contents, while the Antares PMT is a regular version. According to the manufacturer’s data sheets both tube sizes have similar performance.
It is of course possible to perform accurate radioassays of PMT parts, for example using crushed glass placed in a container with well known efficiency. However, such large PMTs cost several thousand US dollars apiece, and are not easy to dismantle. Indeed in many neutrino experiments PMTs represent a large fraction of the experiment’s budget. The method presented here has the advantage of being non-destructive and does not affect the PMT’s performance.
All PMTs were placed with the curved glass surface laid directly on top of the copper endcap, held vertically in place using a small acrylic holder. A special blank run, with only the acrylic holder inside the shield, was used in order to perform background subtraction.
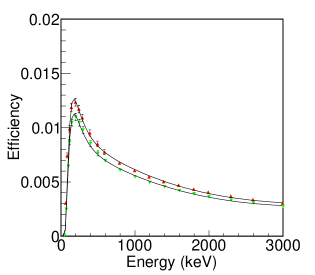
A complete geometrical model of the PMT’s outer glass surface was implemented using geometrical code from GLG4sim (Horton-Smith et al., 2006), which is used in several neutrino detector simulation codes. It is well known that especially in large PMTs, glass is the dominant source of radioactive background.
We assumed that radioelements were uniformly distributed in the PMT glass, radiating -rays isotropically, and obtained efficiency curves for the experiment, which can be seen in figure 6.
For each PMT, our peak finding algorithm was able to identify the main lines from natural radioactivity, namely the U series (226Ra, 214Pb, 214Bi), the Th series (212Pb, 208Tl), and natural K. As expected, no other radioelements were found. For each line, a 4 keV-wide interval around each peak was used to determine the net count rate, and eventually the activity. The statistical treatment is that of Currie (Currie, 1968). We assumed that all decay chains were at secular equilibrium. Tables 1,2 and 3 summarize the measurements for each of the decay series in each PMT. When no measurement can be made, we report the detection limit at 95% CL. The decision threshold is also at 95% CL.
The 226Ra line at 186.2 keV is so close to the 185.9 keV line of 235U as to be indistinguishable by our detector. Assuming that PMTs are contaminated with natural uranium containing 0.072% of 235U, it can be determined that 43% of the counts in the 186 keV peak can be attributed to 235U. We have used this correction in order to obtain the 238U contents from the 186 keV line in our samples.
Our measurements show that by choosing low background glass, the K content is reduced by a factor of 7, while the Th content is lowered by a factor of 2. The observed uranium content in low background glass depends on the PMT, but is roughly 2.5 times lower than in standard glass.
These measurements can be used in present or future neutrino experiments as inputs for their background estimations. In experiments with very stringent background requirements such as Double-Chooz, choosing low background glass is essential.
| -lines | Decay chain | Measurement in mBq/kg (fraction) |
|---|---|---|
| 226Ra at 186 keV | 238U | ( ppb) |
| 214Pb at 295, 352 keV | 238U | ( ppb) |
| 214Bi at 609, 1120, 1765 keV | 238U | ( ppb) |
| 208Tl at 2615 keV | 232Th | ( ppb) |
| 40K at 1460 keV | 40K | ( ppm) |
| -lines | Decay chain | Measurement in mBq/kg (fraction) |
|---|---|---|
| 226Ra at 186 keV | 238U | ( ppb) |
| 214Pb at 295, 352 keV | 238U | ( ppb) |
| 214Bi at 609, 1120, 1765 keV | 238U | ( ppb) |
| 208Tl at 2615 keV | 232Th | ( ppb) |
| 40K at 1460 keV | 40K | ( ppm) |
| -lines | Decay chain | Measurement in mBq/kg (fraction) |
|---|---|---|
| 226Ra at 186 keV | 238U | ( ppb) |
| 214Pb at 352 keV | 238U | ( ppb) |
| 214Bi at 609, 1120, 1765 keV | 238U | ( ppb) |
| 208Tl at 2615 keV | 232Th | ( ppb) |
| 40K at 1460 keV | 40K | ( ppm) |
6 Conclusion
In this work we have presented our low background facility, located near Paris in an underground hall formerly used for accelerator physics. Low background rates of counts/second/100 cm3 were reached with various rejection techniques, even with our large counting chamber. Background rejection could be further improved with a more efficient active muon veto, covering all sides of the detector, and also with an improved radon flushing system in the clean room. We developed a Monte-Carlo simulation for the p-type HPGe detector, and tuned several geometry parameters to data obtained with point sources, reaching an accuracy on the efficiency better than 3% over the relevant energy range. We then used the simulation to calculate the efficiency of detection for gamma rays produced inside the glass of large photomultiplier tubes from three neutrino detection projects, and measured the U, Th and K contamination inside the glass, with an accuracy of ppb on the thorium and uranium contents, and of 15 ppm on the potassium content.
7 Acknowledgements
We are very grateful to CEA/Saclay IRFU for their loan of the ALS facility and for their support of this project, of Double-Chooz and of Nucifer. In particular we would like to thank J.-l. Fallou, A. Le Saux and M. Mur. We thank the Antares Collaboration for their loan of a 10” PMT. We are also grateful to M. Hofmann (TUM) for sharing his simulation code in the early stages of this work. This project was made possible in part thanks to the Regents of the University of California’s financial support. We would like to thank H. Simgen (MPIK) for his advice, as well as V. Durand, S. Hervé, C. Jeanney and P. Starzynski for their help with the muon veto.
References
- Ageron et al. (2009) Ageron, M., et al., 2009. Performance of the first antares detector line. Astroparticle Physics 31, 277 – 283.
- Agostinelli et al. (2003) Agostinelli, S., et al., 2003. GEANT4: A simulation toolkit. Nucl. Instrum. Meth. A506, 250–303.
- Ardellier et al. (2006) Ardellier, F., et al., 2006. Double Chooz: A search for the neutrino mixing angle hep-ex/0606025.
- Brun and Rademakers (1997) Brun, R., Rademakers, F., 1997. Root - an object oriented data analysis framework. Nuclear Instruments and Methods in Physics Research Section A: Accelerators, Spectrometers, Detectors and Associated Equipment 389, 81–86.
- Budjas et al. (2009) Budjás, D., Heisel, M., Maneschg, W., Simgen, H., 2009. Optimisation of the mc-model of a p-type ge-spectrometer for the purpose of efficiency determination. Applied Radiation and Isotopes 67, 706 – 710. 5th International Conference on Radionuclide Metrology - Low-Level Radioactivity Measurement Techniques ICRM-LLRMT’08.
- Canberra Industries (1995) Canberra Industries, 1995. Ultra low-background detector systems. Canberra Application Note CAN0012.
- Currie (1968) Currie, L.A., 1968. Limits for qualitative detection and quantitative determination. Analytical Chermistry 40, 586.
- Hardy et al. (2002) Hardy, J.C., Iacob, V.E., Sanchez-Vega, M., Effinger, R.T., Lipnik, P., Mayes, V.E., Willis, D.K., Helmer, R.G., 2002. Precise efficiency calibration of an hpge detector: source measurements and monte carlo calculations with sub-percent precision. Applied Radiation and Isotopes 56, 65 – 69.
- Horton-Smith et al. (2006) Horton-Smith, G.A., et al., 2006. Introduction to glg4sim.
- Hurtado et al. (2004) Hurtado, S., García-León, M., García-Tenorio, R., 2004. Geant4 code for simulation of a germanium gamma-ray detector and its application to efficiency calibration. Nuclear Instruments and Methods in Physics Research Section A: Accelerators, Spectrometers, Detectors and Associated Equipment 518, 764 – 774.
- Ladvanskij et al. (1989) Ladvanskij, P.A., Nazarov, V.M., Stefanov, N.I., Frontasyeva, M.V., 1989. Neutron activation analysis for determination of induced radioactivity in concrete of nuclear reactor shielding. Journal of Radioanalytical and nuclear chemistry 131, 261 – 270.
- Morel et al. (1998) Morel, J., Etcheverry, M., Riazuelo, G., 1998. Uranium enrichment measurement by x- and -ray spectrometry with the urados process. Applied Radiation and Isotopes 49, 1251 – 1257.
- Porta (2010) Porta, A., 2010. Reactor neutrino detection for non proliferation with the Nucifer experiment. J. Phys. Conf. Ser. 203, 012092.
- Semkow et al. (2002) Semkow, T.M., Parekh, P.P., Schwenker, C.D., Khan, A.J., Bari, A., Colaresi, J.F., Tench, O.K., David, G., Guryn, W., 2002. Low-background gamma spectrometry for environmental radioactivity. Applied Radiation and Isotopes 57, 213 – 223.
- Winn (2000) Winn, W.G., 2000. Grabgam: a gamma analysis code for ultra-low-level hpge spectra. Nuclear Instruments and Methods in Physics Research Section A: Accelerators, Spectrometers, Detectors and Associated Equipment 450, 430 – 440.