The location of an active nucleus and the soft X-ray shadowing by a tidal tail in the ULIRG Mrk 273
Analysis of data from the Chandra X-ray Observatory for the double nucleus ULIRG Mrk 273 reveals an absorbed hard X-ray source coincident with the southwest nucleus, implying that this unresolved near infrared source is where an active nucleus resides while the northern nuclear region contains a powerful starburst which dominates the far infrared luminosity. There is evidence of a slight image extension in the 6-7 keV band, where a Fe K line is present, towards the northern nucleus. A large-scale, diffuse emission nebula detected in soft X-rays contains a dark lane that spatially coincides with a high surface-brightness tidal tail extending arcsec (40 kpc) to the south. The soft X-ray source is likely located behind the tidal tail which absorbs X-ray photons along the line of sight. The estimated column density of cold gas in the tidal tail responsible for shadowing the soft X-rays is cm -2, consistent with the tidal tail having an edge-on orientation.
Key Words.:
X-rays: galaxies – Infrared: galaxies (individual: Mrk 273) – Active nucleus1 Introduction
Mrk 273 (= UGC 8696, IRAS F13428+5608) is a nearby () ultra-luminous infrared galaxy (ULIRG) with a 8-1000 m luminosity of . The galaxy has a long tidal tail extending kpc to the south, indicating that the system is an ongoing merger. The nuclear region appears complex and two nuclei with a projected separation of have been revealed by infrared imaging (Majewski et al 1993; Knapen et al 1997; Scoville et al 2000). In low resolution radio images, three radio components are present (Condon et al 1991), and the northern (N) and southwest (SW) components are identified with the two infrared nuclei while the southeast (SE) component is likely a star cluster seen in the Hubble Space Telescope (HST hereafter) ACS and NICMOS images (Scoville et al 2000). Mrk 273 N is a much stronger radio source with resolved structures in the high-resolution imaging (Knapen et al 1997; Carilli & Taylor 2000; Bondi et al 2005). It is the site of a large concentration of molecular gas containing in a disk traced by CO(2-1) (Downes & Solomon 1998). Combined with the radio continuum morphology which indicates an abundance of supernovae and supernova remnants (Carilli & Taylor 2000; Bondi et al 2005), this region is likely to contain a powerful starburst. The 1-17 m spectral energy distribution (SED) of the N and SW nuclei obtained by high resolution imaging with the MIRLIN mid-infrared camera on Keck (Soifer et al 2000) suggests that strong PAH features detected in the ISO SWS (Genzel et al 1998) and Spitzer IRS (Armus et al 2007) spectra originate from the N nucleus, in agreement with a strong starburst.
The presence of an active nucleus (AGN) has been indicated by the optical spectrum (Khachikian & Weedman 1974; Sanders et al 1988), which is supported by the detection of [Ne v]m and [Oiv]m (Genzel et al 1998; Satyapal et al 2004; Armus et al 2007) and an absorbed hard X-ray source with cm-2(Iwasawa 1999; Risaliti et al 2000; Balestra et al 2005), which is variable (Teng et al 2009). Scoville et al (2000) suggested that the SW nucleus hosts the AGN because it is red and unresolved in the NICMOS K-band image. Although the SW component has only a very weak extended radio continuum, its 1-17 m SED (Soifer et al 2000) shows that the SW nucleus is comparable or brighter at 3.4 and 10.3 m than the N nucleus, suggesting a hot/warm dust component. Integral field spectroscopy of the nuclear region by Colina et al (1999) shows that Seyfert 2 type excitation with strong [Oiii] is found at the SW nucleus while the N nucleus shows characteristics of a LINER (in agreement with the classification of Veilleux et al 1995). However, a point-like hard X-ray source imaged by the Chandra X-ray Observatory (hereafter Chandra) has been identified with the N nucleus (Xia et al 2002; González-Martín et al 2006). In this paper, we re-examine this identification, as Chandra astrometry has been improved since the reprocessing of the data with the new alignment file in 2007. A combination of a re-analysis of the Chandra data and an accurate astrometry on the HST images enables us to locate the hard X-ray source more accurately.
On a larger scale, there is soft X-ray emission extending kpc to the south. In the same region, a long optical tidal tail with a similar length is seen. The optical surface brightness of this tidal tail is one of the highest observed in a large sample of interacting/merging galaxies (Mazzarella & Boroson 1993), suggesting it has a rare edge-on orientation in the line of sight. There should be no direct physical connection between the optical and X-ray features however, because one is the remnant of a galaxy merger made of stars and the other is likely hot gas in a galactic-scale outflow (“superwind”, e.g., Heckman, Armus & Miley 1990).
Mrk 273 is in the C-GOALS sample for which general X-ray properties obtained from Chandra observations are presented in Iwasawa et al (2011). Further detailed study of the Chandra data are found in Xia et al (2002, see also Ptak et al 2003; Grimes et al 2005; Satyapal et al 2004; González-Martín et al 2006). In this article, we focus on 1) the hard X-ray imaging of the nuclear region; and 2) the large, southern soft X-ray nebula and its relation to the tidal tail.
The cosmology adopted here is km s-1 Mpc-1, , , consistent with that adopted for other objects in the Great Observatories All Sky LIRG Survey (GOALS, Armus et al 2009). Thus the luminosity distance of Mpc and the angular scale of 0.77 kpc arcsec-1 are assumed.
2 Observation and data reduction
Mrk 273 was observed with Chandra on 2000 April 19 (Obs ID 809) using the focal plane detector ACIS-S operated in VFAINT imaging mode. The nucleus of the galaxy was placed at the off-axis angle of 1 arcmin on the detector. The useful exposure time is 44.2 ks. The data were reduced with the standard Chandra data analysis package CIAO 4.2 with the latest calibration files in CALDB 4.3.
We use the archival H band image of Mrk 273 obtained from the HST-NICMOS with the NIC2 F160W filter (Scoville et al 2000). The optical B and I band images were taken by the HST-ACS with the F435W and F814W filters, respectively, as part of GOALS (Evans et al in prep.).
The astrometry correction of the HST image was carried out with the Starlink software GAIA. The X-ray spectral analysis was performed using the HEASARC’s FTOOLS and XSPEC version 12.
3 Results
3.1 The position of the hard X-ray source
The compact hard X-ray source is located where the soft X-ray emission is suppressed due to obscuration and thus the brightest soft X-ray region is displaced to the north by arcsec (see Iwasawa et al 2011; Xia et al 2002). We restrict the energy range of the image to 4-6 keV band, where the image is close to point-like. Our aim here is to locate the hard X-ray source in the infrared image with updated astrometry. The accuracy in absolute astrometry of the standard processing of the Chandra data (after 2007 May) can be as good as 0.22 arcsec at the 68% limit (0.42 arcsec at the 90% limit) for bright sources observed near the aimpoint of the ACIS-S. However, the standard processing of a HST image may have a positional error up to 1 arcsec. Given the small projected separation ( arcsec) of the two nuclei, it is crucial to register the infrared and X-ray images as accurately as possible.
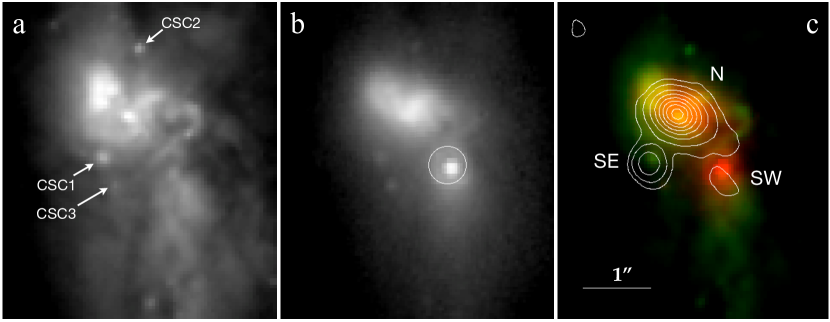
The HST-ACS I band image (Fig. 1a) is used as a reference for registering the near IR and the X-ray images as follows. The absolute astrometry of the ACS image has been corrected using field stars in the 2MASS catalog, which is only possible with the large field of view of the ACS and results in the astrometric accuracy to arcsec. The nuclear region of Mrk 273 in the I band image is confused by extinction of the complex dust structures and the two nuclei are not clearly identified. For this reason, we use compact optical sources which are located outside the dusty nuclear region for aligning the NICMOS and Chandra images.
Three candidate star clusters near the nuclear regions, seen in both I and H bands, were used to align the NICMOS image (Fig. 1b) to the ACS image (Fig. 1a). These objects are labeled in Fig. 1a, and they may also be identified by their coordinates as GOALS J134442.17+555312.9 (CSC1), J134442.11+555314.5 (CSC2), and J134442.15+555312.5 (CSC3). Since two of the star clusters are faint, the relative accuracy of the alignment is estimated to be about their beam size arcsec111In the astrometry corrected NICMOS image, the 2MASS source is located between the two near IR nuclei, which is likely an artifact of the low resolution of the 2MASS survey..
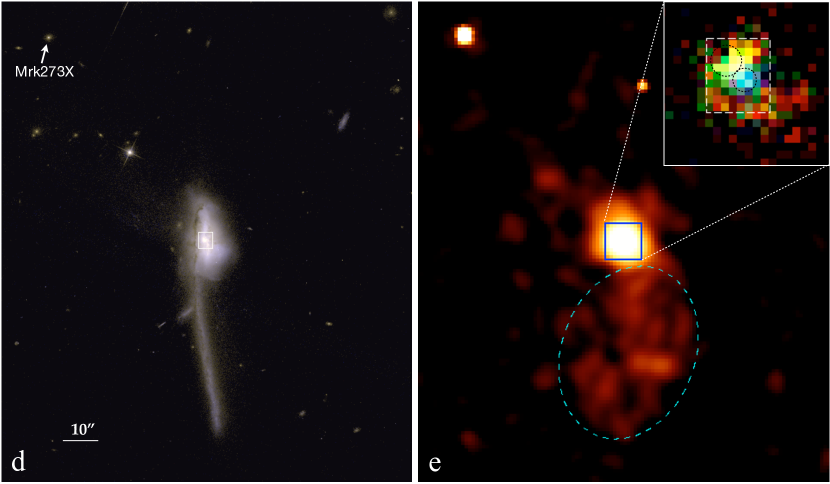
The Chandra images were aligned using the bright X-ray source Mrk 273X (see Fig. 1e), a Seyfert 2 galaxy at (Xia et al 1998), which is listed in the Chandra Multiwavelength Project catalog as CXOMP J134447.4+555411 (Kim et al 2007) and its optical counterpart is marked in Fig. 1d. The X-ray source is point-like and has counts in the 0.4-5 keV band, with which the X-ray centroid is well determined by the detection algorithm celldetect. The X-ray position was displaced by 0.1 arcsec to the east from the optical nucleus of the galaxy, and a correction has been applied to the X-ray astrometry. The centroid position of the 4-6 keV source is then found to be (RA, Dec)J2000 = (13h44m42.06s, +55d53m12.77s).
After these registrations, the accuracy of the relative alignment between the NICMOS and Chandra images is expected to be arcsec. Kim et al (2007) derived empirical formulae for positional uncertainty for a Chandra source as a function of source brightness and off-axis angle of the source location, using image simulations. As this uncertainty is derived from displacements between the input and simulated image positions, it can be considered as a statistical error. The hard X-ray source has counts in the 4-6 keV band. The uncertainty estimated from the relevant formula is 0.25 arcsec (). We thus adopt 0.35 arcsec as the absolute astrometric error. The position of the hard X-ray source and the error circle are indicated in the NICMOS image (Fig. 1b), which shows that the hard X-ray source is likely associated with the red, near-infrared SW nucleus (Fig. 1c).
3.2 The SE radio component
Fig. 1c shows an overlay of the VLA 3.6 cm image contours (Condon et al 1991) on the composite ACS/NICMOS image. No astrometry correction has been applied to the radio image. There is a slight offset of the radio image by arcsec to the south, which appears to be a remaining alignment error, as the SW radio component has a similar shift relative to the near-infrared nucleus. As shown in Fig. 1c, the SE radio component is likely associated with a star cluster seen in the ACS and NICMOS images, as first pointed out by Scoville et al (2000). High resolution radio imaging shows that this source is extended and has a steep spectrum (Carilli & Taylor 2000; Bondi et al 2005). These radio observations suggest a starburst as its origin (Bondi et al 2005) but they pointed out that the lack of a near-IR counterpart was a problem. An association of the radio source with the star cluster seen in optical and near infrared would favour a starburst interpretation (further discussed in §4.1).
3.3 Possible extension of 6-7 keV emission
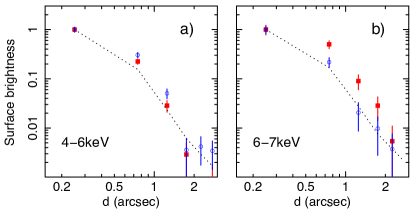
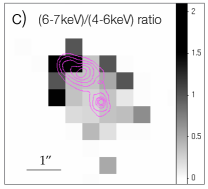
The 4-6 keV emission, used in the imaging analysis above, is dominated by an absorbed continuum of the active nucleus with negligible contribution from extended emission seen at lower energies. Fig. 2a shows the radial profiles of the 4-6 keV emission in the northeast () and southwest () halves, indicating the 4-6 keV source is approximately symmetric in the northeast-southwest direction and close to the point spread function (PSF). However, in the 6-7 keV band (Fig. 2b), the northeast half shows a excess over the southwest half, which is consistent with the PSF. This excess carries about 10% of the total 6-7 keV emission (121 counts) and is found around the N nucleus, as shown in the (6-7 keV)/(4-6 keV) ratio image (Fig. 2c).
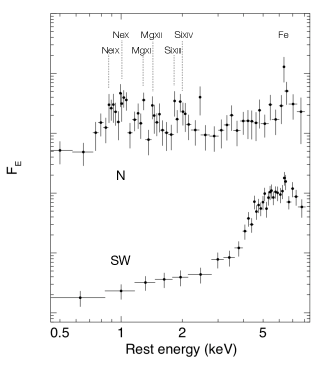
The 6-7 keV band contains the 6.4 keV Fe K line (at 6.17 keV in the observed frame). The spectrum taken from a diameter aperture of the 6-7 keV excess region, as indicated in Fig. 1e (inset), indeed shows a strong 6.4 keV Fe K line with equivalent width, EW keV (labeled as ’N’ in Fig. 3). For a comparison, another spectrum was taken from a region centred on the SW nucleus with a diameter aperture (as indicated in Fig. 1e–inset), which does not overlap with the above 6-7 keV excess region. This spectrum (labeled as ’SW’ in Fig. 3) is essentially of the absorbed active nucleus and the 6.4 keV Fe K line has EW keV, in agreement with that measured for the total emission of the objects (Ptak et al 2003; Xia et al 2002; Iwasawa et al 2011). Thus the Fe K line in the N spectrum is much stronger (with respect to the contiuum) than in the SW spectrum.
This is consistent that the 6-7 keV excess is mainly due to an enhancement of the Fe K line, suggesting possible presence of an extra source of Fe K, albeit the evidence is marginal given the limited statistics. If it is real, a reflection-dominated spectrum, as seen in a heavily obscured AGN, is a good candidate for this extra source, since it contributes primarily to the Fe K line but significantly less to the continuum. The 3-8 keV continuum of the N spectrum is flat () and shows no obvious sign of an absorption cut-off, as seen in the SW spectrum. This is also consistent with a reflection spectrum but the absorption cut-off in the lower energies may be masked by strong soft X-ray emission. The reality of the image extension and the Fe line enhancement there need to be investigated further with higher quality (both in spatial resolution and counting statistics) data. The Fe K excess region spatially coincides with the N nucleus, which could lead to an interesting possibility, as discusse below (§4.1).
This region is also brightest in soft X-rays, particularly in the 1-3 keV band (Fig. 1e–inset). The soft X-ray spectrum shows emission-lines of H-like Ne, Mg and Si that are comparable or even stronger than their He-like counterparts (as marked in Fig. 3), indicating high-ionization. If these lines are of thermal origin, the temperature should be keV, as inferred by a thermal spectrum fit to the energy range of the Mg and Si lines. This temperature is much higher than the mean temperature of the bright central part, e.g., inner 10′′ area ( keV, Xia et al 2002; Grimes et al 2005). Note that Ne ix (0.9 keV) is not expected at keV, and its detection perhaps suggests the presence of multi-temperature gas in this region.
3.4 The extended soft X-ray nebula
3.4.1 A shadow of the tidal tail
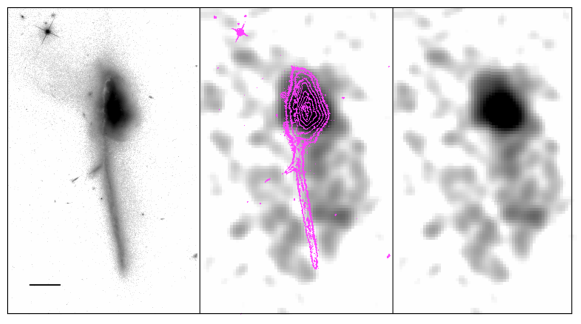
A large soft X-ray nebula extending to the south is clearly visible in the Chandra image (Fig. 1e), as noted by several authors (Xia et al 2002; González-Martín et al 2006; Ptak et al 2003; Grimes et al 2005). Comparison of the soft X-ray and optical images shows that the long, optical tidal tail extending to the south is remarkably well aligned with a dark gap running through the soft X-ray nebula in the N-S direction (Fig. 4). The position angle (PA) of the X-ray dark lane is , which increases to at the southern end while the optical tidal tail has PA. This can be understood if the tidal tail is located in front of the soft X-ray nebula in our line of sight such that soft X-ray emission is absorbed by the cold gas in the tidal tail.
The ACIS-S spectrum of the southern X-ray nebula (Fig. 5), taken from the region indeicated in Fig. 1e, shows that the bulk of the light is emitted below 1.1 keV. The total source counts in the 0.4-1.1 keV band are counts. To make emission of such a spectrum totally suppressed at energies below 1 keV, an absorbing column density of cm-2 or larger is required. However, as the X-ray source is diffuse, the limiting column density would be slightly relaxed. The projected area of the tidal tail’s shadow is measured to be arcsec2. Under a crude assumption of a uniform brightness distribution over the nebula, we adopt detection of counts in more than half the area is the limiting condition. Assuming the spectral model for the nebula (§3.4.2), expected counts from the shadowed area are simulated for incremental values of absorbing matter at the galaxy redshit. As is increased by an interval of cm2, expected counts go below the detection limit, when exceeds cm2. We consider this as the lower limit of the column density of cold gas in the tidal tail, which makes the shadow on the soft X-ray nebula. This column density is similar to that of an edge-on galaxy disk. Similar measurements of disk shadowing have been made against the extragalactic X-ray background (e.g., Barber, Roberts & Warwick 1996).
3.4.2 Spectral properties

While the spectrum of the nebula (Fig. 5) is dominated by the soft X-ray emission below 1 keV, there is weak but significant emission up to 2 keV containing counts, mainly due to line emission of Mg xi at 1.34 keV and Si xiii at 1.85 keV. There is also an excess on the lower energy side of Si xiii. These strong lines suggest an enhancement of metallicity in elements. Fitting the spectrum with a thermal emission model computed by MEKAL (Kaastra 1992), in which the abundances of elements relavant to the 0.4-2 keV band are left variable, gives a metallicity of Z(Ne, Mg, Si) , Z(Fe), and Z(O) with a temperature of keV and the Galactic absorption cm-2 (Kalberla et al 2005). The relatively small Fe and O abundances reflect weakness of the Fe L emission bump around 1 keV and OVIII at 0.65 keV. This result is in agreement with Grimes et al (2005), but differs from the low metallicity obtained by Xia et al (2002) who used data only below 1 keV, where the Mg and Si lines are not present, and with the solar abundance pattern.
Enhancement of metallicity in elements is expected in the interstellar medium enriched by ejecta of core-collapse supernovae, which a starburst would mainly produce. The nebular spectrum is similar to that found in the extended nebula of another ULIRG Mrk 231 in terms of temperature and the strong Mg and Si lines (Iwasawa et al 2011). The apparently lower metallicity of O than the other -elements is not compatible with the classical theoretical prediction (e.g., Nomoto et al 1997) but similar to that found in well studied starbursts in NGC 6240 (Netzer et al 2005) and M 82 (Ranalli et al 2008).
4 Discussion
4.1 Nature of the double nucleus
With the registration with the HST image, the SW nucleus appears to be the location of the hard X-ray source in Mrk 273, which is absorbed by cold gas of cm-2. This is in agreement with the suggestion by Scoville et al (2000) that the SW nucleus, a red, unresolved NICMOS source, is the location of an active nucleus and other properties described in §1. Besides the Seyfert 2 spectrum at the SW nucleus, Colina et al (1999) also pointed out that the kinematically quiescent [Oiii] component, located further SW of the SW nucleus, is similar to the ionization-cones around Seyfert 2 galaxies. The mid-IR AGN indicator [Ne v] may therefore originate from this region. The mid-infrared to hard X-ray ratio, log , of the SW nucleus is comparable to those normally observed in AGN (e.g., Elvis et al 1994; Lusso et al 2010). While the radio emission is weak, the ratio of flux densities , as derived by Soifer et al (2000), is not unusual for a radio-quiet AGN.
The far-infrared portion of the SEDs of the two nuclei are not known. The radio band is dominated by the N component, with log W Hz-1. If the far infrared emission, with log W Hz-1 (estimated by an interpolation of the IRAS 60 m and 100 m fluxes of Sanders et al 2003), is also dominated by the N component, then the 1.4 GHz and 70 m luminosities are consistent with the well-known far-infrared/radio correlation (e.g., Appleton et al 2004). This suggests that the N nucleus is likely powered by a starburst and the major source of the far-infrared emisison where the bolometric power peaks (m). A similar conclusion can be reached by an argument based on the AGN luminosity of the SW nucleus. The absorption-corrected 2-10 keV luminosity of the hard X-ray source is erg s-1. Assuming the bolometric correction of Marconi et al (2004), the bolometric luminosity of the AGN in the SW nucleus is estimated to be erg s-1or log , which is a factor of smaller than the total . Relative to this X-ray estimate, the mid-IR diagnostics with [Ne V] m, [O IV] m and PAH emission at 6.2 m seem to suggest a larger (but not a dominant) contribution from AGN (Armus et al 2007; Petric et al 2010).
Downes & Solomon (1998) suggested that the N nucleus is an extreme compact starburst with a high luminosity-density, similar to the western nucleus of Arp 220. High-resolution radio continuum imaging supports this hypothesis (Carilli & Taylor 2000; Bondi et al 2005). The LINER-type excitation and the adjascent, kinematically turbulent [Oiii] component (Colina et al 1999) can be explained by a strong outflow from the starburst. As discussed above, the total far-infrared output of Mrk 273 is likely dominated by a starburst occuring in this region. As shown in Fig. 1a, bright soft X-ray emission is observed here. The soft X-ray spectrum shows thermal characteristics and high metallicity (Xia et al 2002; Ptak et al 2003; Grimes et al 2005).
At energies above 4 keV, any contribution of the N nucleus appears to be negligible. A possible exception is in the 6-7 keV range. If the image extension in this energy range is real and due to enhanced Fe K emission, as discussed in §3.3, this presents a possibility that a heavily absorbed (possibly Compton-thick) AGN may exist in the N nucleus as well. Assuming a reflection-dominated spectrum with a 6.4 keV Fe K line with EW = 1 keV, an expected 4-7 keV flux of this (hypothetical) source would be erg s-1 cm-2, which is only 5% of the total observed flux from the whole system in the same band. Even if an intrinsic source flux is 2 orders of magnitude larger, its 2-10 keV luminosity would be about erg s-1, similar to that of the SW and, in any case, have a minor contribution to the bolometric luminosity. It should be noted that the 6-7 keV excess could also be due to extended Fe K emission induced by AGN in the SW nucleus, as seen in NGC 4388 (Iwasawa et al 2003), rather than originating from the N nucleus. At the current data quality, evidence for an AGN in the N nucleus is thus weak. However, this raises an exciting possibility that Mrk 273 is another dual AGN system similar to the cases of NGC 6240 (Komossa et al 2003) and Mrk 266 (NGC 5256, Mazzarella et al 2011).
4.2 Cold gas in the tidal tail shadowing soft X-ray nebula
A rough estimate of the mass of cold gas in the tidal tail responsible for shadowing the soft X-rays can be obtained from the minimum column density ( cm-2) which is required to absorb away the soft X-ray photons from the nebula (§3.4.1). We note that a dust lane extends across the tidal tail from the main body of the galaxy, as seen in the HST optical image (Fig. 1d). If cold gas is distributed uniformly in a cylinder with a diameter of 2.5 arcsec ( kpc) and a length of 40 arcsec ( kpc) lying on the plane of the sky, the mean density would be cm-3. Thus the gas mass is estimated to be . However, a more likely geometry of this tidal tail is an edge-on disk, as argued in §1 and §3.4. In this case, the average density would be lower.
Similarity in morphology between the soft X-ray and H emission has been noted by Xia et al (2002) and Grimes et al (2005). This correspondence is often found in objects with galactic-scale outflows, such as Arp 220 and NGC 6240 (e.g., Veilleux, Cecil & Bland-Hawthorn 2005; Armus et al 1990). The enhancement of -elements in the soft X-ray emitting gas (§3.3.2) supports prior interpretation of the diffuse nebula as a starburst-driven superwind. Although the outflow velocity at inner radii is as large as 2400 km s-1 (Colina et al 1999), it will slow down quickly until escaping from the galaxy’s potential. To reach 30 kpc, which is roughly the projected length of the southern extension of the nebula, the required time is yr, where is the average outflow velocity in unit of 300 km s-1. This can be a crude measure of the starburst age. The linearity, thinness and high surface-brightness suggests that a tidal tail (remnants of a galaxy disk) is being viewed nearly edge-on, trailing a northward orbital encounter. Assuming the component of the relative orbital velocity in the plane of the sky is km s-1, material in the tidal tail kpc south of the nuclei would have been drawn out from the parent galaxy disk yr ago. If the starburst was episodic or roughly continuos over the duration of the ongoing merger, as suggested by simulations, the alignment of the diffuse X-ray emitting nebula and the stellar tidal tail is not a coincidence, but rather an artifact of the main power source of the starburst-driven wind moving northward during the creation of the trailing tidal tail.
5 Summary
-
•
With the new registration of the Chandra X-ray image with the optical and near-IR images from HST, we identified the absorbed, hard X-ray source of the Seyfert 2 nucleus in Mrk 273 with the SW nucleus, which revises the previous identification to the N nucleus.
-
•
The hard X-ray source is point-like except in the 6-7 keV band, where the image shows a slight extension to the northeast. This excess appears to be due to enhanced Fe K line emission at 6.4 keV around the N nucleus. A possible implication is that a heavily obscured active nucleus might be present also in the N nucleus, while a starburst remains to be a dominant source of the far-IR luminosity.
-
•
A dark lane in the soft X-ray nebula extending to the south is found to align well with the optical tidal tail. This probably means the tidal tail is located in front of the soft X-ray nebula and absorbs the X-ray photons along our line of sight. The column density of cold gas in the tidal tail is estimated to be cm-2.
Acknowledgements.
This research made use of archival data maintained at the Chandra X-ray Center (CXC) and Space Telescope Science Institute (STScI), data products from the Two Micron All Sky Survey (2MASS), and the NASA/IPAC Extragalactic Database (NED).References
- Appleton et al. (2004) Appleton, P. N., et al. 2004, ApJS, 154, 147
- Armus et al. (2009) Armus, L., et al. 2009, PASP, 121, 559
- Armus et al. (2007) Armus, L., et al. 2007, ApJ, 656, 148
- Armus et al. (1990) Armus, L., Heckman, T. M., & Miley, G. K. 1990, ApJ, 364, 471
- Balestra et al. (2005) Balestra, I., Boller, T., Gallo, L., Lutz, D., & Hess, S. 2005, A&A, 442, 469
- Barber et al. (1996) Barber, C. R., Roberts, T. P., & Warwick, R. S. 1996, MNRAS, 282, 157
- Bondi et al. (2005) Bondi, M., Pérez-Torres, M.-A., Dallacasa, D., & Muxlow, T. W. B. 2005, MNRAS, 361, 748
- Carilli & Taylor (2000) Carilli, C. L., & Taylor, G. B. 2000, ApJ, 532, L95
- Colina et al. (1999) Colina, L., Arribas, S., & Borne, K. D. 1999, ApJ, 527, L13
- Condon et al. (1990) Condon, J. J., Helou, G., Sanders, D. B., & Soifer, B. T. 1990, ApJS, 73, 359
- Downes & Solomon (1998) Downes, D., & Solomon, P. M. 1998, ApJ, 507, 615
- Elvis et al. (1994) Elvis, M., et al. 1994, ApJS, 95, 1
- Genzel et al. (1998) Genzel, R., et al. 1998, ApJ, 498, 579
- González-Martín et al. (2006) González-Martín, O., Masegosa, J., Márquez, I., Guerrero, M. A., & Dultzin-Hacyan, D. 2006, A&A, 460, 45
- Grimes et al. (2005) Grimes, J. P., Heckman, T., Strickland, D., & Ptak, A. 2005, ApJ, 628, 187
- Heckman et al. (1990) Heckman, T. M., Armus, L., & Miley, G. K. 1990, ApJS, 74, 833
- Iwasawa et al (2011) Iwasawa, K., et al., 2011, A&A, submitted
- Iwasawa et al. (2003) Iwasawa, K., Wilson, A. S., Fabian, A. C., & Young, A. J. 2003, MNRAS, 345, 369
- Iwasawa (1999) Iwasawa, K. 1999, MNRAS, 302, 96
- kaastra (1992) Kaastra, J.S., 1992, Internal SRON-Leiden Report, ver. 2.0
- Khachikian & Weedman (1974) Khachikian, E. Y., & Weedman, D. W. 1974, ApJ, 192, 581
- Kalberla et al. (2005) Kalberla, P. M. W., Burton, W. B., Hartmann, D., Arnal, E. M., Bajaja, E., Morras, R., Pöppel, W. G. L. 2005, A&A, 440, 775
- Kim et al. (2007) Kim, M., et al. 2007, ApJS, 169, 401
- Knapen et al. (1997) Knapen, J. H., Laine, S., Yates, J. A., Robinson, A., Richards, A. M. S., Doyon, R., & Nadeau, D. 1997, ApJ, 490, L29
- Komossa et al. (2003) Komossa, S., Burwitz, V., Hasinger, G., Predehl, P., Kaastra, J. S., & Ikebe, Y. 2003, ApJ, 582, L15
- Lusso et al. (2010) Lusso, E., et al. 2010, A&A, 512, A34
- Majewski et al. (1993) Majewski, S. R., Hereld, M., Koo, D. C., Illingworth, G. D., & Heckman, T. M. 1993, ApJ, 402, 125
- Marconi et al. (2004) Marconi, A., Risaliti, G., Gilli, R., Hunt, L. K., Maiolino, R., & Salvati, M. 2004, MNRAS, 351, 169
- (29) Mazzarella, J. M., Iwasawa, K., Vavilkin, T., Armus, L., Kim, D.-C., Evans, A. S., Spoon, H., Haan, S., et al., 2011, AJ, submitted
- Mazzarella & Boroson (1993) Mazzarella, J. M., & Boroson, T. A. 1993, ApJS, 85, 27
- Netzer et al. (2005) Netzer, H., Lemze, D., Kaspi, S., George, I. M., Turner, T. J., Lutz, D., Boller, T., & Chelouche, D. 2005, ApJ, 629, 739
- Nomoto et al. (1997) Nomoto, K., Hashimoto, M., Tsujimoto, T., Thielemann, F.-K., Kishimoto, N., Kubo, Y., & Nakasato, N. 1997, Nuclear Physics A, 616, 79
- (33) Petric, A.O., Armus, L., Howell, J., Chan, B., Mazzarella, J.M., Evans, A.S., Surace, J.A., Sanders, D., et al., 2010, ApJ, in press (arXiv:1012.1891)
- Ptak et al. (2003) Ptak, A., Heckman, T., Levenson, N. A., Weaver, K., & Strickland, D. 2003, ApJ, 592, 782
- Ranalli et al. (2008) Ranalli, P., Comastri, A., Origlia, L., & Maiolino, R. 2008, MNRAS, 386, 1464
- Risaliti et al. (2000) Risaliti, G., Gilli, R., Maiolino, R., & Salvati, M. 2000, A&A, 357, 13
- Sanders et al. (2003) Sanders, D. B., Mazzarella, J. M., Kim, D.-C., Surace, J. A., & Soifer, B. T. 2003, AJ, 126, 1607
- Sanders et al. (1988) Sanders, D. B., Soifer, B. T., Elias, J. H., Madore, B. F., Matthews, K., Neugebauer, G., & Scoville, N. Z. 1988, ApJ, 325, 74
- Satyapal et al. (2004) Satyapal, S., Sambruna, R. M., & Dudik, R. P. 2004, A&A, 414, 825
- Scoville et al. (2000) Scoville, N. Z., et al. 2000, AJ, 119, 991
- Soifer et al. (2000) Soifer, B. T., et al. 2000, AJ, 119, 509
- Teng et al. (2009) Teng, S. H., et al. 2009, ApJ, 691, 261
- Veilleux et al. (2005) Veilleux, S., Cecil, G., & Bland-Hawthorn, J. 2005, ARA&A, 43, 769
- Veilleux et al. (1995) Veilleux, S., Kim, D.-C., Sanders, D. B., Mazzarella, J. M., & Soifer, B. T. 1995, ApJS, 98, 171
- Xia et al. (2002) Xia, X. Y., Xue, S. J., Mao, S., Boller, T., Deng, Z. G., & Wu, H. 2002, ApJ, 564, 196
- Xia et al. (1998) Xia, X.-Y., Boller, T., Wu, H., Deng, Z.-G., Gao, Y., Zou, Z.-L., Mao, S., & Boerner, G. 1998, ApJ, 496, L9