![[Uncaptioned image]](/html/1101.3510/assets/x1.png)
Science with the Galactic O-Star Spectroscopic Survey (GOSSS) : The relationship between DIBs, ISM, and extinction.
Miguel Penadés Ordaz1,
Jesús Maíz Apellániz1,
Alfredo Sota Ballano1,
Emilio J. Alfaro1,
Nolan R. Walborn2,
Rodolfo H. Barbá3,
Nidia I. Morrell4,
Julia I. Arias3,
and
Roberto C. Gamen5
111 www.iaa.esInstituto de Astrofísica de Andalucía IAA-CSIC (Granada-Spain)
Space Telescope Science Institute (Baltimore-MD-USA)
333 www.userena.clUniversidad de La Serena (La Serena-Chile)
444 www.lco.clLas Campanas Observatory (La Serena-Chile)
555 www.fcaglp.unlp.edu.ar/gladys/ialpInstituto de Astrofísica de La Plata (CONICET, UNLP), (La Plata-Argentina)
Abstract
In this poster we show our preliminary analysis of DIBs (Diffuse Interstellar Bands) and other interstellar absorption lines with the purpose of understanding their origin and their relationship with extinction. We use the biggest Galactic O-star blue-violet spectroscopic sample ever (GOSSS, see contribution by Maíz Apellániz). This sample allows a new insight on this topic because of the adequacy of O-star spectra, the sample number (700 and increasing, 400 used here), and their distribution in the MW disk. We confirm the high correlation coefficients between different DIBs and , though the detailed behavior of each case shows small differences. We also detect a moderately low correlation coefficient between Ca ii 3934 (Ca K) and with a peculiar spatial distribution that we ascribe to the relationship between line saturation and velocity profiles for Ca ii 3934.
1 Data description and processing
We used 900 spectra corresponding to 400 O stars (plus some B and WR stars) from the GOSSS survey (see talk by Jesús Maíz Apellániz [6] in this meeting) and reduced using the
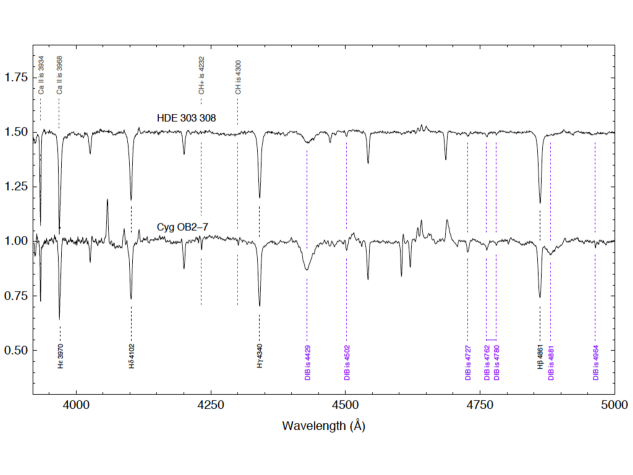
pipeline developed by one of us (see poster by Alfredo Sota [9] in this meeting). The spectra have high S/N (200 or better) and cover the 3900-5100 Å range with a spectra resolution R2500. To measure the equivalent widths of the bands and lines of our study (Ca II 3934, CH+ 4232, and DIBs 4501, 4726, 4762, 4780, and 4964 Å) we have used a visual IDL package based program written by one of us (Jesús Maíz Apellániz). The code allowed us to perform a fast and reliable analysis using both numerical integration and gaussian fits of each absorption line. Each fit was visually inspected and interactively adjusted to account
![[Uncaptioned image]](/html/1101.3510/assets/x3.png)
for contamination by nearby lines, velocity shifts, and S/N effects. Some of the spectra were eliminated because of quality-control issues related to those effects. The color excesses were derived from [a] the photometry in the Galactic O-Star Catalog (Maíz Apellániz et al. 2004 [5], Sota et al. 2008 [8]), [b] the temperature-spectral type relationships in Martins et al. (2005) [7], and [c] the magnitudes as a function of temperature and luminosity class in the latest version of CHORIZOS (Maíz Apellániz 2004 [4]). All the equivalent widths were correlated with each other and with the color excess Table 1. We performed for each pair linear and parabolic fits. For the linear fits we calculated the maximum possible correlation coefficient for two perfectly correlated variables affected by random noise (the value is close to but not exactly 1.0).
2 Results
DIBs are one of the older questions without answer in astronomy. More than 300 bands have been discovered in nearly a century. The currently favored carriers are carbon-based, but their specific nature is still highly debated (Herbig 1995 [2], Galazutdinov et al. 2000 [1], Kaźmierczak et al. 2010 [3]). As we knew from previous literature results, DIBs are tightly correlated with extinction, but also with a considerable dispersion and differences for each band. This has been once again verified in this study. Other important corroboration is the variability of the correlation coefficients, indicating that DIBs are likely to originate in a family of carriers instead of a single one (Table 1).
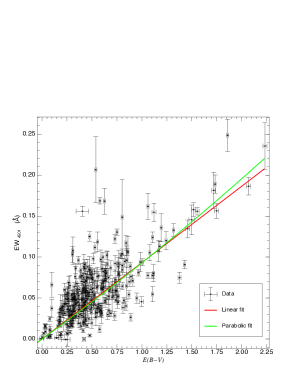
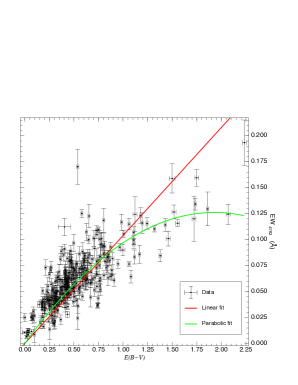
It is believed that DIB carriers are present in diffuse clouds or the surface of dense ones as opposed to dense cores. This could be the reason of the better fit by a parabola in Fig. 2 (right) and is known as the skin effect: at high extinctions the of some DIBs depends on color excess more weakly than at low extinctions. On the other hand, some DIBs do not show the effect in our data (Fig. 2).
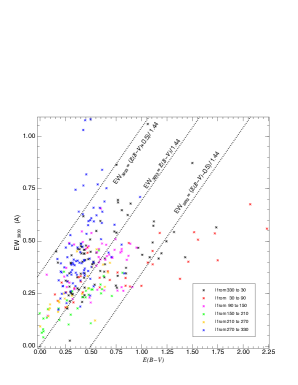
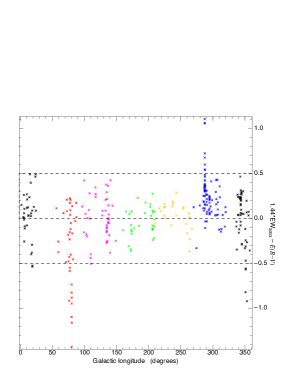
The relationship of the Ca II 3934 line with extinction Figs. 3 shows an interesting behavior. For low values of , the of the line is approximately proportional to the reddening. At intermediate values, however, two branches form, one with large and intermediate and another one with intermediate and large . Furthermore, the two branches are distinguished as regions in the sky, with the first one concentrated in Cygnus (with most stars being Cyg OB2 members) and, to some extent, Sagittarius, and the second one in Carina. The most plausible explanation is the existence of cloud velocity structure (unresolved in our spectra). Ca II 3934 can saturate in moderately dense clouds, so the behavior of its equivalent width depends not only on the amount of material present but also on whether it is distributed in one or more clouds of different velocities. Fig. 3 is consistent with Ca II being concentrated in a single cloud in the direction of Cygnus and in several in the direction of Carina. Such velocity distribution has been extensively studied for the case of the Carina Nebula Asssociation (Walborn et al. 2007 [10] and references therein), where multiple velocity components are indeed present and caused by the kinetic energy input from the massive stars there. On the other hand, Cygnus OB2 is closer to us than the Carina Nebula and has no associated H II region, so the absorbing Ca II cloud is likely to be a single and relatively unperturbed foreground object.
3 Future
Our future plans include:
-
1
Increase the sample of observed stars.
-
2
Analyze the rest of the DIB lines in the blue-violet spectra.
-
3
Obtain spectra in the rest of the visible spectrum to observe more DIBs.
-
4
Use high-resolution spectra to study the velocity structure of the Ca II 3934 line and weak DIBs.
-
5
Use CHORIZOS to derive and , the monochromatic equivalents to and , respectively, and study their correlation with the measured equivalent widths.
Acknowledgments
Support for this work was provided by [a] the Spanish Government Ministerio de Ciencia e Innovación through grants AYA2007-64052, the Ramón y Cajal Fellowship program, and FEDER funds; [b] the Junta de Andalucía grant P08-TIC-4075; and [c] NASA through grants GO-10205, GO-10602, and GO-10898 from the Space Telescope Science Institute, which is operated by the Association of Universities for Research in Astronomy Inc., under NASA contract NAS 5-26555.This research has made extensive use of Aladin (Bonnarel et al., 2000), and of the SIMBAD database, operated at CDS, Strasbourg, France.
References
- [1] Galazutdinov, G. A. et al. 2000, PASP 112, 771
- [2] Herbig, G. H. 1995, ARA&A 33, 19
- [3] Kaźmierczak, M. et al. 2010, MNRAS 408, 1590
- [4] Maíz Apellániz, J., 2004, PASP 116, 859
- [5] Maíz Apellániz, J., Walborn N. R., Galué, H. á., & Wei, L. H. 2004, ApJS 151, 103
- [6] Maíz Apellániz, J. et al. 2010, (this proceedings)
- [7] Martins, F., Schaerer, D., & Hillier, D. J. 2005, A&A 436, 1049
- [8] Sota, A. Maíz Apellániz, J., Walborn N. R., & Shida, R. Y. 2008, RMxAA (conference series) 33, 56
- [9] Sota, A. & Maíz Apellániz, J., 2010, (this proceedings)
- [10] Walborn, N. R. et al. 2007, PASP 119, 156