CoRoT high-precision photometry of the B0.5 IV star HD 51756 ††thanks: The CoRoT space mission was developed and is operated by the French space agency CNES, with participation of ESA’s RSSD and Science Programmes, Austria, Belgium, Brazil, Germany, and Spain.,††thanks: Based on data gathered with Coralie installed on the 1.2 meter Euler telescope at La Silla, Chile; and Harps installed on the 3.6 meter ESO telescope (ESO Large Programme 182.D-0356) at La Silla, Chile.
Abstract
Context. OB stars are important constituents for the ecology of the Universe, and there are only a few studies on their pulsational properties detailed enough to provide important feedback on current evolutionary models.
Aims. Our goal is to analyse and interpret the behaviour present in the CoRoT light curve of the B0.5 IV star HD 51756 observed during the second long run of the space mission, and to determine the fundamental stellar parameters from ground-based spectroscopy gathered with the Coralie and Harps instruments after checking for signs of variability and binarity, thus making a step further in mapping the top of the Cep instability strip.
Methods. We compare the newly obtained high-resolution spectra with synthetic spectra of late O-type and early B-type stars computed on a grid of stellar parameters. We match the results with evolutionary tracks to estimate stellar parameters. We use various time series analysis tools to explore the nature of the variations present in the light curve. Additional calculations are carried out based on distance and historical position measurements of the components to impose constraints on the binary orbit.
Results. We find that HD 51756 is a wide binary with both a slow () and a fast () early-B rotator whose atmospheric parameters are similar ( and ). We are unable to detect pulsation in any of the components, and we interpret the harmonic structure in the frequency spectrum as sign of rotational modulation, which is compatible with the observed and deduced stellar parameters of both components.
Conclusions. The non-detection of pulsation modes provides a feedback on the theoretical treatment, given that non-adiabatic computations applied to appropriate stellar models predict the excitation of both pressure and gravity modes for the fundamental parameters of this star.
Key Words.:
Stars: variables: general - Stars: early-type - Stars: oscillations - Stars: individual: HD 51756 - Stars: rotation - Stars: binaries: spectroscopic1 Introduction
One of the major observing programmes for the asteroseismology channel of the CoRoT satellite (Baglin et al. 2006), is to derive details of the internal physics of stars within the instability strip of early-type B pulsators (e.g., Michel et al. 2006). A major motivation of this programme was to understand the excitation problems reported for some of the observed modes in several prototypical bright Cep stars by groups using independent stellar evolution and pulsation codes (e.g., Pamyatnykh et al. 2004; Ausseloos et al. 2004; Handler et al. 2006; Desmet et al. 2009), while other class members show oscillations as predicted by theory (Aerts et al. 2003; Mazumdar et al. 2006; Briquet et al. 2007b; Handler 2009). The goal was also to study stars of spectral type O or B0, which are higher up in the predicted Cep strip than most class members observed from the ground prior to CoRoT, to see if the emptiness of that part of the strip is removed when going from mmag to mag precision in photometric data. A third motivation was to obtain data of higher precision than from the ground and uninterrupted, in order to establish once and for all the firm detection of non-radial gravity modes seemingly present in ground-based spectroscopy of rapidly rotating Be stars (e.g., Rivinius et al. 2003), and to interpret those in terms of oscillations of rapid rotators. A number of early-type B stars were thus selected to fulfill these goals, keeping in mind the strong pointing restrictions of the satellite as well as the brightness limitations (e.g., Auvergne et al. 2009). The star HD 51756 (B0.5 IV) studied in this paper was selected as target in this context, as well as 6 O stars measured during a short run. All further planned B targets have later spectral type due to pointing restrictions of the satellite.
The slowly rotating B stars observed by CoRoT’s asteroseismology CCDs so far, have led to some remarkable results. The only accessible known Cep star, HD 180642 (B1.5 II-III), turned out to have numerous self-excited modes rather than one dominant radial mode as was thought prior to CoRoT (Degroote et al. 2009; Briquet et al. 2009) and many of the observed modes are resonantly coupled. Moreover, the star was found to have modes of a stochastic nature as well (Belkacem et al. 2009), which was never found before in a Cep pulsator and which requires the presence of a surface convection zone capable to excite such modes. Stochastically excited modes exhibiting a constant frequency spacing were, surprisingly, detected in the O8.5 V star HD 46149 (Degroote et al. 2010b). On the other hand, the O9V star HD 46202 turns out to be the most massive star known to date with Cep-like pulsation frequencies, but for which present excitation computations fail to predict the observed oscillations (Briquet et al. 2010). Further, at the cool border of the Cep instability strip, the B3 V star HD 50230 revealed oscillations of hybrid nature, i.e., the presence of both gravity modes as expected in slowly pulsating B stars and pressure modes as in the classical Cep stars. The gravity modes of this star displayed a period spacing and a periodic deviation thereof, which allowed one to prove the existence of a chemically inhomogeneous zone around the fully mixed core which is not yet taken into account in current B star models (Degroote et al. 2010a).
As for the rapidly rotating early-Be stars, HD 49330 (B0.5 IVe) turned out to be a clear case where multiple mode beating was observed in real time and this phenomenon was found to be connected with an outburst feeding the circumstellar disk (Huat et al. 2009; Floquet et al. 2009). This supports the early findings of Baade et al. (1988) and Rivinius et al. (2001) that the outbursts detected in the B2e star Cen have a pulsational origin and are connected with multimode beating. This outburst phenomenon was so far not found for the other Be stars which were monitored intensively by CoRoT, but those targets are of later spectral type (Neiner et al. 2009, HD 181231, B5 IVe; Gutiérrez-Soto et al. 2009, HD 175869, B8 IIIe). There is yet no acceptable seismic modeling of the interior structure of a Be star, due to the mathematical complexity of the treatment of stellar oscillations in a deformed star.
It is obvious from these recent findings that the diversity of stellar oscillations in and near the Cep instability strip is much larger than anticipated before the CoRoT mission. This must imply that details in the internal physics of the various stars, such as their internal rotation, mixing, settling and radiative levitation due to atomic diffusion, etc., may be different. Some problems may also be solved by increasing the opacity in the excitation layers. In an attempt to increase the number of well studied early-B stars, HD 51756 (B0.5 IV) was monitored by CoRoT’s seismology CCDs and studied in parallel with ground-based spectroscopy.
2 Fundamental parameters
2.1 Prior to our study
HD 51756 – a bright () B0.5 IV field-star in the constellation of Monoceros – was first listed among early-type high-luminosity objects by Münch (1951), being classified as a B3 star from objective-prism plates. The determination of the luminosity class and a more precise spectral type of B0.5 IV was done by Morgan et al. (1955), which is generally used since then. Although there are exceptions: a B0 III classification by Dworetsky et al. (1982), a B1 V by Abt (2008), and a B1/2 Ib by Wright et al. (2003) – there seems to be a quite good agreement on the spectral type, but not the luminosity class.
Measurements by Burnham (1875) showed that HD 51756 is a triple system (catalogued as BU 327, but widely known as WDS J06585-0301), consisting of two almost equally bright ( mag) close components with a separation of ″, and a fainter star further away ( mag, ″). Unfortunately, only one historical radial velocity (RV) measurement () can be found in the literature (Wilson 1953). Searching for Cep stars, Hill (1967) took the first photometric time-series and concluded that this field-star was constant. Among other parameters, he also measured the projected rotational velocity to be . There is also a measurement from Glebocki & Stawikowski (2000) claiming a .
Further information we found concerns , , , the colours of and , and the colour excess of . In addition to these, 111the filter is centered at and was measured by Weber et al. (1971). A distance modulus of is given by Vogt (1976), which leads to a distance of 1.38 kpc (1.04 kpc with extinction taken into account). There are similar measurements of kpc (Avedisova & Kondratenko 1984, for the BFS 55 H ii region222for the same region Fich & Blitz (1984) found a kinematic distance of kpc determined by using CO velocities of the associated molecular clouds and the CO rotation curve of the outer galaxy, which is claimed to be ionised by the nearby multiple subgiant, HD 51756), 1.6 kpc (Savage et al. 1985) and kpc (Kaltcheva & Hilditch 2000, with from photometry). The original Hipparcos (Perryman et al. 1997) parallax is mas, while the value from the new reduction (van Leeuwen 2007) is mas. Unfortunately none of these lead to a useful distance estimate.
Empirical temperature calibrations (Gulati et al. 1989) gave values of , , and , derived from QUV, , and , respectively (corresponding to – with errors taken into account – an effective temperature range of K).
2.2 New spectroscopy
In the framework of ground based preparatory and follow-up observations for the CoRoT space mission, high resolution and medium to high signal to noise spectra were taken with the Coralie (Baranne et al. 1996; Queloz et al. 2001, ) and Harps (Mayor et al. 2003, ) instruments (78 and 15 measurements respectively – see Table 1 for a summary of the spectroscopic observations). In addition to these, one spectrum gathered with Feros (Kaufer et al. 1999, ) was taken from the GAUDI archive (Solano et al. 2005).
| Instrument | N | HJD begin | HJD end | SNR-range | R | ||
|---|---|---|---|---|---|---|---|
| Coralie | 53 | 2454842 | 2454852 | 124 | [97, 142] | 1500 | |
| Coralie | 25 | 2454912 | 2454922 | 130 | [99, 160] | [1500, 2000] | |
| Harps | 15 | 2455174 | 2455195 | 293 | [265, 330] | [450, 840] |
We performed a careful normalisation of each spectrum, using cubic splines which were fitted through some tens of points at fixed wavelengths, where the continuum was known to be free of spectral lines and telluric features. The final selection of these nodal points was done after several tests and quality checks, making sure that, e.g., the wings of the Balmer-lines are not affected, but all artificial features (like periodic waves in the continuum) are corrected by the process. Cosmic removal via pixel-by-pixel sigma clipping and a sophisticated order-merging (taking into account the signal to noise values in the overlapping ranges, and correcting for the sometimes slightly different flux-levels of the overlapping orders) was also done by the same semi-automatic script. This is much faster and less subjective than one-by-one manual normalisation.
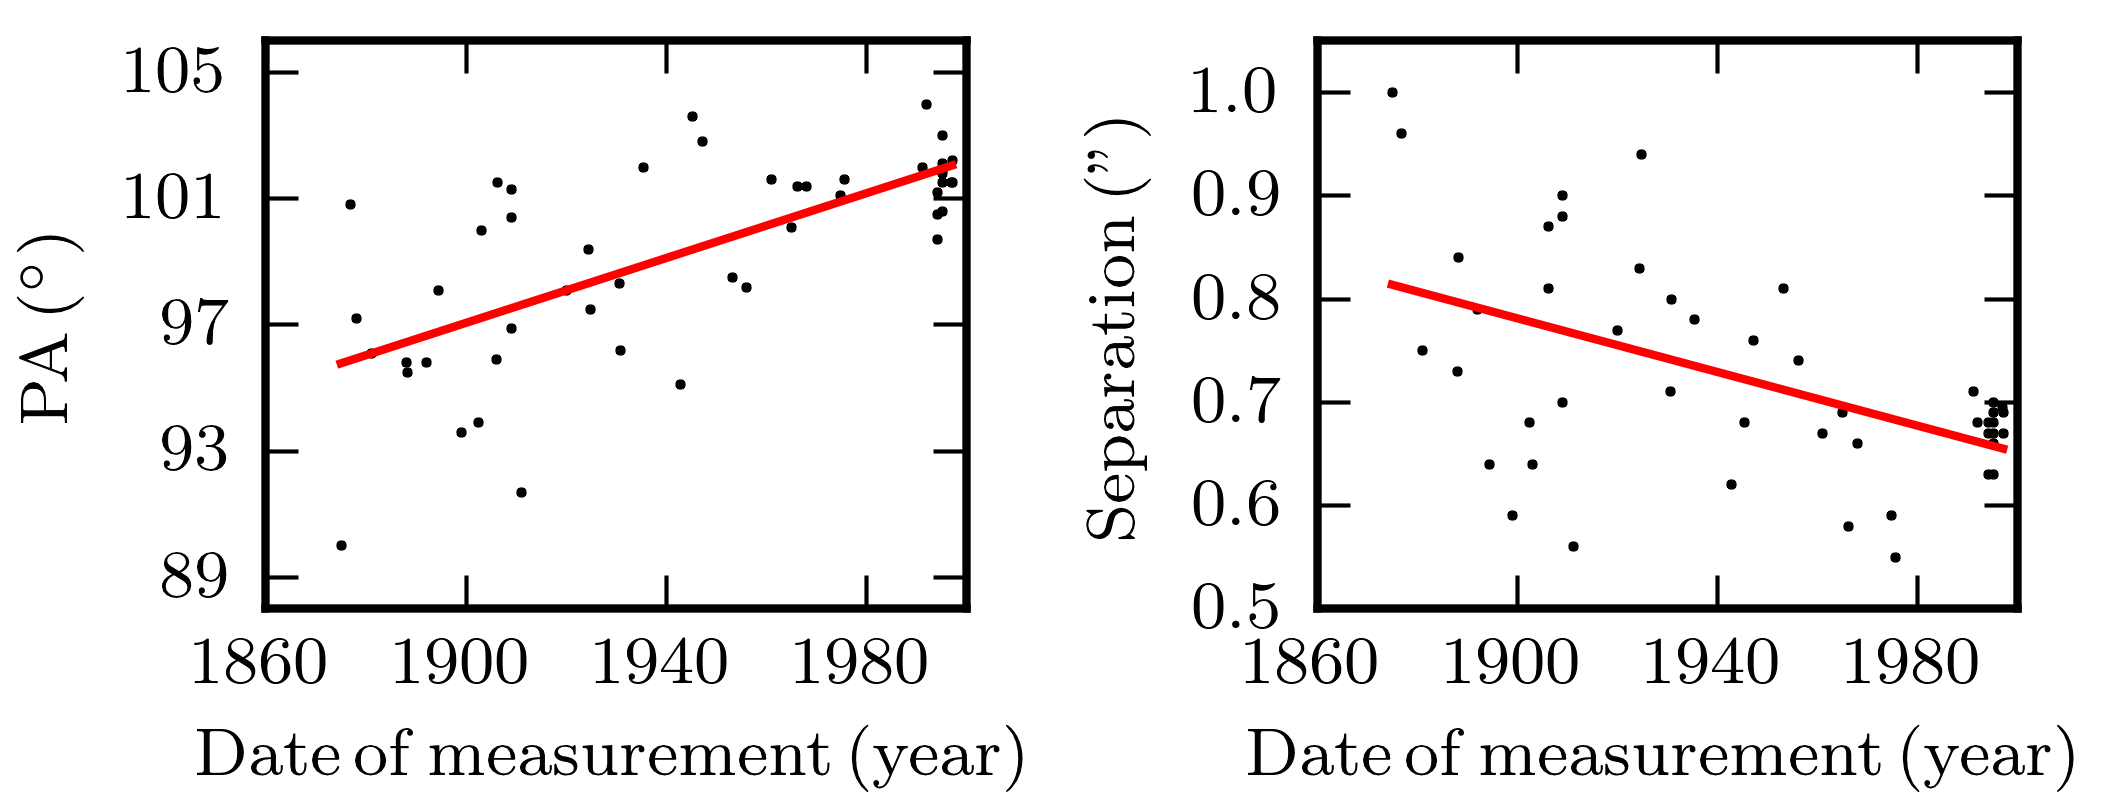
Radial velocities were measured from cross-correlated profiles – which were calculated from the three strongest Si iii lines (at , , and ) using the least-square deconvolution technique of Donati et al. (1997) – by fitting a simple Gaussian to them. It is clear from the determined radial velocities, that the orbital period has a timescale much longer than the timespan of the spectroscopic observations, and the orbit can not be fitted on this number of measurements. The idea of a very long orbital period is confirmed by position measurements covering 122 years found in the Washington Double Star Catalog also (see Table 3), which show only minor change during more than a century in position angle (which slowly increases), and in separation (which slowly decreases) – see Fig. 1.
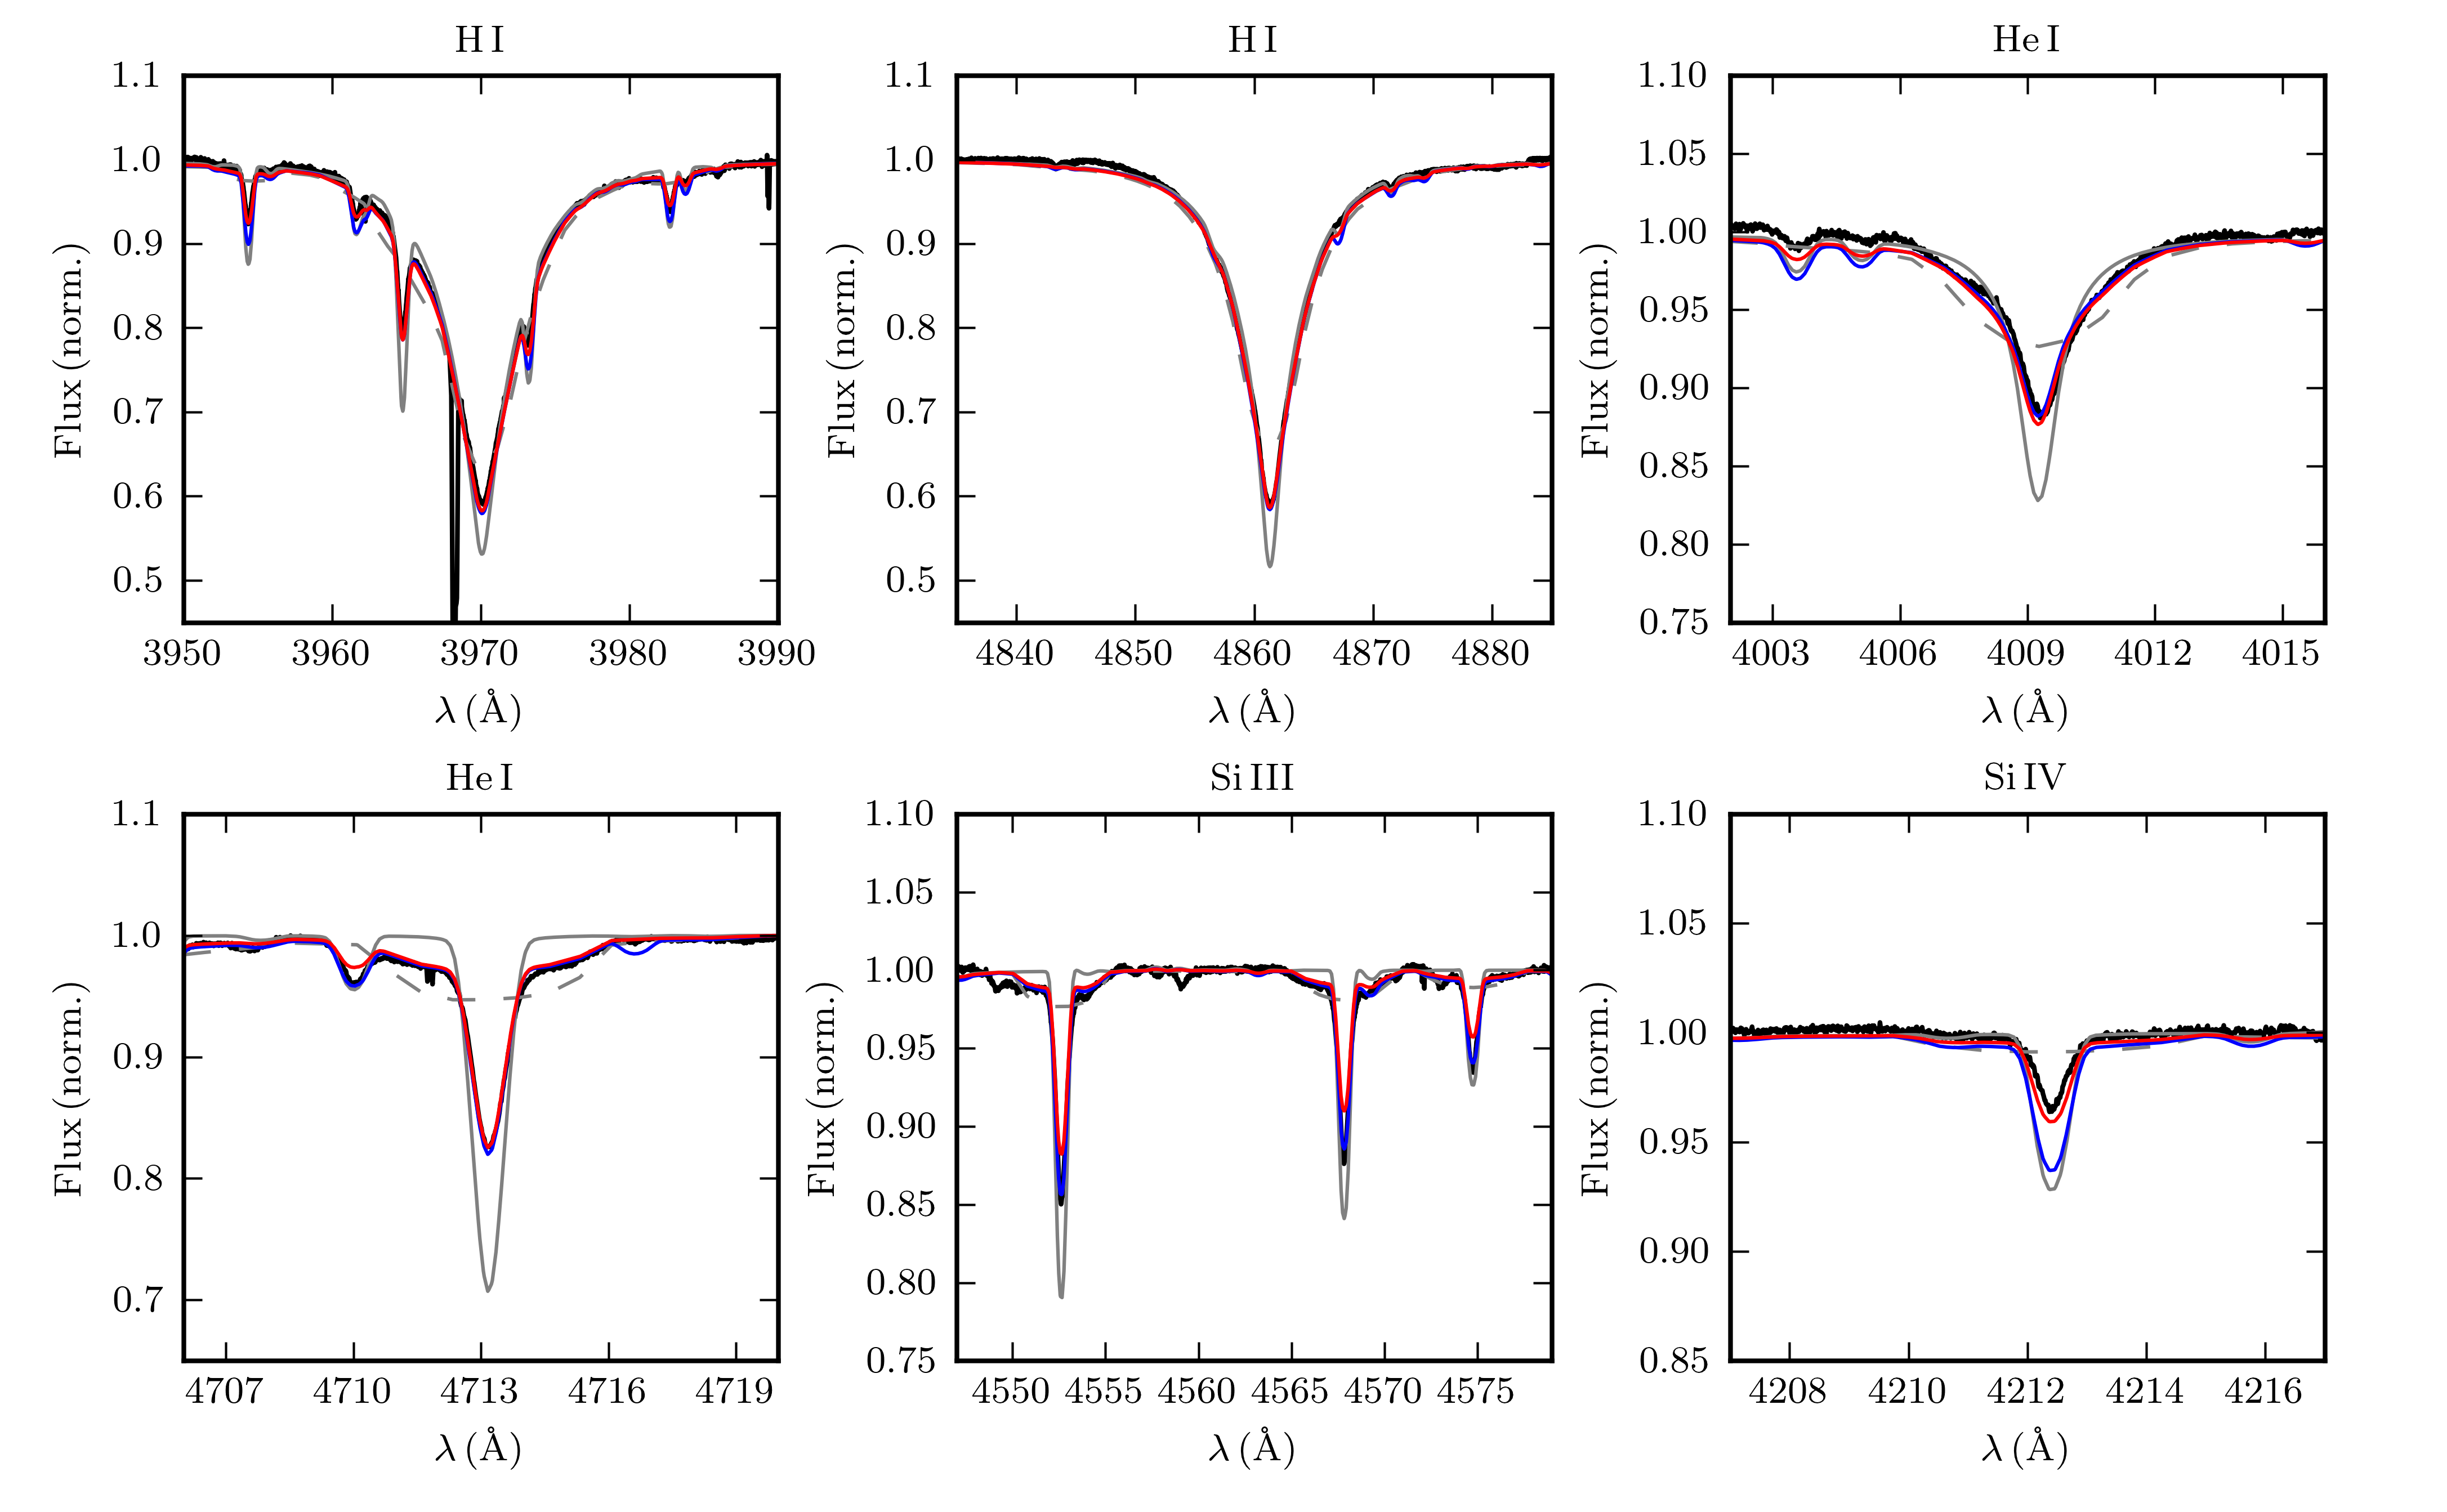
By visual inspection of the averaged spectrum of both instruments (and the original spectra), we conclude that HD 51756 is a double-line spectroscopic binary (SB2) with a slow (referred to as the primary from now on, as the sharp spectral features are connected to this star) and a fast rotator (secondary) star (see Fig. 2). Seeing both components in the spectrum is not surprising as the separation of the components is only , which is smaller than the fiber aperture of Coralie () and Harps (), and it is also below the average seeing of La Silla (), while the difference in brightness of the primary and the secondary is small.
Knowing the RV values corresponding to each exposure, we transferred all spectra to the laboratory rest frame (of the primary). At this point, we re-run the normalisation script (this way the nodal points are really at the same rest wavelength), and calculated the average spectrum for both instruments – using weights according to the calculated or given SNR values of each spectrum. The two average spectra calculated from Coralie and Harps are almost perfectly identical (with an SNR [5370-5400Å] of 873 and 1016, respectively). The spectra show only absorption features, except the Fe iii emission line at .
Though in the case of the individual Coralie spectra, the SNR levels were a bit lower than one would typically have for such analysis, we searched for line-profile variations using the FAMIAS software package (Zima 2008), but without any positive detection.
2.3 Fundamental parameters
An SB2 binary is extremely useful when the orbit can be fitted and, after spectral disentangling, a full analysis can be carried out on both components separately. In our case, this is not possible, due to the lack of knowledge concerning the orbital parameters.
To have a relatively fast but still accurate solution, we decided to carry out a full grid search with seven free parameters (, , and for both components, plus the metallicity which was assumed to be the same for both stars), using the OSTAR2002 (Lanz & Hubeny 2003) and BSTAR2006 (Lanz & Hubeny 2007) grids. These sets of synthetic spectra were both calculated from NLTE, plane-parallel, hydrostatic model atmospheres, with a microturbulent velocity of and for the OSTAR2002 and BSTAR2006 grid, respectively. Equivalent widths of the instrumental line profiles were also taken into account while calculating the broadening of the synthetic composite spectra. Chi-square () values were calculated using only regions of selected H i, He i, Si iii, and Si iv lines (some example fits are shown in Fig. 2). Errors were estimated by running the grid search using both the Coralie and Harps average spectra, using all four possible combinations of the two grids for the two components, and using more or fewer line regions for the calculation, then finally taking the most common parameters among the combinations with the lowest values as the final result, while the lowest and highest parameter values close to the minima of the set the error bars. A summary of the results is shown in Table 2. The two stars are very similar, the only difference being a different equatorial velocity or a different stellar inclination. The errors on the effective temperature and on the surface gravity might be slightly underestimated in case of the secondary, as this component contributes less to the overall appearance of the composite spectra because of the shallow lines caused by its high projected rotational velocity. The lowest values were reached by using the OSTAR2002 grid for the primary and the BSTAR2006 grid for the secondary (note that, not only the microturbulent velocity, but also the atomic data included in these model atmosphere grids are slightly different). Also a slight trend in the full set of results suggests that the secondary might be K cooler than the primary and it might have a slightly lower value compared to its companion star, but these deviations are within the given error bars. As shown below, this is in agreement with the observed mag brightness difference of the components. From the definition of the magnitude scale, and the relation between effective temperature and luminosity, we write
and, using this expression, we can give the upper limit of the difference in effective temperature and radii of the components. Assuming the same radii, we need to fulfill the equation, while assuming the same temperature requires . At a this means that the secondary can be cooler by a maximum of , which fits the results of the grid search within the errors.
| Parameter | Primary | Secondary |
| from spectroscopy | ||
| from evolutionary tracks | ||
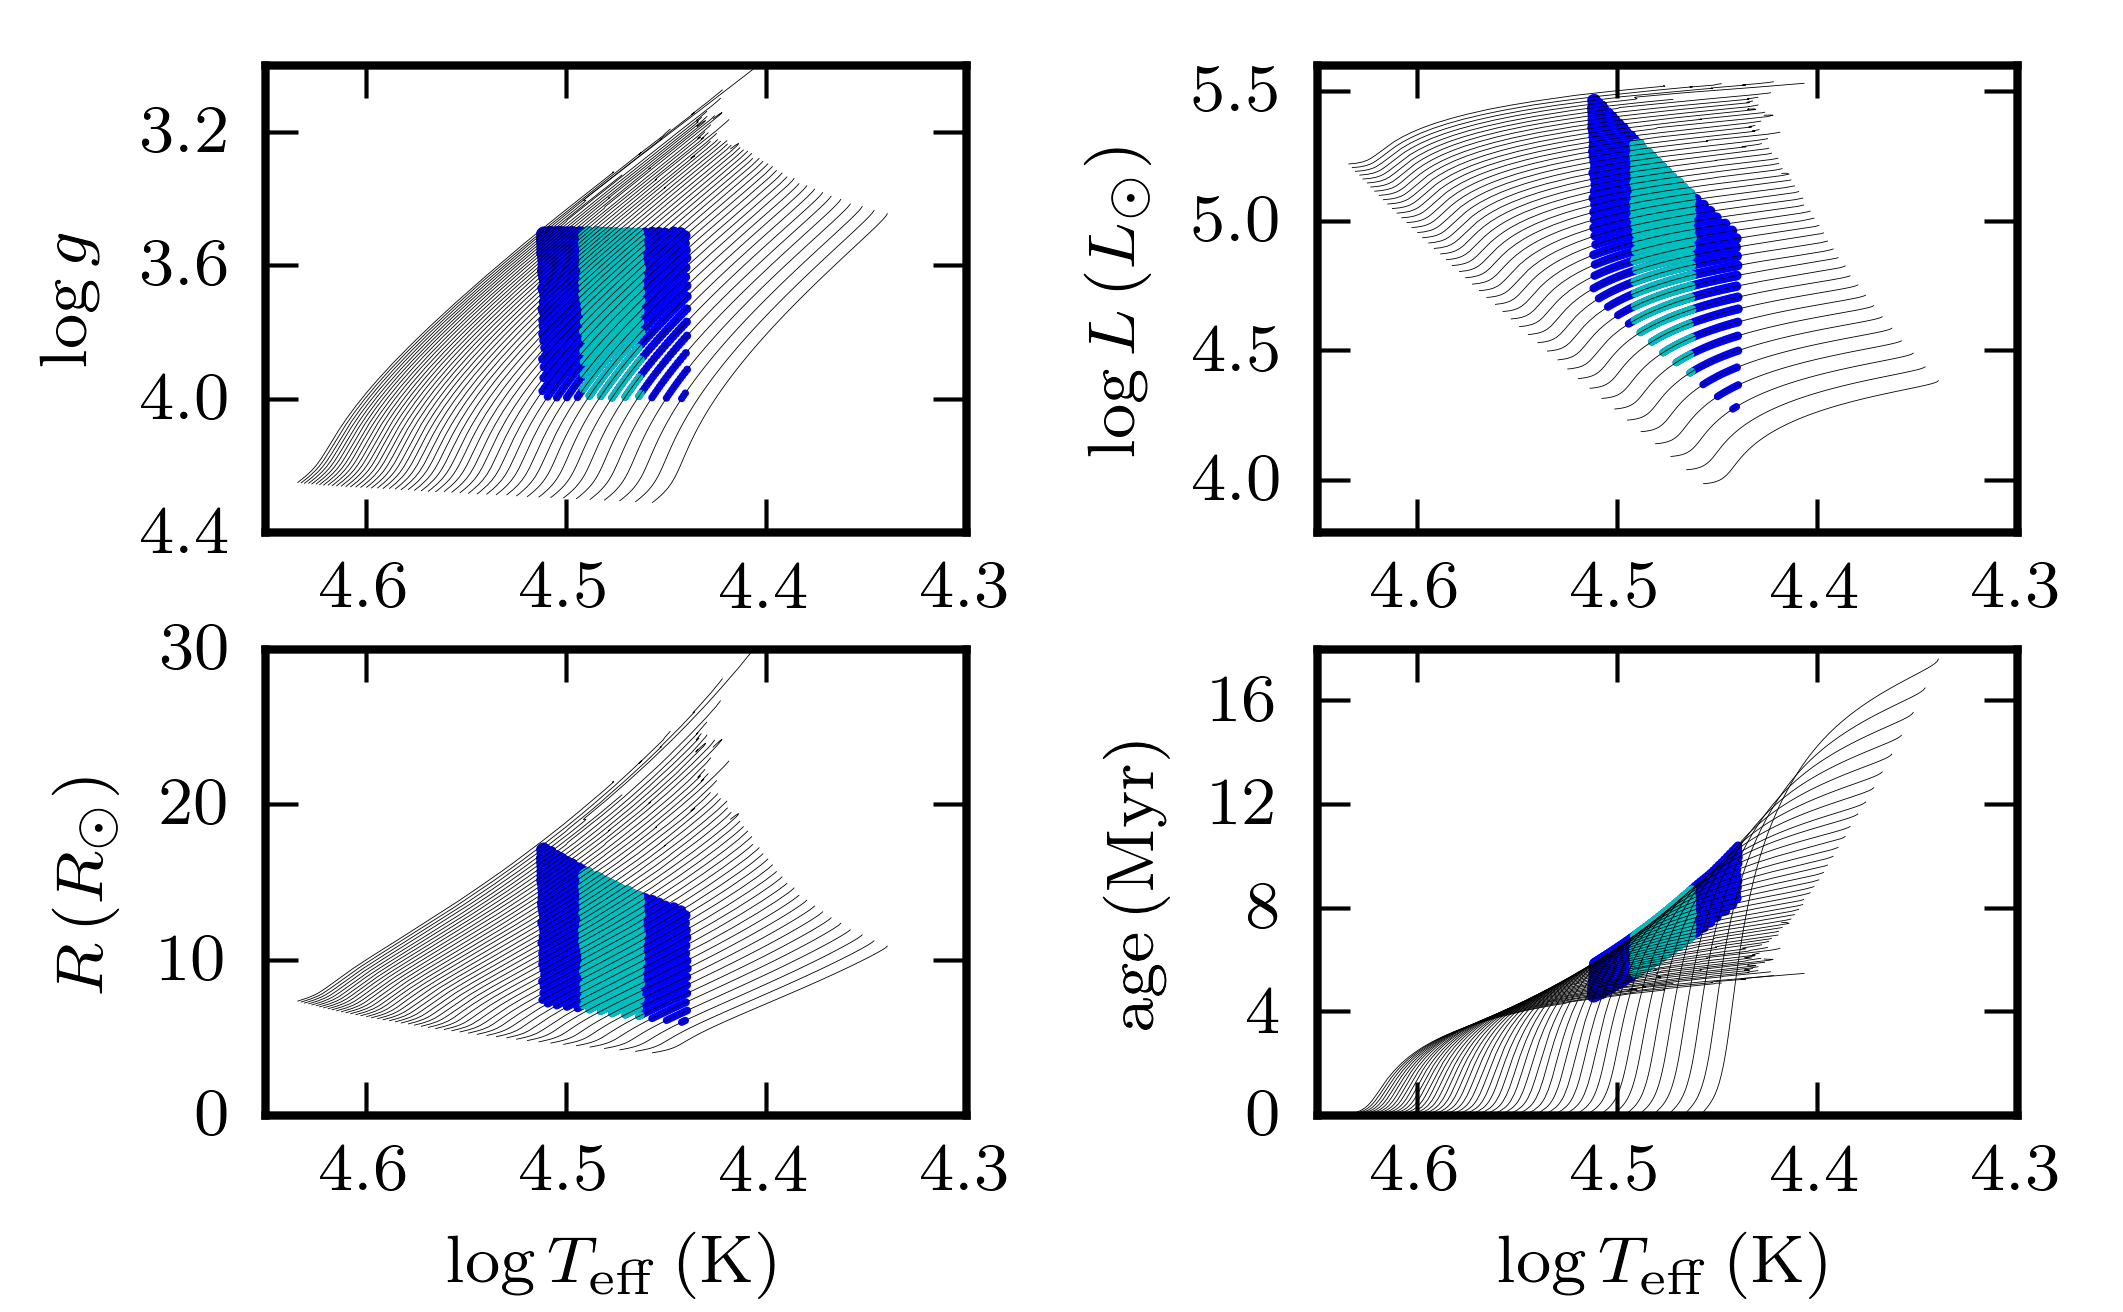
After we determined the and values of both components, we matched them with evolutionary tracks (see Fig. 3 and Fig. 4 for an overview, and Briquet et al. (2010) for a description of the input physics). As the lowest values indicated a minimum in between and , we fixed the metallicity at in accordance with Przybilla et al. (2008) who proposed the cosmic abundance standard (CAS) from early B-type stars in the solar neighborhood. We choose also in good agreement with the proposed CAS, and set the core overshoot parameter at pressure scale heights, since asteroseismic modeling results of Cep targets have given evidence for the occurrence of core overshooting of that order (Aerts et al. 2010). From the model points which lie within the error box set by the and determination, we estimated the stellar parameters of the components. These values and their uncertainties are listed in Table 2.
2.4 Constraints on the orbit
Using the masses from the evolutionary tracks (see Table 2), the distance-values (see Sect. 2.1), and the visual separation from the position measurements (Table 3), we calculate the expected orbital period of the AB components of the system to see if the slow change in position angle and separation is compatible with it. Assuming the simplest case, a circular, pole-on orbit, the semi-major axis (hence the radius in this simplified case) of the orbit is pc (using a distance of kpc representing the values mentioned in Sect. 2.1, and a separation of calculated from the most recent and precise interferometric measurements between 1994 and 1997). Using
we obtain an orbital period of year – with the errors covering all uncertainties. These values suggest a change of degrees in position angle during 122 years, which fits the observations (showing a change of ). Assuming an edge-on orbit, we derive an upper limit of the semi-amplitude of the radial velocity; . This – combined with the shallow profiles of the secondary due to its high projected rotational velocity and the relatively short timespan of the measurements (compared to the orbital period) – explains why there was no (measurable) wavelength-shift between the lines of the two components in the spectra.
3 The CoRoT light curve
3.1 Frequency analysis
HD 51756 was observed by the CoRoT satellite during the second long run of the mission (LRa02) as part of the asteroseismology programme, while monitoring a field in the direction of the Galactic anticenter from 2454784.491822 HJD for almost 115 days (from 13 November 2008 to 8 March 2009). All flagged observations were removed from the light curve, leaving us with 278 131 measurements (resulting in a duty cycle of %). The decreasing trend of the CoRoT light curve has a well known instrumental origin (Auvergne et al. 2009), hence it was also removed by dividing by a linear fit. As after this step there were no clear jumps or trends visible anymore, we used the resulting dataset in our analysis.
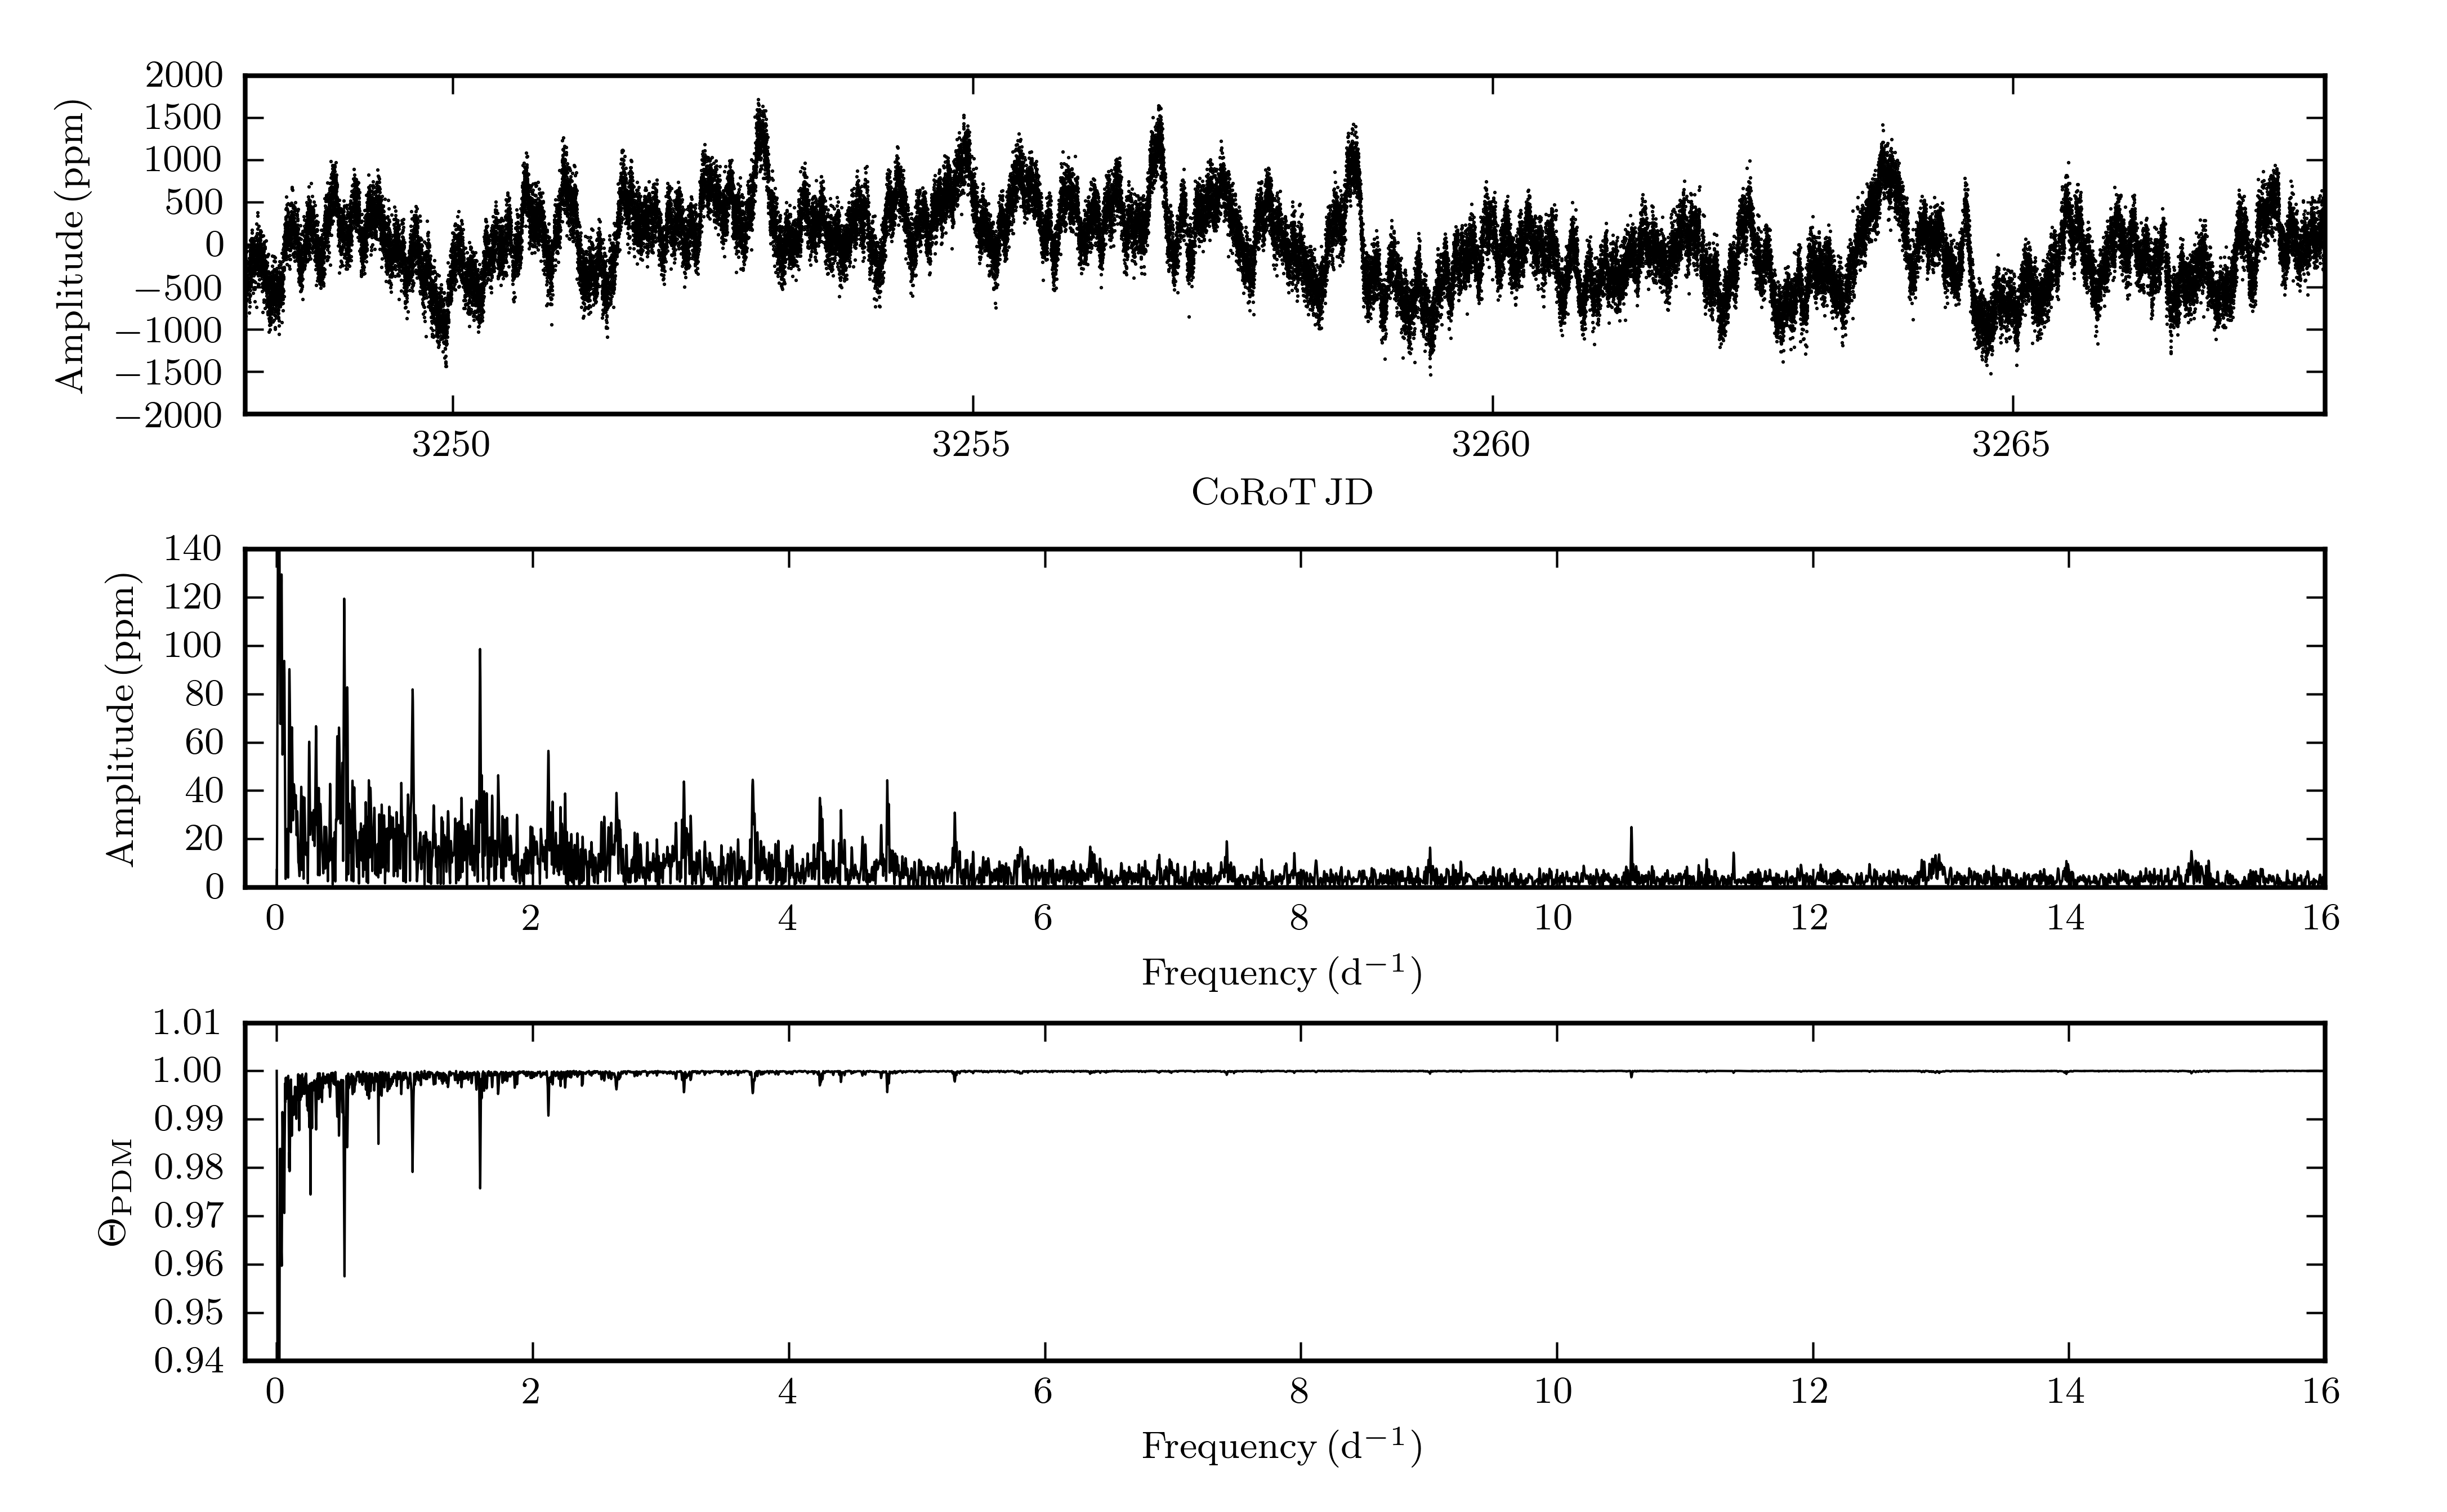
The first visual inspection of the light curve showed a well traceable repetitive pattern over almost all the timespan of the observation, with a length of days (see Fig. 5). The shape and features of the light curve show a noteworthy resemblance to the O8.5 V star HD 46149 observed during the SRa02 short run of CoRoT and analysed in detail by Degroote et al. (2010b).
We performed an iterative prewhitening procedure (see e.g. Degroote et al. 2009) using the traditional linear Scargle periodogram (Scargle 1982) . This resulted in a list of amplitudes (), frequencies (), and phases (), by which the light curve can be modelled via frequencies in the well-known form of
We consider a peak significant if it exceeds an amplitude signal-to-noise ratio of 4 (see Breger et al. 1993). The noise level was calculated as the average amplitude – before prewhitening – in a interval centered on the frequency of interest. Only 27 peaks of the Scargle periodogram (Fig. 5) met the signal-to-noise criterion, and using only the significant frequencies listed in Table 4, we are unable to model the light curve on a satisfactory level. Even using all the 93 peaks which have an SNR above 3, the constructed model lacks the characteristics of the original dataset, leaving most of the non-sinusoidal sharp features in the residual light curve. The noise level in the original periodogram around 1.5–5–10 is 20.7–7.8–3.7 ppm, respectively, while it is 15.7–7.1–3.5 ppm in the periodogram of the residual light curve (which was created by subtracting a model with the parameters listed in Table 4).
For comparison – and because of the non-sinusoidal shape of the signal – we also used the phase dispersion minimisation (PDM) method of Stellingwerf (1978) to calculate the -statistics, which shows the same global structure and features as the Scargle periodogram (see Fig. 5).
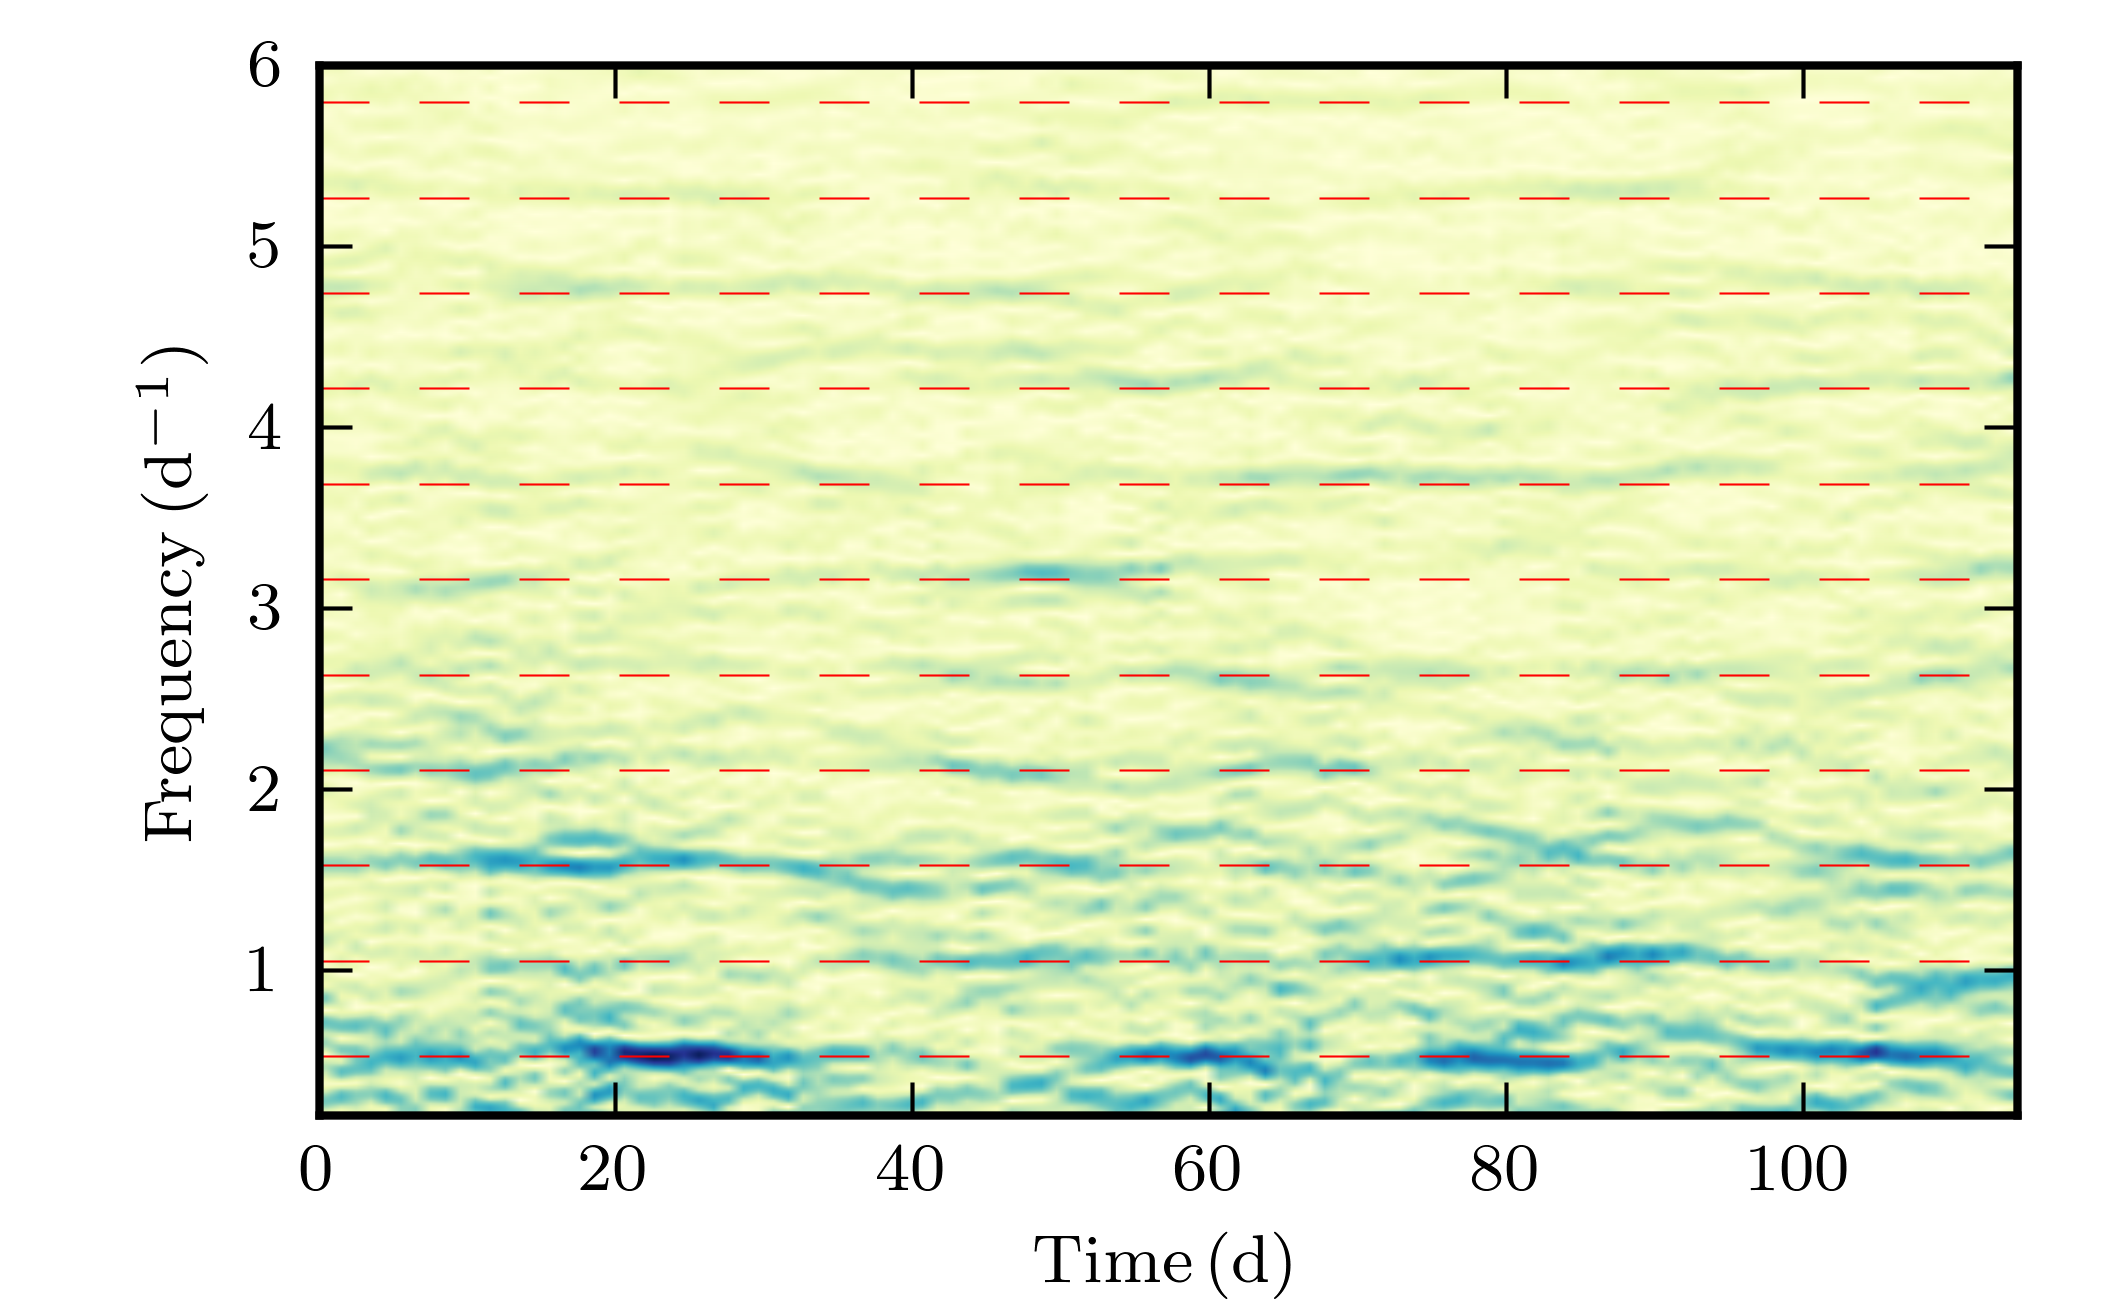
To check the stability of features in the frequency spectrum, time-resolved Fourier transformations were also calculated with different window widths. It is clearly visible from Fig. 6 that the amplitudes connected to the significant frequencies vary significantly over the span of the time series.
Of the 27 frequencies with , 11 are connected with (Table 4). All these frequency properties are a-typical for stellar oscillations in hot B stars and point towards another origin of the variability.
3.2 Repetitive patterns
The classical Fourier-techniques revealed a series of harmonics at integer multiple frequencies of the main peak at . All harmonics (using a notation of for the th harmonic of ) can be traced in the power spectrum down to (with ), plus and are also visible. There is a small but systematic difference between the observed and the exact values. Fixing the frequency values of the harmonics to and carrying out a nonlinear least-squares fitting procedure with these peaks gives a worse model, with remaining higher residual values caused by un-prewhitened peaks right next to the removed fixed frequency harmonics. The observed frequency values are always higher than the ones used in the fitting (fixed at integer multiples of ), and this difference increases with frequency (or ), starting with and continuously growing to . This might be a sign of rotational modulation with the rotational period of one of the components. If differential rotation were present, it could complicate the structure of the peaks and it might explain in part the differences between the observed peak values and exact multiples of .
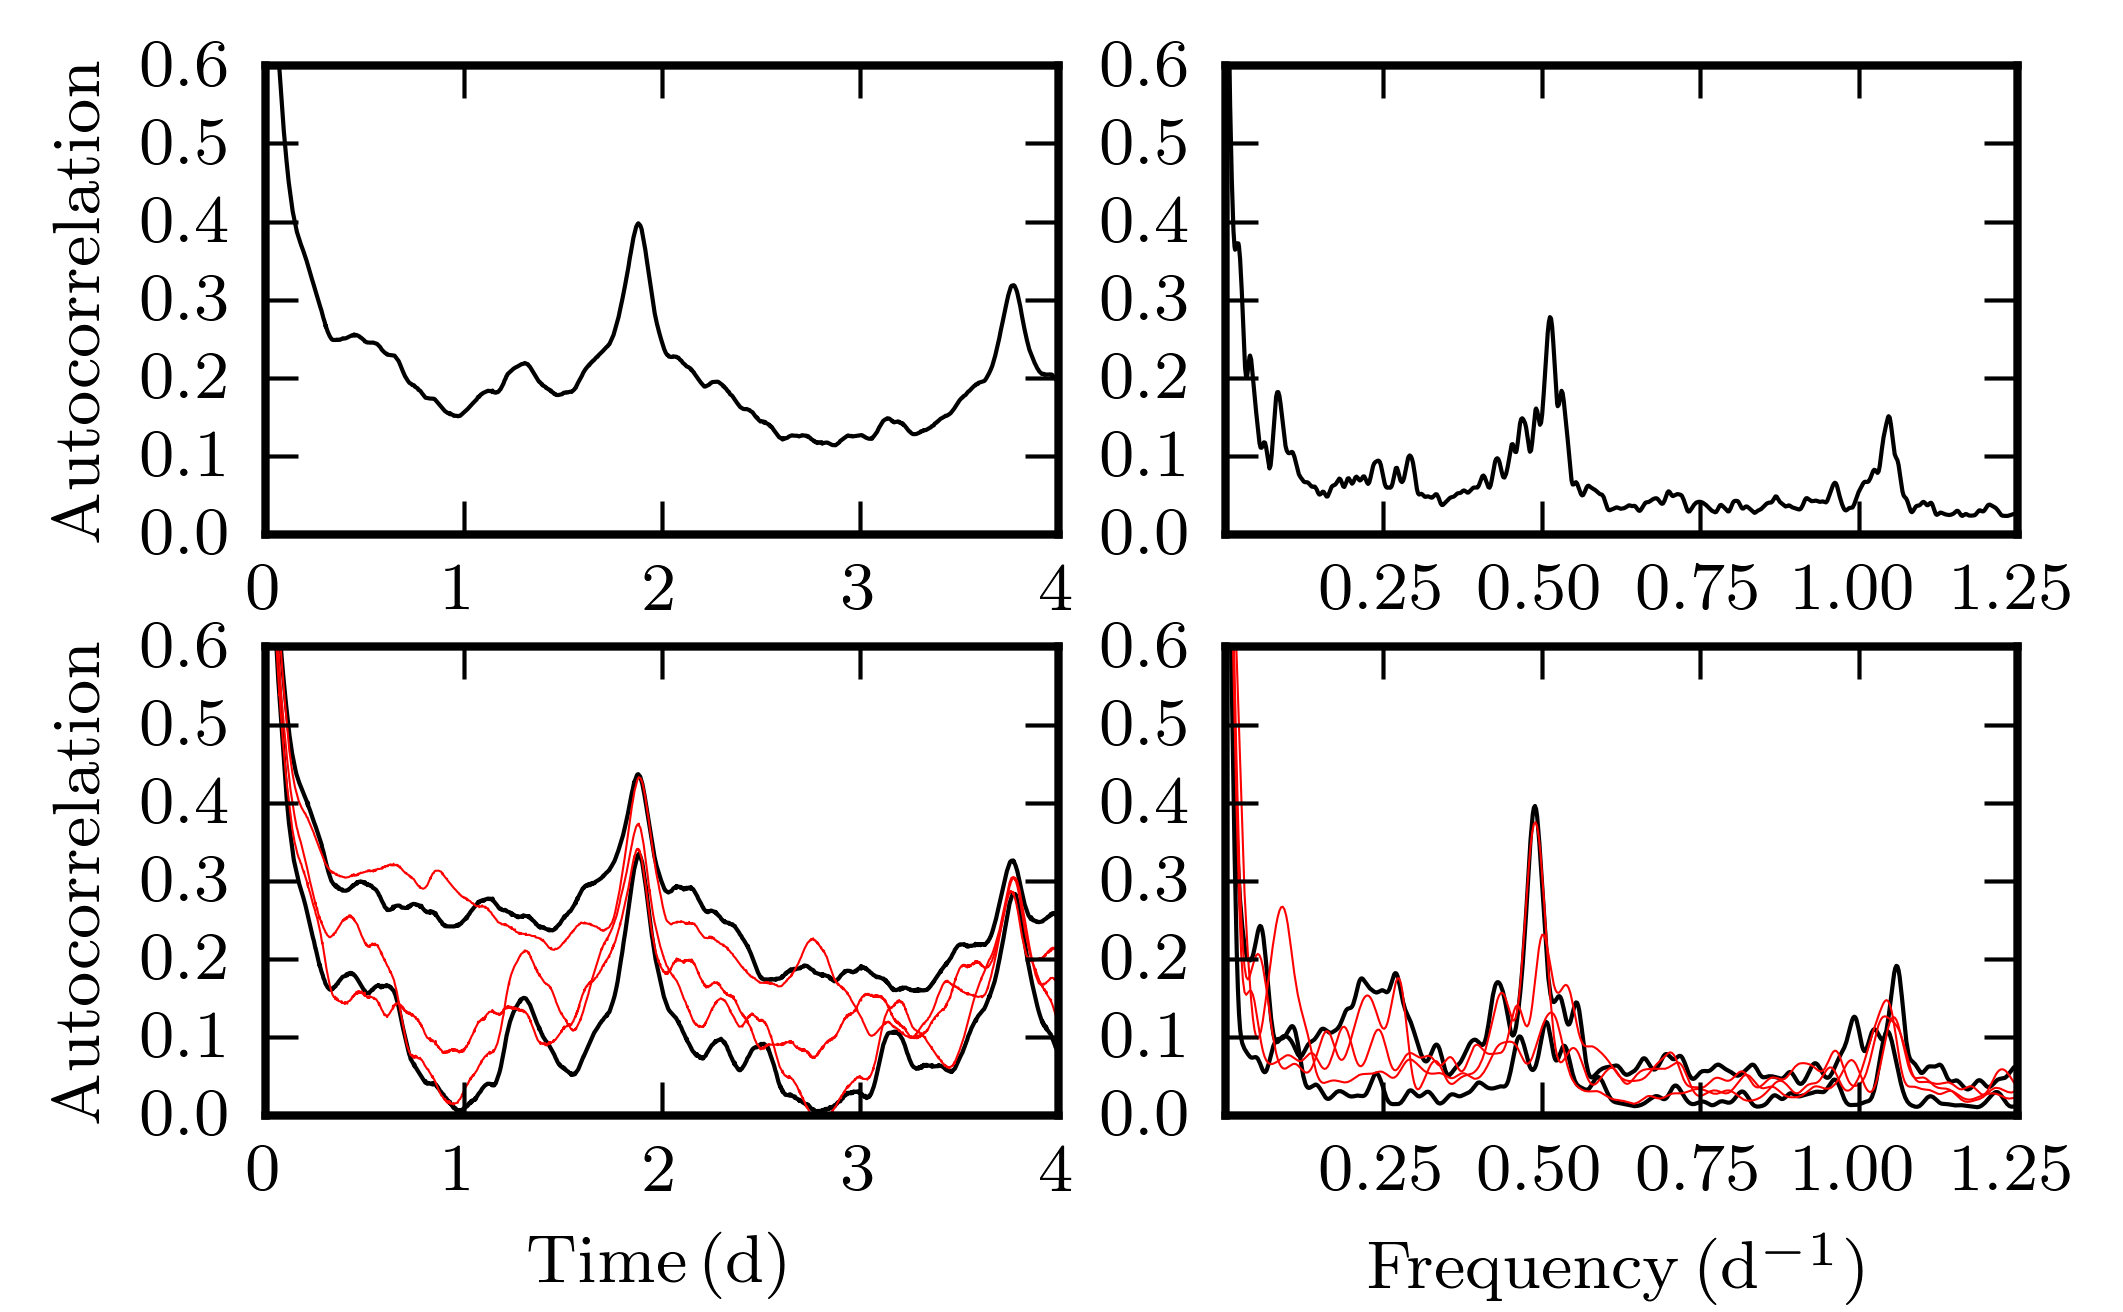
Another approach to search for spacings and recurrent features both in the light curve and the power spectrum is to use the autocorrelation function. We calculated the autocorrelation of the light curve, and the power spectrum (here the square of the Scargle periodogram). These tests were repeated after the dataset was cut into two, and three pieces, respectively. The results displayed on Fig. 7 show clear signs corresponding to the repetitive nature of the variations in the light curve. This signature stays quite clear even for shorter subsets of the data, but gets less significant in case of the power spectrum calculated from these data sets. Furthermore, the location of the first peak of the autocorrelation function stays almost perfectly the same even for three subsets, but this stability can not be seen in case of the autocorrelation of the power spectra of the subsets.
3.3 The origin of repetitive variations
A possible source of the variability might be atmospheric features, like spots or chemical inhomogeneities on the surface. In that case the observed brightness variations can be explained by the appearance and disappearance of such regions, either because of repeated creation or destruction or because of the rotation of the star. Here, we are in favour of the second option, because of the signal’s self-similarity, and because – as we show it below – it is consistent with the determined value. For further details on how these features can actually produce the observed cusp-like peaks, we refer to Degroote (2010).
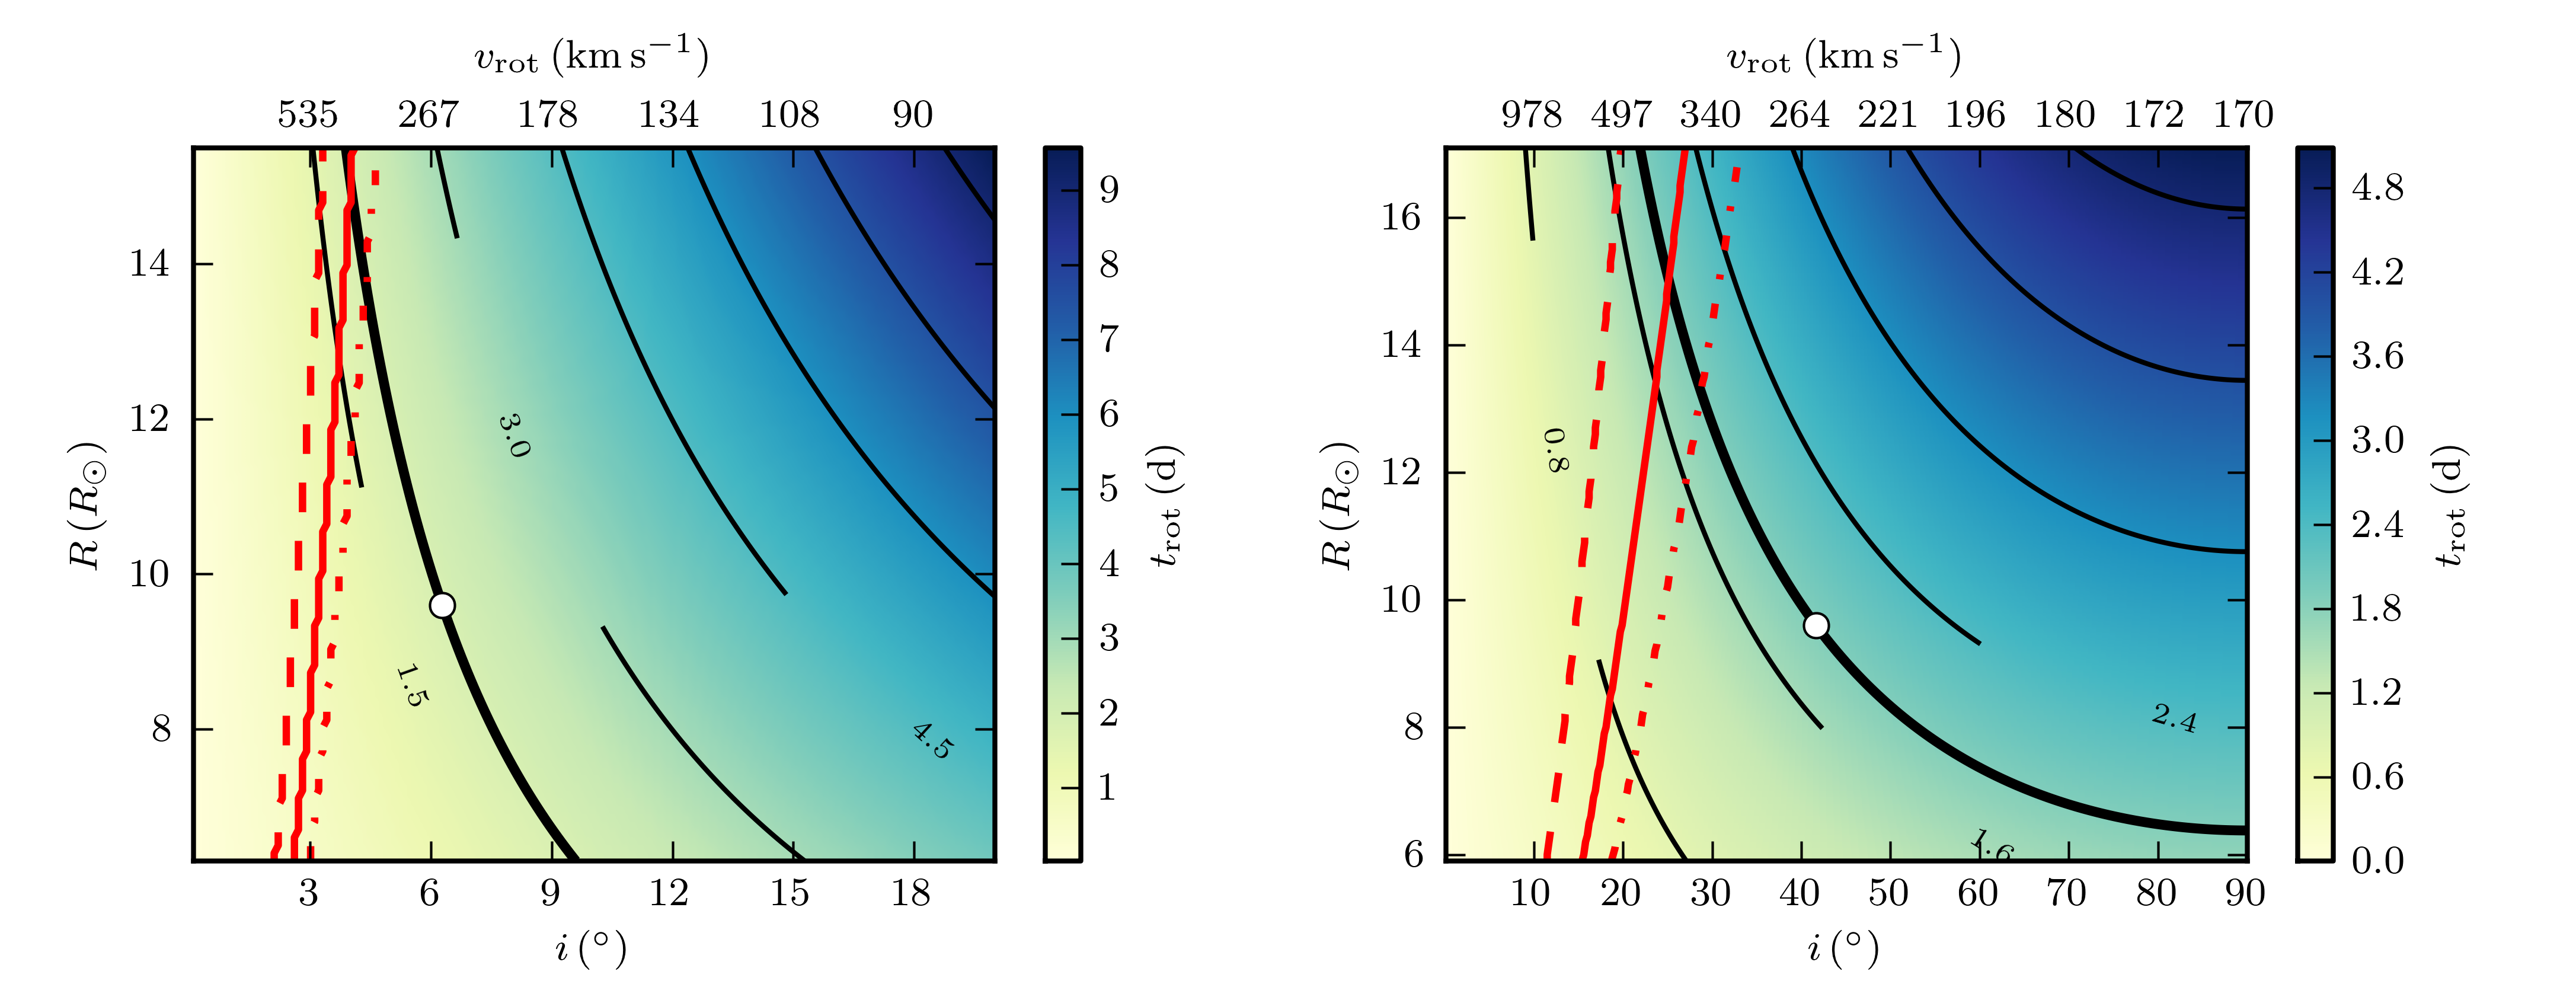
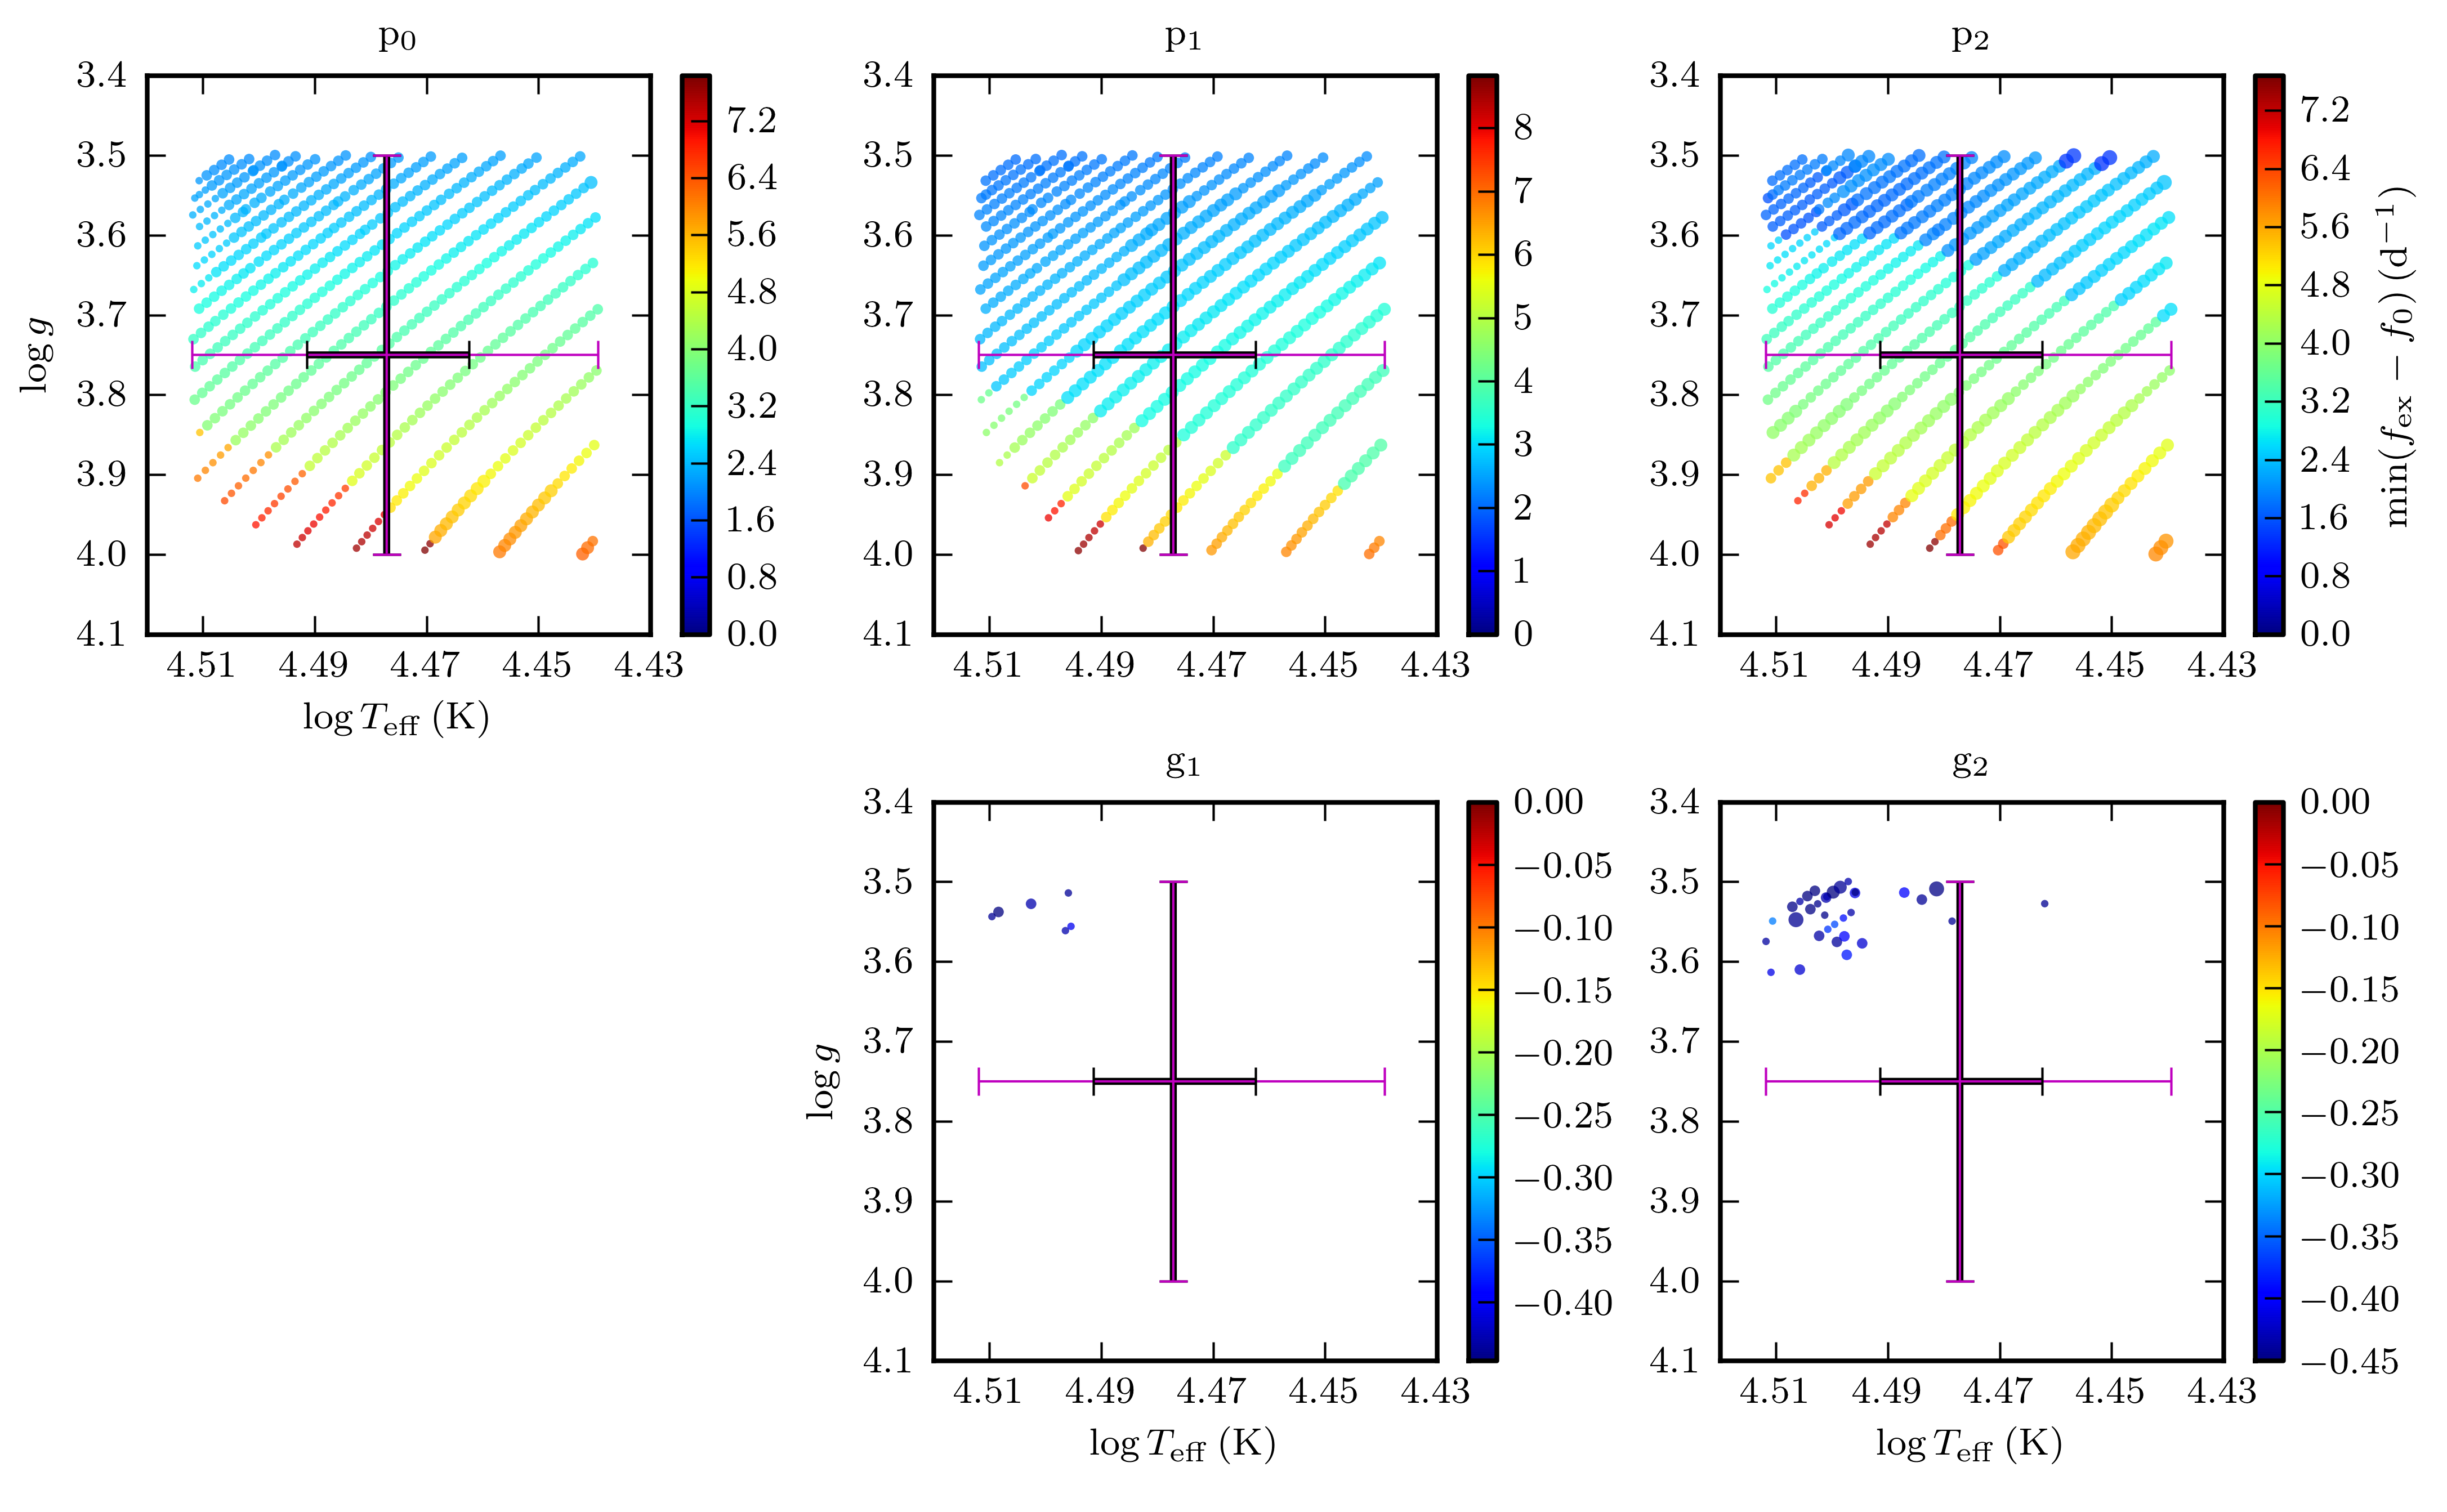
Knowing the projected rotational velocities of both components, we test if it is physically possible that one of the components has a rotational period which is compatible with our hypothesis that the series of harmonics in the frequency spectrum is a sign of rotational modulation. To carry out this test, we calculated the inclination values which correspond to a rotational period of within the error bars of the and values (from Table 2), and we checked if the equatorial rotational speed at this set-up was below the critical velocity for the given combination. If we suppose that the primary is responsible for the repetitive features in the light curve, then its inclination has to be degrees (Fig. 8). On the other hand, assuming that the variations are connected to the secondary, then we conclude an degrees and we end up with an equator-on solution already slightly before reaching the lowest possible value. Taking into account only the most probable values we end up with degrees and degrees.
As it is clearly visible on Fig. 8, these setups may result in exceeding the break-up velocity if the radius of the given component is in the very upper part of the error box. Lowering the mass, the radius limit also drops. We can conclude that most of the possible configurations are indeed compatible with our hypothesis of a rotational origin of the variability.
3.4 Inferences from the non-detection of pulsation
For all the models passing through the error boxes of the primary and secondary indicated in Fig. 3, we considered the frequencies of the fundamental radial mode and of the few lowest radial overtones, as well as the lowest-order p and g axisymmetric modes of degree 1 and 2. None of those eigenfrequencies come close to . It is thus very unlikely that , with so many harmonics present in the light curve, results from a pulsation mode, as one does not expect a high-overtone mode or a high-degree mode to show so many harmonics of its frequency (e.g., Degroote et al. 2009).
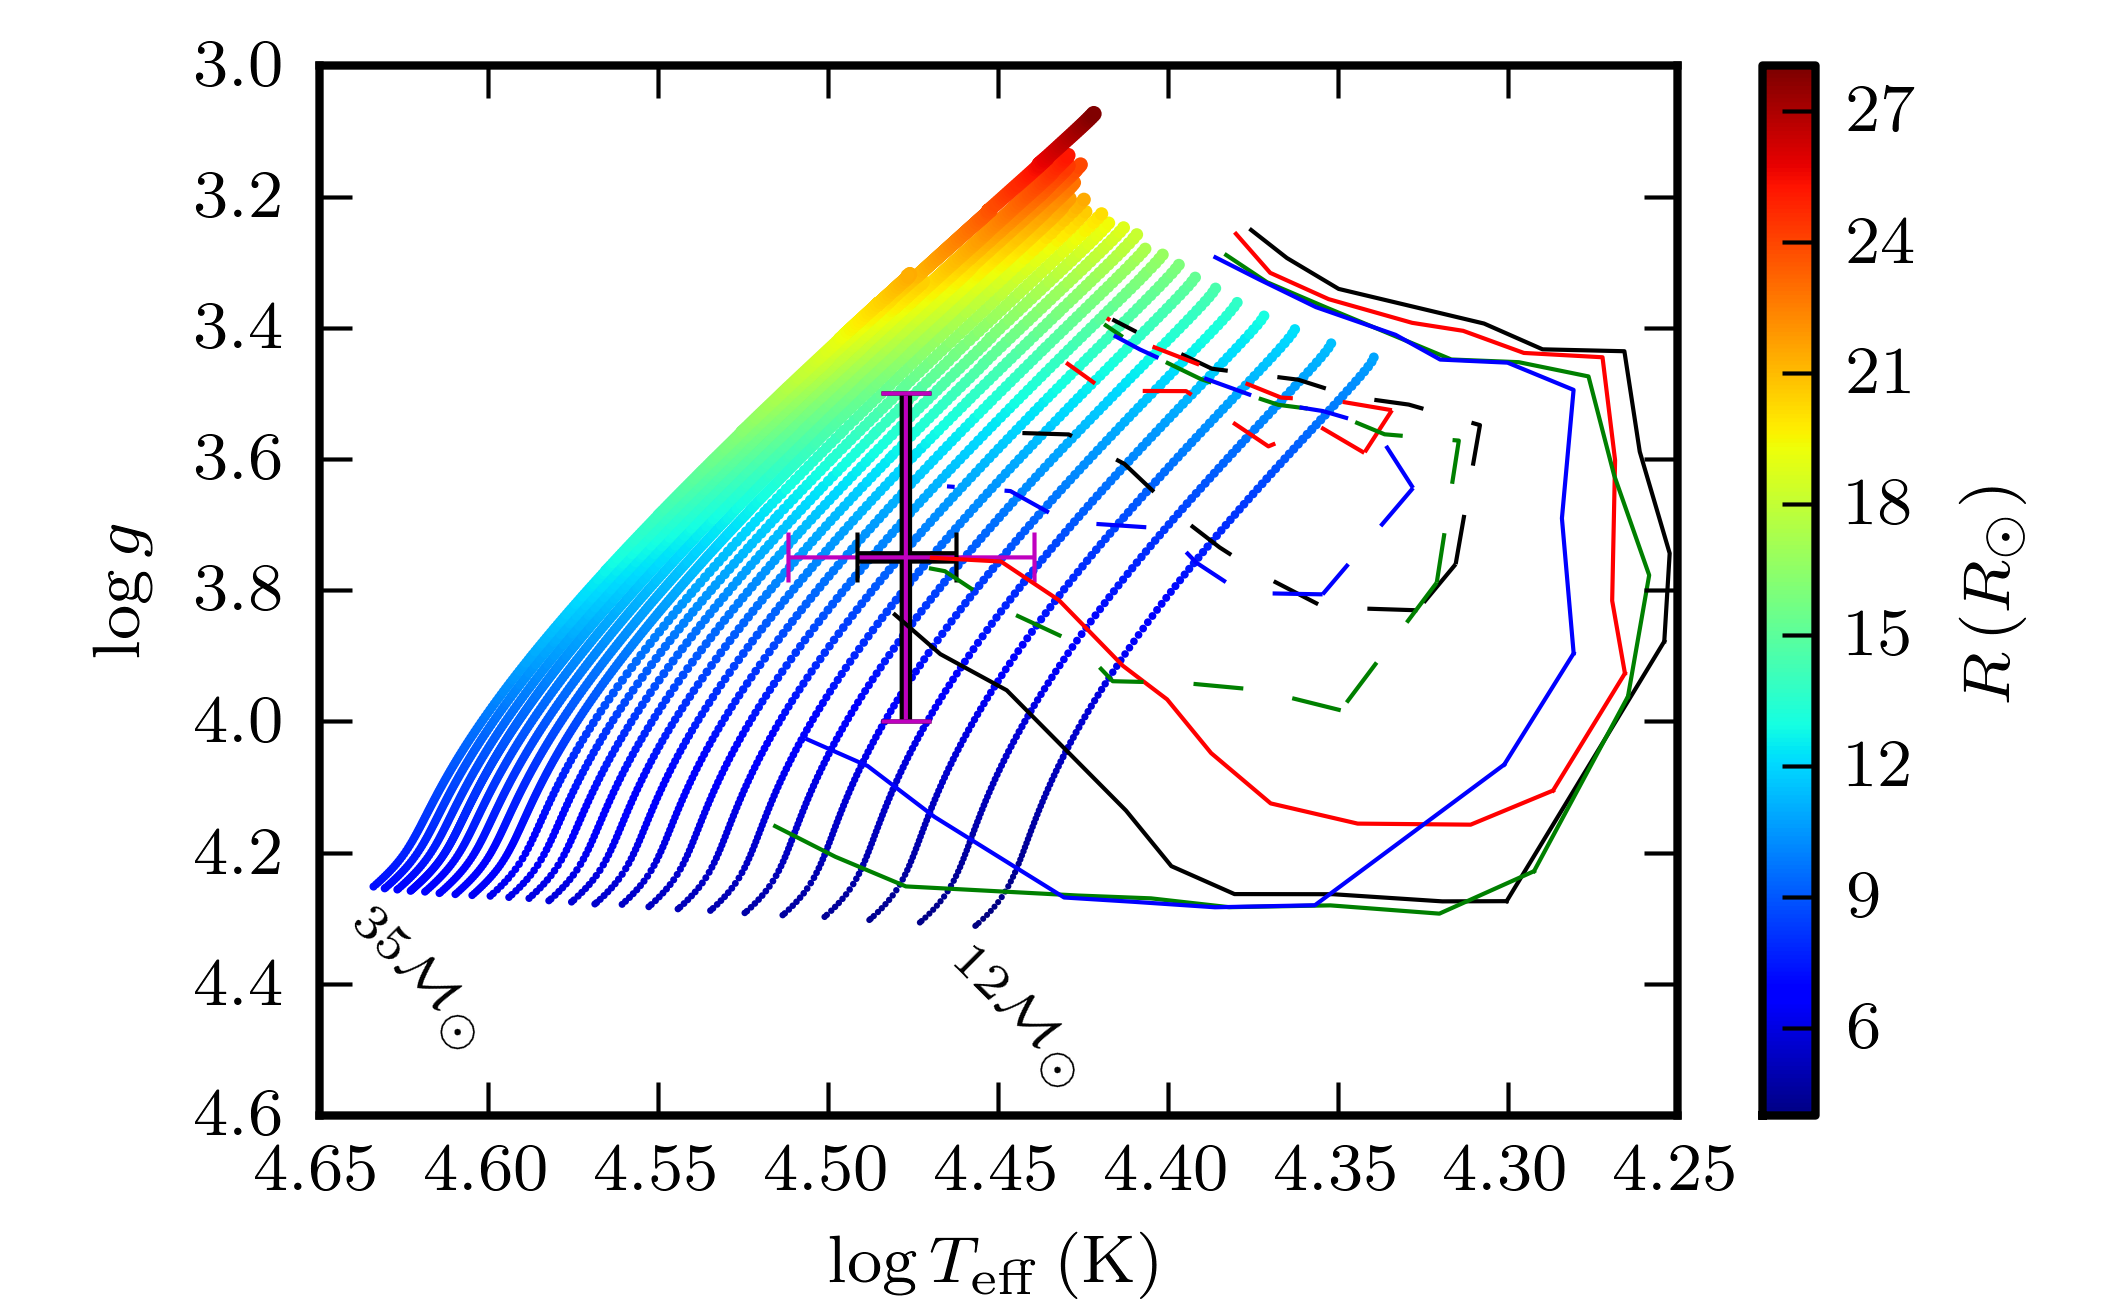
We made non-adiabatic computations (with the code MAD developed by Dupret et al. 2002) for the mentioned models to check which modes are predicted to be excited by the present input physics and theory of mode excitation (see Fig. 9). We need to understand why the star does not oscillate, as the theoretical calculations predict p modes to be excited throughout the error box of HD 51756, except the very bottom left region. Typical frequencies are around the center of our error box. This range extends until and towards the lower and higher gravity values, respectively. Moreover, g modes are also expected to be excited in some of the higher mass models, with frequencies near .
Finally, we should remember that CoRoT measured the integrated flux from two stars, therefore the observed amplitude of the rotational modulation is damped, and this would be true also for the amplitudes of the pulsational modes, if any.
4 Conclusions
We analysed high-resolution spectroscopy and high-quality space based photometry of HD 51756. The former – via synthetic spectrum fitting and matching the results with evolutionary tracks – enabled us to derive the fundamental stellar parameters of both components of the underlying double lined spectroscopic binary, while the latter led us to conclude that none of these stars show pulsations. We interpret the repetitive patterns of the light curve, the observed harmonic structure in the frequency spectrum, and the strong, stable peaks in the autocorrelation functions as signs for rotational modulation. This hypothesis is compatible with the observed and deduced stellar parameters.
The absence of oscillations in the components of HD 51756 requires an explanation. It was recently found by Balona et al. (in preparation) that some stars observed with the Kepler space mission, which are also monitored at mag precision and situated in the Cep instability strip, do not pulsate either. A mixture of non-pulsators and pulsators with or without rotational modulation was already established from ground-based data for stars in the g-mode instability strip of the cooler slowly pulsating B stars (e.g., Briquet et al. 2004). It was interpreted as due to a difference in magnetic field strength and age, the Bp stars being younger and having stronger fields than the pulsators, although this interpretation is still a matter of debate (e.g., Briquet et al. 2007a; Silvester et al. 2009). As far as we are aware, no magnetic field measurements are available for HD 51756.
Acknowledgements.
The research leading to these results has received funding from the European Research Council under the European Community’s Seventh Framework Programme (FP7/2007–2013)/ERC grant agreement n∘227224 (PROSPERITY), as well as from the Research Council of K.U.Leuven grant agreement GOA/2008/04. EN acknowledges financial support of the NN203 302635 grant from the MNiSW. EP and MR acknowledge financial support from the Italian ESS project, contract ASI/INAF I/015/07/0, WP 03170. This research has made use of the Washington Double Star Catalog maintained at the U.S. Naval Observatory.References
- Abt (2008) Abt, H. A. 2008, ApJS, 176, 216
- Aerts et al. (2010) Aerts, C., Christensen-Dalsgaard, J., & Kurtz, D. W. 2010, Asteroseismology (Springer)
- Aerts et al. (2003) Aerts, C., Thoul, A., Daszyńska, J., et al. 2003, Science, 300, 1926
- Ausseloos et al. (2004) Ausseloos, M., Scuflaire, R., Thoul, A., & Aerts, C. 2004, MNRAS, 355, 352
- Auvergne et al. (2009) Auvergne, M., Bodin, P., Boisnard, L., et al. 2009, A&A, 506, 411
- Avedisova & Kondratenko (1984) Avedisova, V. S. & Kondratenko, G. I. 1984, Nauchnye Informatsii, 56, 59
- Baade et al. (1988) Baade, D., Daachs, J., van de Weygaert, R., & Steeman, F. 1988, A&A, 198, 211
- Baglin et al. (2006) Baglin, A., Auvergne, M., Barge, P., et al. 2006, in ESA Special Publication, Vol. 1306, ESA Special Publication, ed. M. Fridlund, A. Baglin, J. Lochard, & L. Conroy, 33
- Baize (1938) Baize, P. 1938, Journal des Observateurs, 21, 161
- Baranne et al. (1996) Baranne, A., Queloz, D., Mayor, M., et al. 1996, A&AS, 119, 373
- Behall (1976) Behall, A. L. 1976, Publications of the U.S. Naval Observatory Second Series, 24, 1
- Belkacem et al. (2009) Belkacem, K., Samadi, R., Goupil, M., et al. 2009, Science, 324, 1540
- Breger et al. (1993) Breger, M., Stich, J., Garrido, R., et al. 1993, A&A, 271, 482
- Briquet et al. (2010) Briquet, M., Aerts, C., Baglin, A., et al. 2010, A&A, submitted
- Briquet et al. (2004) Briquet, M., Aerts, C., Lüftinger, T., et al. 2004, A&A, 413, 273
- Briquet et al. (2007a) Briquet, M., Hubrig, S., De Cat, P., et al. 2007a, A&A, 466, 269
- Briquet et al. (2007b) Briquet, M., Morel, T., Thoul, A., et al. 2007b, MNRAS, 381, 1482
- Briquet et al. (2009) Briquet, M., Uytterhoeven, K., Morel, T., et al. 2009, A&A, 506, 269
- Burnham (1875) Burnham, S. W. 1875, AN, 86, 337
- Degroote (2010) Degroote, P. 2010, PhD thesis, K.U.Leuven
- Degroote et al. (2010a) Degroote, P., Aerts, C., Baglin, A., et al. 2010a, Nature, 464, 259
- Degroote et al. (2010b) Degroote, P., Briquet, M., Auvergne, M., et al. 2010b, A&A, 519, A38
- Degroote et al. (2009) Degroote, P., Briquet, M., Catala, C., et al. 2009, A&A, 506, 111
- Desmet et al. (2009) Desmet, M., Briquet, M., Thoul, A., et al. 2009, MNRAS, 396, 1460
- Donati et al. (1997) Donati, J., Semel, M., Carter, B. D., Rees, D. E., & Collier Cameron, A. 1997, MNRAS, 291, 658
- Doolittle (1905) Doolittle, E. 1905, Publications of the Flower Astronomical Observatory, 2, 1
- Douglass et al. (1999) Douglass, G. G., Mason, B. D., Germain, M. E., & Worley, C. E. 1999, AJ, 118, 1395
- Dupret et al. (2002) Dupret, M., De Ridder, J., Neuforge, C., Aerts, C., & Scuflaire, R. 2002, A&A, 385, 563
- Dworetsky et al. (1982) Dworetsky, M. M., Whitelock, P. A., & Carnochan, D. J. 1982, MNRAS, 200, 445
- Eddington et al. (1912) Eddington, S., Bryant, W., Chapman, S., et al. 1912, MNRAS, 73, 93
- ESA (1997) ESA. 1997, VizieR Online Data Catalog, 1239, 0
- Fabricius et al. (2002) Fabricius, C., Høg, E., Makarov, V. V., et al. 2002, A&A, 384, 180
- Fich & Blitz (1984) Fich, M. & Blitz, L. 1984, ApJ, 279, 125
- Floquet et al. (2009) Floquet, M., Hubert, A., Huat, A., et al. 2009, A&A, 506, 103
- Germain et al. (1999) Germain, M. E., Douglass, G. G., & Worley, C. E. 1999, AJ, 117, 1905
- Glebocki & Stawikowski (2000) Glebocki, R. & Stawikowski, A. 2000, Acta Astron., 50, 509
- Gulati et al. (1989) Gulati, R. K., Malagnini, M. L., & Morossi, C. 1989, A&AS, 80, 73
- Gutiérrez-Soto et al. (2009) Gutiérrez-Soto, J., Floquet, M., Samadi, R., et al. 2009, A&A, 506, 133
- Handler (2009) Handler, G. 2009, MNRAS, 398, 1339
- Handler et al. (2006) Handler, G., Jerzykiewicz, M., Rodríguez, E., et al. 2006, MNRAS, 365, 327
- Hill (1967) Hill, G. 1967, ApJS, 14, 263
- Horch et al. (2001) Horch, E., van Altena, W. F., Girard, T. M., et al. 2001, AJ, 121, 1597
- Huat et al. (2009) Huat, A., Hubert, A., Baudin, F., et al. 2009, A&A, 506, 95
- Kaltcheva & Hilditch (2000) Kaltcheva, N. T. & Hilditch, R. W. 2000, MNRAS, 312, 753
- Kaufer et al. (1999) Kaufer, A., Stahl, O., Tubbesing, S., et al. 1999, The Messenger, 95, 8
- Lanz & Hubeny (2003) Lanz, T. & Hubeny, I. 2003, ApJS, 146, 417
- Lanz & Hubeny (2007) Lanz, T. & Hubeny, I. 2007, ApJS, 169, 83
- Leavenworth & Beal (1930) Leavenworth, F. & Beal, W. O. 1930, Measures of double stars, ed. Leavenworth, F. & Beal, W. O.
- Lewis et al. (1904) Lewis, T., Bowyer, W., Bryant, W., & Furner, H. 1904, MNRAS, 64, 789
- Mayor et al. (2003) Mayor, M., Pepe, F., Queloz, D., et al. 2003, The Messenger, 114, 20
- Mazumdar et al. (2006) Mazumdar, A., Briquet, M., Desmet, M., & Aerts, C. 2006, A&A, 459, 589
- Michel et al. (2006) Michel, E., Baglin, A., Auvergne, M., et al. 2006, in ESA Special Publication, Vol. 1306, ESA Special Publication, ed. M. Fridlund, A. Baglin, J. Lochard, & L. Conroy, 39
- Miglio et al. (2007) Miglio, A., Montalbán, J., & Dupret, M. 2007, CoAst, 151, 48
- Morgan et al. (1955) Morgan, W. W., Code, A. D., & Whitford, A. E. 1955, ApJS, 2, 41
- Münch (1951) Münch, L. 1951, ApJ, 113, 309
- Neiner et al. (2009) Neiner, C., Gutiérrez-Soto, J., Baudin, F., et al. 2009, A&A, 506, 143
- Olivier (1907) Olivier, C. P. 1907, AN, 174, 209
- Olivier (1928) Olivier, C. P. 1928, AN, 233, 393
- Olivier (1932) Olivier, C. P. 1932, Publications of the Flower Astronomical Observatory, 5, 1
- Olivier et al. (1909) Olivier, C. P., Wilson, R. E., & Neff, W. N. 1909, AN, 182, 253
- Pamyatnykh et al. (2004) Pamyatnykh, A. A., Handler, G., & Dziembowski, W. A. 2004, MNRAS, 350, 1022
- Perryman et al. (1997) Perryman, M. A. C., Lindegren, L., Kovalevsky, J., et al. 1997, A&A, 323, L49
- Przybilla et al. (2008) Przybilla, N., Nieva, M., & Butler, K. 2008, ApJ, 688, L103
- Queloz et al. (2001) Queloz, D., Mayor, M., Udry, S., et al. 2001, The Messenger, 105, 1
- Rivinius et al. (2003) Rivinius, T., Baade, D., & Štefl, S. 2003, A&A, 411, 229
- Rivinius et al. (2001) Rivinius, T., Baade, D., Štefl, S., et al. 2001, A&A, 369, 1058
- Savage et al. (1985) Savage, B. D., Massa, D., Meade, M., & Wesselius, P. R. 1985, ApJS, 59, 397
- Scargle (1982) Scargle, J. D. 1982, ApJ, 263, 835
- Silvester et al. (2009) Silvester, J., Neiner, C., Henrichs, H. F., et al. 2009, MNRAS, 398, 1505
- Solano et al. (2005) Solano, E., Catala, C., Garrido, R., et al. 2005, AJ, 129, 547
- Stellingwerf (1978) Stellingwerf, R. F. 1978, ApJ, 224, 953
- Stone (1879) Stone, O. 1879, Publications of the Cincinnati Observatory, 5, 1
- Tarrant (1890) Tarrant, K. J. 1890, AN, 125, 225
- van Leeuwen (2007) van Leeuwen, F. 2007, A&A, 474, 653
- Vogt (1976) Vogt, N. 1976, A&A, 53, 9
- Voûte (1955) Voûte, J. 1955, Journal des Observateurs, 38, 109
- Walker (1966) Walker, R. L. 1966, Publications of the U.S. Naval Observatory Second Series, 18, 1
- Walker (1969) Walker, Jr., R. L. 1969, Publications of the U.S. Naval Observatory Second Series, 22, 1
- Weber et al. (1971) Weber, S. V., Henry, R. C., & Carruthers, G. R. 1971, ApJ, 166, 543
- Wilson (1953) Wilson, R. E. 1953, Carnegie Institute Washington D.C. Publication, 0
- Worley (1957) Worley, C. E. 1957, AJ, 62, 153
- Worley (1963) Worley, C. E. 1963, AJ, 68, 114
- Worley (1972) Worley, C. E. 1972, Publications of the U.S. Naval Observatory Second Series, 22, 2
- Wright et al. (2003) Wright, C. O., Egan, M. P., Kraemer, K. E., & Price, S. D. 2003, AJ, 125, 359
- Zima (2008) Zima, W. 2008, CoAst, 155, 17
Appendix A Tables
Table 3 contains all the position measurements of HD 51756 (catalogued as BU 327, but widely known as WDS J06585-0301) found in the Washington Double Star Catalog. Error estimates – when available – can be found in the original references.
Table 4 lists the Fourier parameters of significant peaks in the periodogram.
| Date | N | Methoda𝑎aa𝑎aMethods of observations. A: Refractor, micrometer; B: Reflector, micrometer; T: Hipparcos or Tycho observation; S: Speckle interferometry. | Referenceb𝑏bb𝑏bFor special references - which are not in the SAO/NASA Astrophysics Data System - see the References and discoverer codes of The Washington Double Star Catalog at http://ad.usno.navy.mil/wds/Webtextfiles/wdsnewref.txt | ||
|---|---|---|---|---|---|
| 1875.06 | 90 | 1 | 1 | A | 1 |
| 1876.83 | 100.8 | 0.96 | 2 | A | D1883 |
| 1878.12 | 97.2 | n/a | 1 | A | 2 |
| 1881.05 | 96.1 | 0.75 | 1 | A | Bu1883 |
| 1888.10 | 95.8 | 0.73 | 2 | A | 3 |
| 1888.222 | 95.5 | 0.84 | 4 | B | 4 |
| 1892.08 | 95.8 | 0.79 | 3 | A | Bu1894 |
| 1894.40 | 98.1 | 0.64 | 5 | A | Sp1909 |
| 1899.01 | 93.6 | 0.59 | 1 | A | Bu1900 |
| 1902.544 | 93.9 | 0.68 | 6 | A | 5 |
| 1903.14 | 100.0 | 0.64 | 2 | A | 9 |
| 1906.16 | 95.9 | 0.87 | 3 | A | 6 |
| 1906.17 | 101.5 | 0.81 | 1 | A | Frm1907 |
| 1909.06 | 100.4 | 0.90 | 1 | A | 7 |
| 1909.06 | 101.3 | 0.88 | 1 | A | 7 |
| 1909.13 | 96.9 | 0.70 | 2 | A | Wz1912 |
| 1911.15 | 91.7 | 0.56 | 2 | A | 8 |
| 1920.09 | 98.1 | 0.77 | 1 | A | 10 |
| 1924.35 | 99.4 | 0.83 | 3 | A | 10 |
| 1924.79 | 97.5 | 0.94 | 1 | A | 10 |
| 1930.57 | 98.3 | 0.71 | 2 | A | Bon1938 |
| 1930.84 | 96.2 | 0.80 | 3 | A | 11 |
| 1935.43 | 102.0 | 0.78 | 4 | A | 12 |
| 1942.88 | 95.1 | 0.62 | 3 | A | 13 |
| 1945.31 | 103.6 | 0.68 | 2 | B | VBs1954 |
| 1947.17 | 102.8 | 0.76 | 2 | A | VBs1954 |
| 1953.22 | 98.5 | 0.81 | 6 | A | Rab1961b |
| 1956.11 | 98.2 | 0.74 | 2 | A | 14 |
| 1961.04 | 101.6 | 0.67 | 4 | A | 15 |
| 1965.034 | 100.1 | 0.69 | 4 | A | 16 |
| 1966.182 | 101.4 | 0.58 | 3 | A | 17 |
| 1968.045 | 101.4 | 0.66 | 3 | A | 18 |
| 1974.717 | 101.1 | 0.59 | 3 | A | 19c𝑐cc𝑐cThese observations were made after the closing of the referred article, but before the retirement of Alan Behall. Observing techniques, instrumentation and particulars are the same as described by Behall (1976) |
| 1975.522 | 101.6 | 0.55 | 3 | B | Wak1985 |
| 1991.25 | 102. | 0.71 | 1 | T | 20 |
| 1991.92 | 104.0 | 0.68 | 1 | T | 21 |
| 1994.129 | 101.2 | 0.67 | 1 | S | 22 |
| 1994.194 | 99.7 | 0.63 | 1 | S | 22 |
| 1994.194 | 100.5 | 0.68 | 1 | S | 22 |
| 1995.188 | 100.6 | 0.66 | 1 | S | 22 |
| 1995.199 | 103.0 | 0.68 | 1 | S | 22 |
| 1995.202 | 102.1 | 0.70 | 1 | S | 22 |
| 1995.202 | 101.8 | 0.67 | 1 | S | 22 |
| 1995.205 | 101.5 | 0.69 | 1 | S | 22 |
| 1995.207 | 101.9 | 0.63 | 1 | S | 22 |
| 1996.8960 | 101.5 | 0.695 | 1 | S | 23 |
| 1997.184 | 101.5 | 0.67 | 1 | S | 24 |
| 1997.184 | 102.2 | 0.69 | 1 | S | 24 |
(1) Burnham (1875); (2) Stone (1879); (3) Leavenworth & Beal (1930); (4) Tarrant (1890); (5) Doolittle (1905); (6) Olivier (1907); (7) Olivier et al. (1909); (8) Eddington et al. (1912); (9) Lewis et al. (1904); (10) Olivier (1928); (11) Olivier (1932); (12) Baize (1938); (13) Voûte (1955); (14) Worley (1957); (15) Worley (1963); (16) Walker (1966); (17) Walker (1969); (18) Worley (1972); (19) Behall (1976); (20) ESA (1997); (21) Fabricius et al. (2002); (22) Germain et al. (1999); (23) Horch et al. (2001); (24) Douglass et al. (1999).
| SNR | note | ||||||
|---|---|---|---|---|---|---|---|
| 0.009071 | 0.000035 | 167.4 | 1.1 | 0.2563 | 0.0073 | 10.4 | |
| 0.017911 | 0.000030 | 183.8 | 1.1 | -0.1304 | 0.0063 | 12.2 | |
| 0.033302 | 0.000042 | 137.5 | 1.1 | -0.0228 | 0.0087 | 8.5 | |
| 0.040540 | 0.000060 | 80.1 | 1.0 | 0.3908 | 0.0124 | 6.0 | |
| 0.062041 | 0.000057 | 89.8 | 1.0 | 0.2046 | 0.0118 | 6.4 | |
| 0.098717 | 0.000058 | 102.2 | 1.0 | -0.0143 | 0.0121 | 6.2 | |
| 0.119596 | 0.000080 | 58.2 | 0.9 | -0.0415 | 0.0165 | 4.5 | |
| 0.137555 | 0.000083 | 59.1 | 0.9 | 0.4332 | 0.0173 | 4.3 | |
| 0.253269 | 0.000075 | 60.2 | 0.9 | 0.3487 | 0.0156 | 4.7 | |
| 0.306826 | 0.000071 | 63.9 | 1.0 | -0.3190 | 0.0146 | 5.1 | |
| 0.472920 | 0.000071 | 65.3 | 1.0 | -0.2757 | 0.0147 | 5.0 | |
| 0.485587 | 0.000081 | 69.5 | 0.9 | -0.2933 | 0.0168 | 4.4 | |
| 0.496949 | 0.000088 | 47.8 | 0.9 | 0.1944 | 0.0182 | 4.1 | |
| 0.526865 | 0.000042 | 124.1 | 1.0 | -0.3897 | 0.0088 | 8.5 | |
| 0.537154 | 0.000075 | 61.5 | 0.9 | -0.0783 | 0.0155 | 4.8 | |
| 0.551246 | 0.000060 | 69.7 | 1.0 | 0.0598 | 0.0124 | 6.0 | |
| 1.061396 | 0.000058 | 94.0 | 1.0 | -0.3826 | 0.0120 | 6.2 | |
| 1.588351 | 0.000050 | 101.1 | 1.0 | 0.3509 | 0.0104 | 7.2 | |
| 2.122824 | 0.000081 | 58.3 | 0.9 | -0.3705 | 0.0167 | 4.4 | |
| 2.653912 | 0.000106 | 39.1 | 0.9 | -0.0592 | 0.0219 | 3.4 | |
| 3.181300 | 0.000098 | 42.5 | 0.9 | 0.2905 | 0.0203 | 3.8 | |
| 3.718828 | 0.000094 | 45.3 | 0.9 | -0.1821 | 0.0195 | 4.3 | |
| 4.243161 | 0.000110 | 37.2 | 0.8 | -0.1519 | 0.0229 | 4.1 | |
| 4.769149 | 0.000094 | 45.5 | 0.9 | 0.1209 | 0.0195 | 5.5 | |
| 5.297008 | 0.000119 | 31.9 | 0.8 | -0.1407 | 0.0248 | 4.6 | |
| 5.809200 | 0.000188 | 17.3 | 0.6 | 0.0690 | 0.0390 | 3.1 | |
| 6.354499 | 0.000185 | 16.4 | 0.6 | -0.3715 | 0.0384 | 3.2 | |
| 6.894291 | 0.000213 | 13.5 | 0.6 | 0.4758 | 0.0442 | 3.1 | |
| 7.421695 | 0.000163 | 19.8 | 0.7 | -0.2722 | 0.0338 | 4.2 | |
| 7.949167 | 0.000198 | 14.9 | 0.6 | -0.1871 | 0.0411 | 3.6 | |
| 9.009843 | 0.000178 | 17.3 | 0.6 | -0.4902 | 0.0369 | 4.6 | |
| 10.583197 | 0.000140 | 24.9 | 0.7 | -0.3271 | 0.0291 | 7.4 | |
| 13.969336 | 0.000292 | 9.0 | 0.5 | 0.1131 | 0.0606 | 4.0 | a𝑎aa𝑎aPeak corresponding to the orbital period of the CoRoT satellite. |