A Candidate for the Most Luminous OB Association in the Galaxy
Abstract
The Milky Way harbors giant H II regions which may be powered by star complexes more luminous than any Galactic OB association known. Being across the disk of the Galaxy, however, these brightest associations are severely extinguished and confused. We present a search for one such association toward the most luminous H II region in the recent catalog by Murray and Rahman, which, at 9.7 kpc, has recombination rate of sec-1. Prior searches have identified only small scale clustering around the rim of this shell-like region, but the primary association has not previously been identified. We apply a near-infrared color selection and find an overdensity of point sources toward its southern central part. The colors and magnitudes of these excess sources are consistent with O- and early B-type stars at extinctions , and they are sufficiently numerous ( after subtraction of field sources) to ionize the surrounding H II region, making this a candidate for the most luminous OB association in the Galaxy. We reject an alternate theory, in which the apparent excess is caused by localized extinction, as inconsistent with source demographics.
1 Introduction
Very massive OB associations are objects of intense interest. Given that the association birthrate () is observed to vary with association mass () as (McKee & Williams, 1997), or possibly slightly flatter, a large portion of each galaxy’s star formation occurs within its most massive OB associations. Giant OB associations are most capable of disrupting their gaseous environment, from their natal molecular clouds to the entire galactic neighborhood, and they inflate superbubbles which erupt from the disk, feeding a galactic halo or fountain. They sculpt and illuminate the giant H II regions seen in distant galaxies and are a notable feature of starburst evolution. Being the most extreme examples of intense star formation in the current universe, they are laboratories for the physics of star cluster formation such as environmental influences on the initial mass function, formation of very massive stars, and dynamical evolution with rapid stellar evolution.
Although several of the brightest known OB associations within the Milky Way approach ‘super star cluster’ status (, Portegies Zwart et al., 2010), it is possible that even more luminous associations have escaped detection because of severe extinction and confusion in the Galactic plane. For instance, the Galactic OB associations with the largest known ionizing output, , are those powering the NGC 3603 H II, Arches, Quintuplet, and Galactic Center regions (s and , respectively: Figer 2008; Conti & Crowther 2004); however, the upper limit of the Milky Way association distribution is estimated to be even brighter (s; McKee & Williams, 1997).
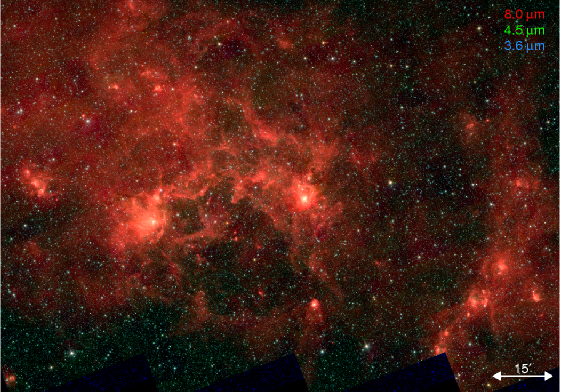
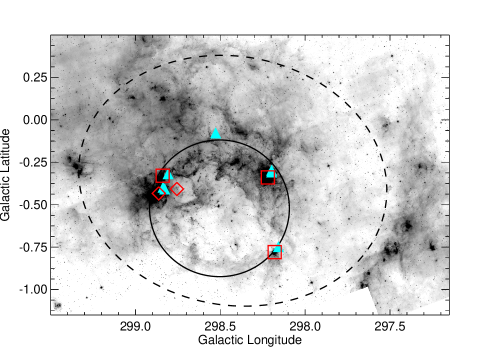
Recently, Rahman & Murray (2010) identified 40 star-forming complexes within the 13 most luminous ( s-1) free-free emission regions observed by WMAP and catalogued by Murray & Rahman (2010). Many of these complexes are potential hosts to embedded super star clusters. Of particular interest is the most luminous unconfused star-forming complex located at (, ) = (, ) with a kinematic distance of 9.7 kpc. With an output of s, the stars powering this region may represent the Milky Way’s most luminous OB association. (We refer to this region and its cluster as G298 or, inspired by its 8 m appearance, as the ‘Dragonfish Nebula’: Figure 1.) The region appears in 8 m as a closed bubble surrounded by a prominent shell. Previous searches using near-infrared (NIR) point source catalogs from 2MASS (Dutra et al., 2003) and Spitzer GLIMPSE (Mercer et al., 2005) have concentrated on the brightest regions of free-free emission around the shell and relied on integrated source counts. Although some clustering was discovered in these studies (Figure 2), the central ionizing association is yet undiscovered.
In this Letter, we identify a candidate for the central OB association powering the Dragonfish, primarily by applying a color selection to the 2MASS catalogue. Our candidate is potentially the most luminous (and thus massive) OB association in the present Milky Way.
2 Feasibility and Methods
Only very luminous stars of deeply embedded OB associations are visible due to distance and extinction. Whether the association can be identified using the 2MASS point source catalogue (Skrutskie et al., 2006) depends on the OB association radius and field star density.
Radii in the range 10–30 pc are likely since most associations, irrespective of mass, are disrupted immediately after birth (Roberts, 1957). OB association birthsites in the Milky Way have a limited range of mass column densities, g cm (Fall et al., 2010). Turbulent linewidths in these birthsites are g cm km s-1, for associations of mass which form with efficiency from a region with turbulent virial parameter . Crossing and formation timescales are both shorter than the ionizing lifetime and the terminal expansion speed of an OB association is likely to be . For an association of , an age between 2–4 Myr, and an expansion speed between 4–6 km s-1, we therefore expect an expanding population currently 8–24 pc in radius, possibly surrounding a dense core which survived the disruption event. For a physical radius pc with the ionizing luminosity of the Dragonfish as measured from WMAP, the association source density is arcmin-2. We measure the 2MASS source population density in the Galactic plane to be arcmin-2. For pc the association dominates raw 2MASS source counts, whereas for pc it is a minor variation of the 2MASS population which is difficult to detect using raw source counts.
The NIR color information provides an additional avenue to search for the embedded associations. We make use of this in the search for the embedded association within the Dragonfish. Ionization from a coeval stellar population drops sharply after 4 Myr as its most massive and powerful stars turn off the main sequence, so it is unlikely, though not impossible, that G298’s ionizing population is any older. The ionizing population is sufficiently rich ( s-1: Kennicutt et al., 1989) to fully sample the stellar initial mass function (IMF); its very massive stars should still be present and visible.
The association is likely highly extinguished, even if it has cleared its natal cloud. At a distance of 9.7 kpc the fiducial distance-extinction relationship within the Galactic disk, (Binney & Merrifield, 1998), predicts ; this corresponds to a -band extinction (Nishiyama et al., 2008). We adopt the Nishiyama et al. (2009) extinction law, which is steeper than that of Cardelli et al. (1989). We rely primarily on the 2MASS point source catalog for our analysis, but use three additional data sets to check for consistency: the USNO-B catalog of visible magnitudes, the Spitzer GLIMPSE catalog at 3.6 and 4.5 m, and deeper J and H band photometry of a small section of the candidate.
For our search, we target main-sequence, massive stars, at a distance of kpc and an extinction of around . Further, association members visible in all three bands have spectral types of roughly B1 or earlier, so their intrinsic emission in the NIR bands (m) is entirely in the Rayleigh-Jeans limit (; Martins & Plez, 2006). With the predicted extinction, NIR colors should be . Association sources should lie in a tight group along the reddening vector from this common initial color. If the upper IMF follows the Salpeter (1955) slope to an upper limit of 120 , we expect members with confident NIR colors (, for which the signal-to-noise ratio exceeds five in all bands). Note that if the association is older than 4 Myr or is not coeval, it must be even more numerous because more stars are required to make up for the missing ionization from the top of the main sequence.
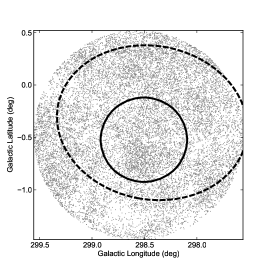
The first steps of our analysis are to select sources with the color of an early-type star behind a range of extinctions bracketing the expected value, to test for a statistically significant overdensity within the confines of the 8 m bubble, and then to vary the adopted extinction range in order to optimize the statistical significance of the overdensity. In practice we determine source density using the angular offset between a source and its th neighbour, as , and use to reduce Poisson noise at some expense in resolution. Once the angular scale of the putative association is determined, we assess its significance by comparing source density within this region to the mean and standard deviation of those within independent, identically-sized regions in a 2-degree field centered on, but excluding, the 8 m bubble. Statistical significance is measured by .
Once a candidate is identified, we check that the same procedure applied to regions outside the 8 m bubble yields no candidates of similar significance. We then examine the color-color and color-magnitude diagrams (CCDs and CMDs) of similarly-sized regions to check that an apparent overdensity is not caused by features of the distribution of stars and extinction.
3 Results
3.1 Candidate OB Association
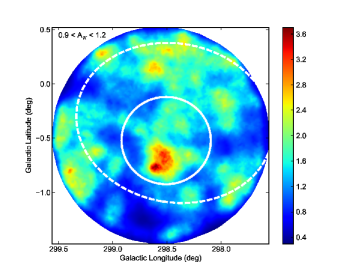
Based on the expected source colors from § 2, we apply a NIR color cut of and , corresponding to colors of hot stars with . Within the color cut, the 2-degree diameter field encompassing the Dragonfish has a mean stellar density arcmin-2, which we refer to as the field star density. The standard deviation of averaged over association-sized regions is arcmin-2. We find a significant overdensity of stars in the Dragonfish Nebula at (, ) = (, ), located inside the shell of the star forming complex (Figure 2). The 1– stellar overdensity contour () has semimajor and semiminor axes (11′, 10′), corresponding to (31, 28)pc; however, the association may extend beyond the observational limit. The peak of the overdensity is arcmin-2, 8- above the background level on cluster-sized regions, adopting the 100th nearest neighbor. The region contains 897 sources within the adopted boundaries. Subtracting the contribution due to background sources, the candidate association is composed of sources, consistent with the value determined based on the chosen IMF and measured luminosity (§ 2). Using the 1– boundaries, the mean density of the association is . We refer to the candidate as the “Dragonfish Association”.
The association is strongly concentrated within the central , but contains an extended asymmetric envelope. The central, dense, symmetrical region has a stellar density which depends as with for , where the value of depends on the assumed density of field sources. At larger radii the azimuthally averaged density drops more rapidly, but is dominated by the asymmetries visible in Figure 1. Half the excess sources are found within , or pc, similar to the half-light radii of other Galactic OB associations (Portegies Zwart et al., 2010).
Assuming half the projected mass falls within this radius, and assigning a total mass of we infer that the association’s central regions are older than their virial crossing times, whereas its outskirts are not ( Myr). It therefore seems likely to be unbound on the whole (Gieles & Portegies Zwart, 2011) but to contain a bound core; however this bears further investigation.
Using the USNO and Spitzer GLIMPSE catalogues, we are able to confirm that the stars identified in the Dragonfish Association have magnitudes and colors consistent with OB stars with the stated extinction, but not further able to distinguish the association population from the background. In the GLIMPSE wavelengths (), this is because nearly all stars have identical, Rayleigh-Jeans colors, whereas with the USNO wavelengths (), the spectral energy distribution is strongly dominated by the extinction. Thus template colors of most stellar types can be fit to the additional photometry by varying the assumed distance or extinction of the star.
3.2 Color-Color and Color-Magnitude Diagrams
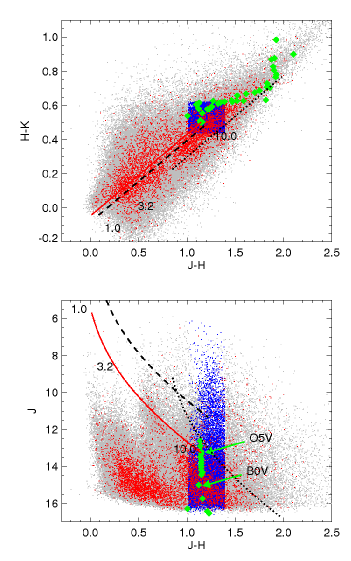
The NIR color information provides an additional avenue to determine important parameters of the candidate association, including the statistical significance of the overdensity, the possible background contributors, and the color variation of all point sources within the association boundaries. Figure 3 presents the CCD and CMD of the point sources within the 2 degree field centered on the Dragonfish Nebula, showing the distribution of all 2MASS point sources, as well as the relative location of the color cut. We indicate in red the point sources that fall within the association boundaries. We indicate in blue all stars within the field that meet the association’s color cut. The position of the main sequence is indicated at a distance of 9.7 kpc and extinguished by . The reference magnitudes for the O spectral type are taken from Martins & Plez (2006), and for the remaining spectral types from Pickles (1998). The path taken by an O5V star if placed at varying distances, assuming the average extinction to distance ratio, is indicated by the red line. The path taken by any given reference star is just a translation of this path on the diagram. The color cut is sufficiently large to permit spectral classes of A and earlier at the given reddening. However, the sensitivity of 2MASS limits stars at this distance and extinction to be no later than B1V.
In Figure 4 we bin the CCD and CMD to investigate the overabundance in the region within the Dragonfish Association as compared to the surrounding regions. These figures indicate the location and prominance of the cluster overdensity as a function of both color and magnitude. For the CCD, we bin the sources in a bin grid spanning and . For the CMD, we similarly use a bin grid with , and identical limits. We grid the point sources that fall within the association boundaries and subtract the average bin value from the surrounding field. In both the CCD and CMD, an overabundance of point sources appears in the range . We note an underdensity in the CCD at . The total number of sources “missing” in the underdensity is approximately . The underdensity is associated with a galactic structure feature in the surrounding field which we discuss in depth in a forthcoming paper.
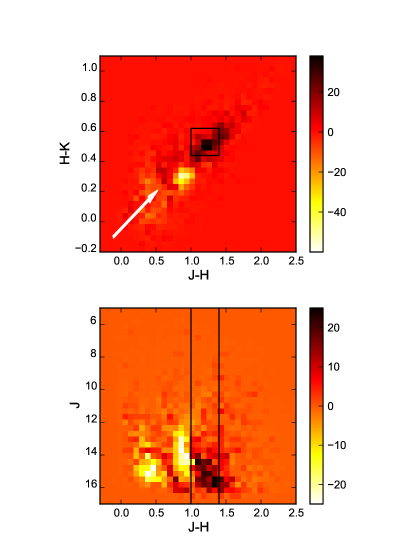
Given that the colors of these underdense sources are separated from those of the putative OB association by a vector which is nearly parallel to the extinction vector, could the association be only an illusion caused by intervening extinction with ? If so we would expect an overall deficit of stars in this direction (due to the extinction of dim sources), but there is no such trend. In fact the missing sources are about half as numerous as the surplus ones. Corroborating this point, we note that the vector separating the two populations is slightly steeper than the Nishiyama et al. (2008) extinction law (whereas the overpopulation is perfectly consistent with OB stars reddened by that law). Moreover, sources which appear underdense on this plot vary on larger angular scales than that of the association; their population is mostly a function of galactic latitude, although there are somewhat fewer of them toward the association. We therefore conclude that the association does in fact exist, but there may also exist localized extinction which affects the color distribution of sources.
To further investigate the role of patchy extinction, we have obtained additional and band photometry towards a central 3.9′ field in the candidate association using the Wide Field IR Camera on the 2.5-metre du Pont Telescope, with limiting magnitudes of , and at a SNR of 3 (J. Radigan, private communication, 2010). We extract 906 stars in this field. With this additional photometry, we find stars in the range of , with a continuous density of stars throughout this color range. We also find no evidence for any shadowing features which would indicate a strong extinction feature. This supports our conclusion that the apparent association is not an extinction feature.
4 Confusing sources
In order to identify possible contaminating stars within the color cut, we model the NIR colors and magnitudes of template stars of different spectral types and luminosity classes. We vary the distances of the model stars to examine which stars meet the cut above the 2MASS limiting magnitudes. We use reference magnitudes, extinction relationship and the average extinction-to-distance ratio as in §3.2. All main sequence OB stars down to B1V can fall within the color and magnitude limits. With the 2MASS limiting magnitudes, assuming the extinction-to-distance ratio, all subtypes of O stars are visible to 13 kpc. All main sequence stellar types later than B1V fall below the magnitude limits. OB giants (down to B9III) and K1III to M0III giants can fall within the color and magnitude limits. All supergiant stars can fall within the association color cut and magnitude limits. We show examples of stars that may fall within the color and magnitude limits in Figure 3. The red-clump giant feature, composed of early K giant stars (López-Corredoira et al., 2002; Indebetouw et al., 2005) partially overlaps the association color cut towards the faint end, but is not the primary contributor to the background population.
Using the Robin et al. (2004) model of the stellar population we produce a synthetic catalogue of stars. We simulate the field in the direction and with the size of the Dragonfish Association, using the 2MASS limiting magnitudes from §2, and a diffuse extinction law of 1.6 . The model background population underestimates the total number of sources. However, we find that the majority of stars within the color cut are early K giant stars with masses between 1 and 3 M☉ and distances between 3.0 and 4.5 kpc; we assume these represent our contaminating sources.
5 Conclusions
We have used the 2MASS point source catalogue to search for the central OB association within the Dragonfish Nebula by analyzing the on-sky stellar density with NIR colors consistent with extinguished O stars. We find an overdensity of point sources within the bubble at an extinction range of . Comparing the CCD and CMD of the candidate association with the surrounding field, we confirm the presence of the overdensity at the chosen color range. We reject an extinction explanation for the overdensity and infer that the contaminating star population consists predominantly of K giants 3-4.5 kpc away. Our candidate association contains members visible in 2MASS with magnitudes consistent with O and early-B stars, similar to the ionizing population expected from the region’s free-free luminosity. We infer from its assumed mass, radius, and maximum age that it is likely to be unbound on the whole but may contain a bound core; however further investigation is necessary to determine its dynamical state. This is a candidate for the most luminous (and consequently the most massive) OB Association in the Galaxy. If confirmed by upcoming spectroscopic observations, the Dragonfish Association is an outstanding candidate for multiwavelength examination, as it is a promising laboratory massive star formation, stellar dynamics, and feedback processes within the Galactic environment.
References
- Benjamin et al. (2003) Benjamin, R. A., et al. 2003, PASP, 115, 953
- Binney & Merrifield (1998) Binney, J., & Merrifield, M. 1998, Galactic astronomy, ed. Binney, J. & Merrifield, M.
- Cardelli et al. (1989) Cardelli, J. A., Clayton, G. C., & Mathis, J. S. 1989, ApJ, 345, 245
- Conti & Crowther (2004) Conti, P. S., & Crowther, P. A. 2004, MNRAS, 355, 899
- Dutra et al. (2003) Dutra, C. M., Bica, E., Soares, J., & Barbuy, B. 2003, A&A, 400, 533
- Fall et al. (2010) Fall, S. M., Krumholz, M. R., & Matzner, C. D. 2010, ApJ, 710, L142
- Figer (2008) Figer, D. F. 2008, in IAU Symposium, Vol. 250, IAU Symposium, ed. F. Bresolin, P. A. Crowther, & J. Puls, 247–256
- Gieles & Portegies Zwart (2011) Gieles, M., & Portegies Zwart, S. F. 2011, MNRAS, 410, L6
- Indebetouw et al. (2005) Indebetouw, R., et al. 2005, ApJ, 619, 931
- Kennicutt et al. (1989) Kennicutt, Jr., R. C., Edgar, B. K., & Hodge, P. W. 1989, ApJ, 337, 761
- López-Corredoira et al. (2002) López-Corredoira, M., Cabrera-Lavers, A., Garzón, F., & Hammersley, P. L. 2002, A&A, 394, 883
- Martins & Plez (2006) Martins, F., & Plez, B. 2006, A&A, 457, 637
- McKee & Williams (1997) McKee, C. F., & Williams, J. P. 1997, ApJ, 476, 144
- Mercer et al. (2005) Mercer, E. P., et al. 2005, ApJ, 635, 560
- Murray & Rahman (2010) Murray, N., & Rahman, M. 2010, ApJ, 709, 424
- Nishiyama et al. (2008) Nishiyama, S., Nagata, T., Tamura, M., Kandori, R., Hatano, H., Sato, S., & Sugitani, K. 2008, ApJ, 680, 1174
- Nishiyama et al. (2009) Nishiyama, S., Tamura, M., Hatano, H., Kato, D., Tanabé, T., Sugitani, K., & Nagata, T. 2009, ApJ, 696, 1407
- Pickles (1998) Pickles, A. J. 1998, PASP, 110, 863
- Portegies Zwart et al. (2010) Portegies Zwart, S. F., McMillan, S. L. W., & Gieles, M. 2010, ARA&A, 48, 431
- Rahman & Murray (2010) Rahman, M., & Murray, N. 2010, ApJ, 719, 1104
- Roberts (1957) Roberts, M. S. 1957, PASP, 69, 59
- Robin et al. (2004) Robin, A. C., Reylé, C., Derrière, S., & Picaud, S. 2004, A&A, 416, 157
- Salpeter (1955) Salpeter, E. E. 1955, ApJ, 121, 161
- Skrutskie et al. (2006) Skrutskie, M. F., et al. 2006, AJ, 131, 1163