Direct observation of room temperature high-energy resonant excitonic effects in graphene
Abstract
Using a combination of ultraviolet-vacuum ultraviolet reflectivity and spectroscopic ellipsometry, we observe a resonant exciton at an unusually high energy of 6.3eV in epitaxial graphene. Surprisingly, the resonant exciton occurs at room temperature and for a very large number of graphene layers 75, thus suggesting a poor screening in graphene. The optical conductivity () of resonant exciton scales linearly with number of graphene layer (up to at least 8 layers) implying quantum character of electrons in graphene. Furthermore, a prominent excitation at 5.4eV, which is a mixture of interband transitions from to at the M point and a plasmonic excitation, is observed. In contrast, for graphite the resonant exciton is not observable but strong interband transitions are seen instead. Supported by theoretical calculations, for 28 the is dominated by the resonant exciton, while for 28 it is a mixture between exitonic and interband transitions. The latter is characteristic for graphite, indicating a crossover in the electronic structure. Our study shows that important elementary excitations in graphene occur at high binding energies and elucidate the differences in the way electrons interact in graphene and graphite.
Graphene, a one layer thick carbon honeycomb structure, has recently attracted a lot of attention due its exotic quantum propertiesreviews . In addition to the well-known electronic properties, such as ballistic electron transportreviews ; NovScience01 ; NovNature01 , quantum Hall effectZhangNature01 , tunable band gapohtaScience ; zhangNature02 , and physics driven by many-body interactionsBostwickNatPhys , graphene also displays very interesting optical properties. For instance, due to its low-energy excitation graphene becomes highly transparent in the visible spectral range and its infrared optical conductivity can be tuned using a gate voltageLiNatPhys . These particular properties of graphene potentially result in exciting optoelectronic applications.
Recent theoretical studies based on the ab-initio GW and Bethe-Salpeter equation (BSE) approach by Yang et al.YangPRL and Trevisanutto et al.TrevisPRB have predicted the existence and have highlighted the importance of resonant excitonic effects in the optical absorption of graphene. However, there is disagreement as to the origin and position of the exciton. In Ref. YangPRL the calculations were done up to 7 eV and the resonant exciton predicted to occur at 4.6 eV due to electron-hole interaction in - and -band at the M point. While in Ref. TrevisPRB the calculations were done at a much higher energy of 22 eV and the resonant exciton predicted to appear at 8.3 eV due the background single particle continuum of dipole forbidden transition at the the point. Despite their disagreement, both have agreed that resonant exciton plays important role for elementary excitations in graphene and thus its understanding is crucial.
A direct way to probe resonant exciton in graphene is to measure its complex dielectric response in wide energy rangeTrevisPRB . Despite reports on the optical properties of graphene over the visible energy rangeBostwickNatPhys ; NairScience ; KuzmenkoPRL01 ; MakPRL01 ; LatilPRL ; OhtaPRL ; KravetsPRB there has been no reliable optical conductivity data at higher energies. Therefore, it is crucial to study the optical properties of graphene in an unprecedented high energy range not only to provide a direct evidence of the resonant excitonic effects per se, but also for our understanding of electronic structure of graphene.
Herewith, we report the optical conductivity () of epitaxial graphene on 6H-SiC(0001)/buffer layer substrate in an unprecedented wide photon energy range from 0.5 to 35 eV using a combination of spectroscopic ellipsometry and UV-VUV reflectrometry RusydiPRB01 . It has been recently shown that the combination of these two techniques enables a stabilized Kramers-Kronig transformationRusydiPRB01 which is crucial to resolve precisely the dielectric function. We study the evolution of as a function of the number of layers N (henceforth ) including graphite.
Epitaxial graphene samples on 6H-SiC(0001) were prepared by Si desorption process in Si-flux as described in previous studiesWeiSS ; HanACS . This process was found to lead to multilayer graphene with ordered stackingHanACS . The thickness was determined using scanning tunneling microscopy and Raman spectroscopyHanACS ; ShivaJEM . For reference, we have used a cleaved highly ordered pyrolytic graphite. The reproducibility was checked by fabricating and repeating individual measurements on three different samples that were grown under identical conditions at least 3 different locations on each sample yielding reproducible results. The details of the samples are described in the supplementary section.
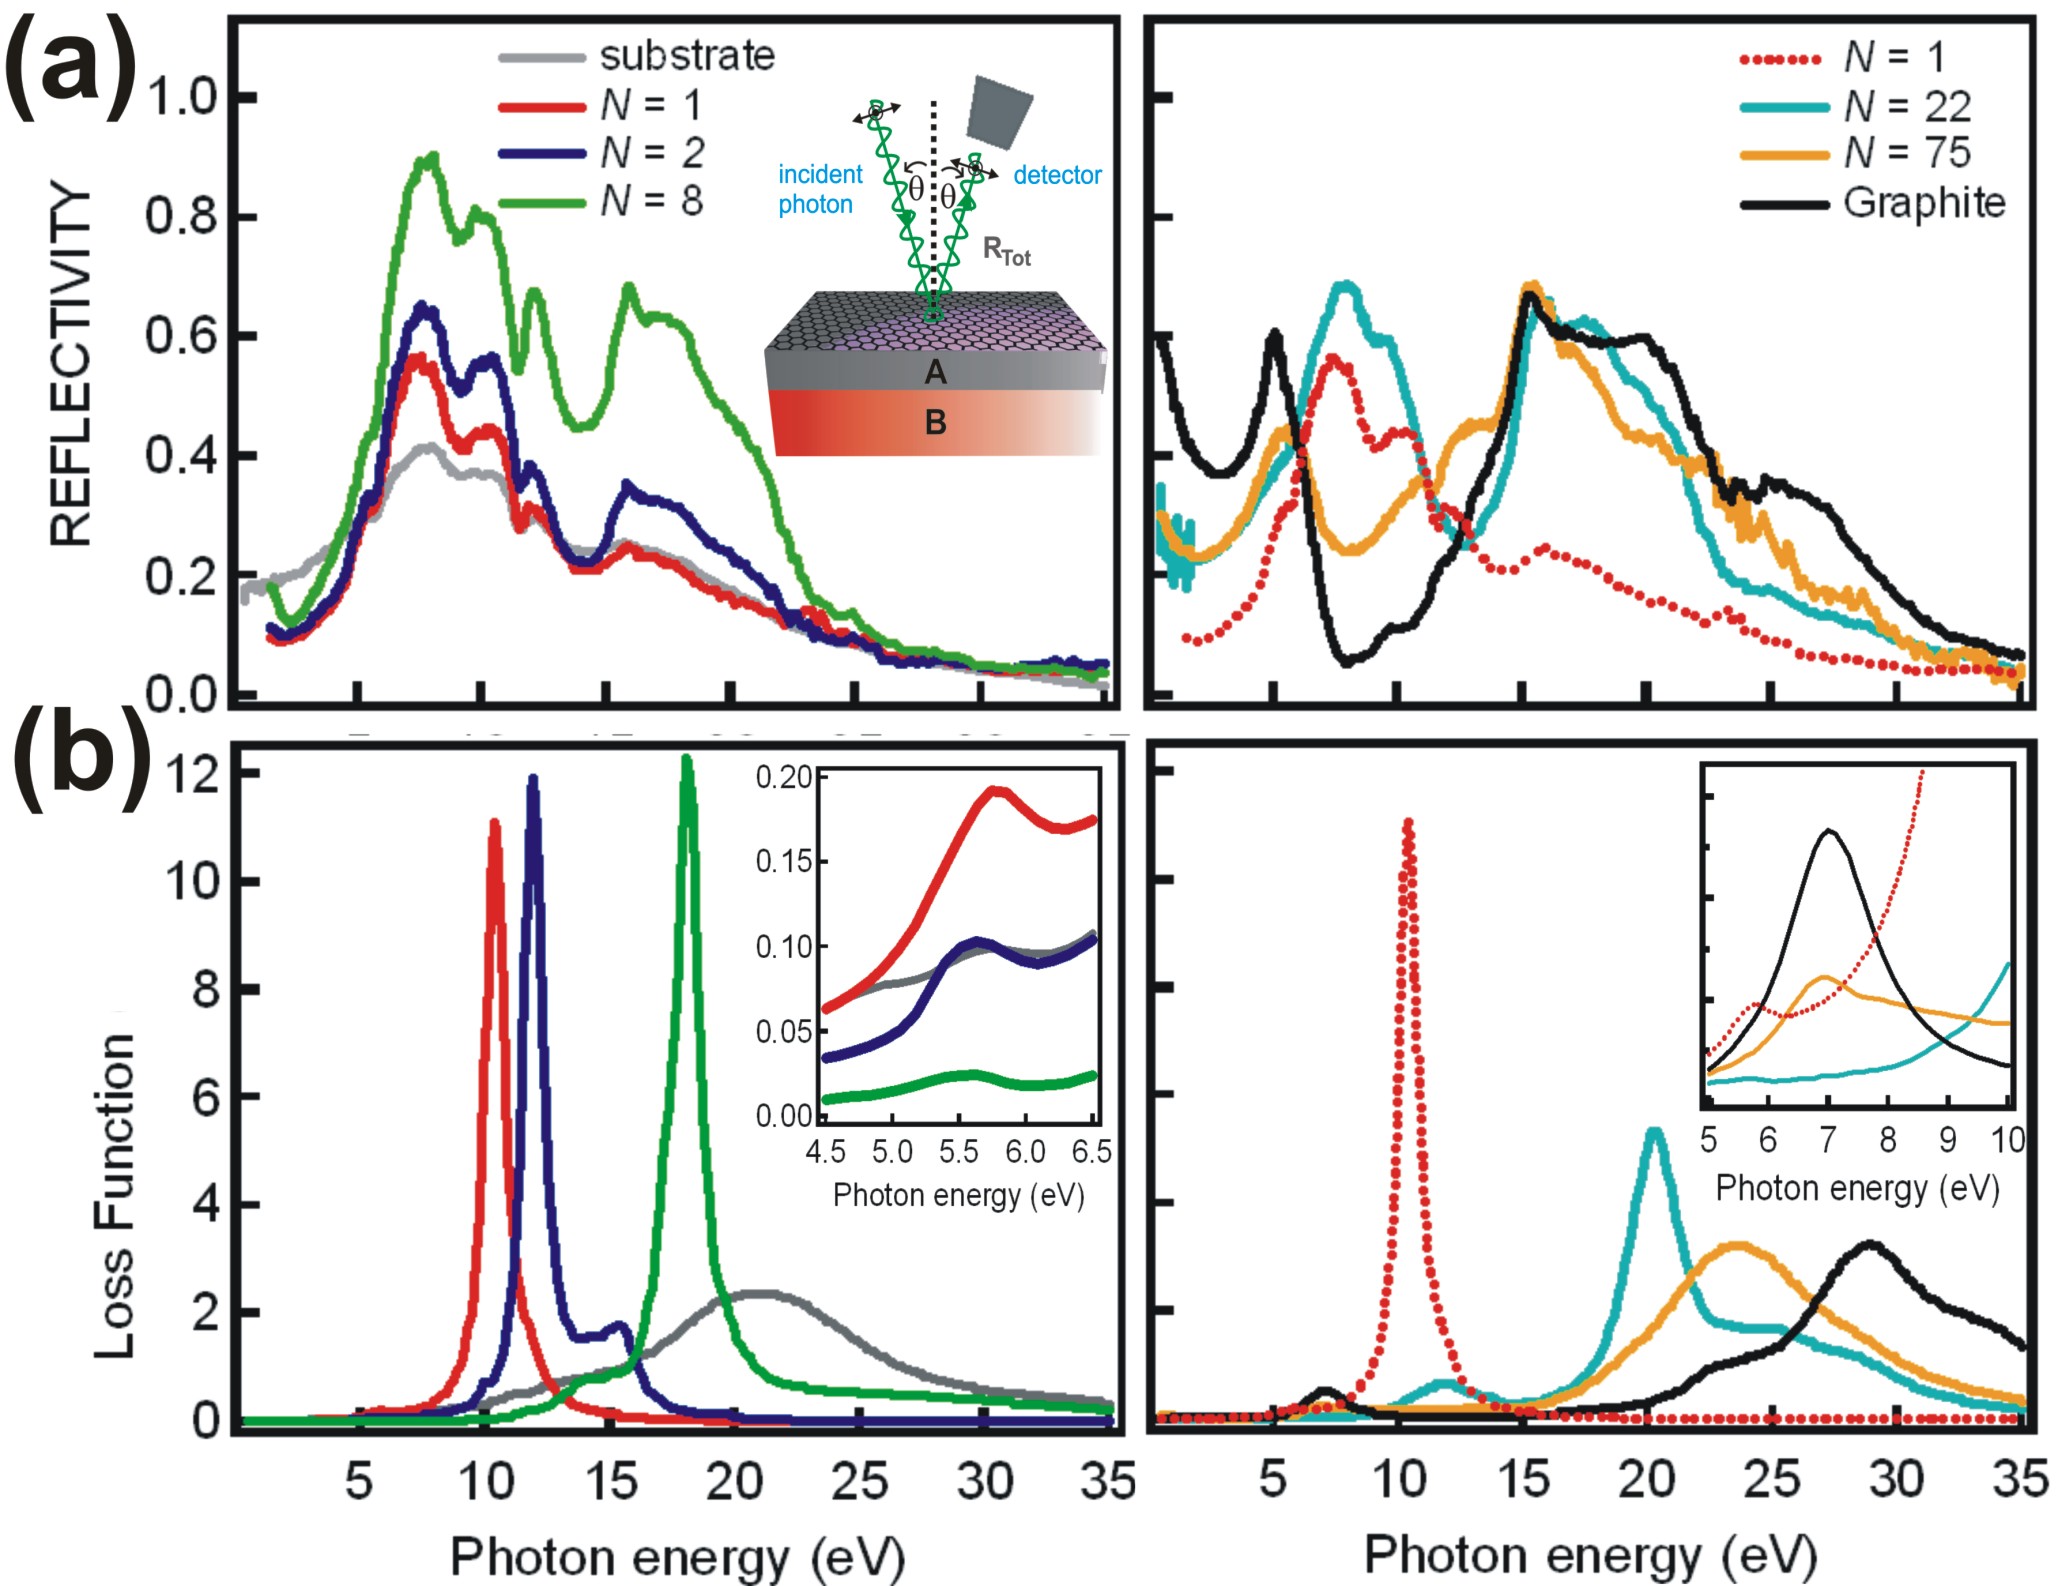
Figure 1(a) shows room temperature reflectivity data for N-dependent epitaxial graphene, graphite as well as the substrate. Interestingly, one can see that the reflectivity of epitaxial graphene is very much dependent on N and very much distinguished from that of graphite. The reflectivity has rich and distinct structures especially in the range from 5 to 8 eV for N = 1, 2, and 8 while additional structures occur around 14 to 20 eV for N = 22, and 75. On the other hand, the reflectivity of graphite has shown strong structures below 0.5 eV, eV, and around 14 to 20 eV which are similar to published resultTaftPR . Further rigorous discussion will be achieved by analysing the . (Details of analysis of reflectivity, complex dielectric function and optical conductivity are shown in the Supplementary.)
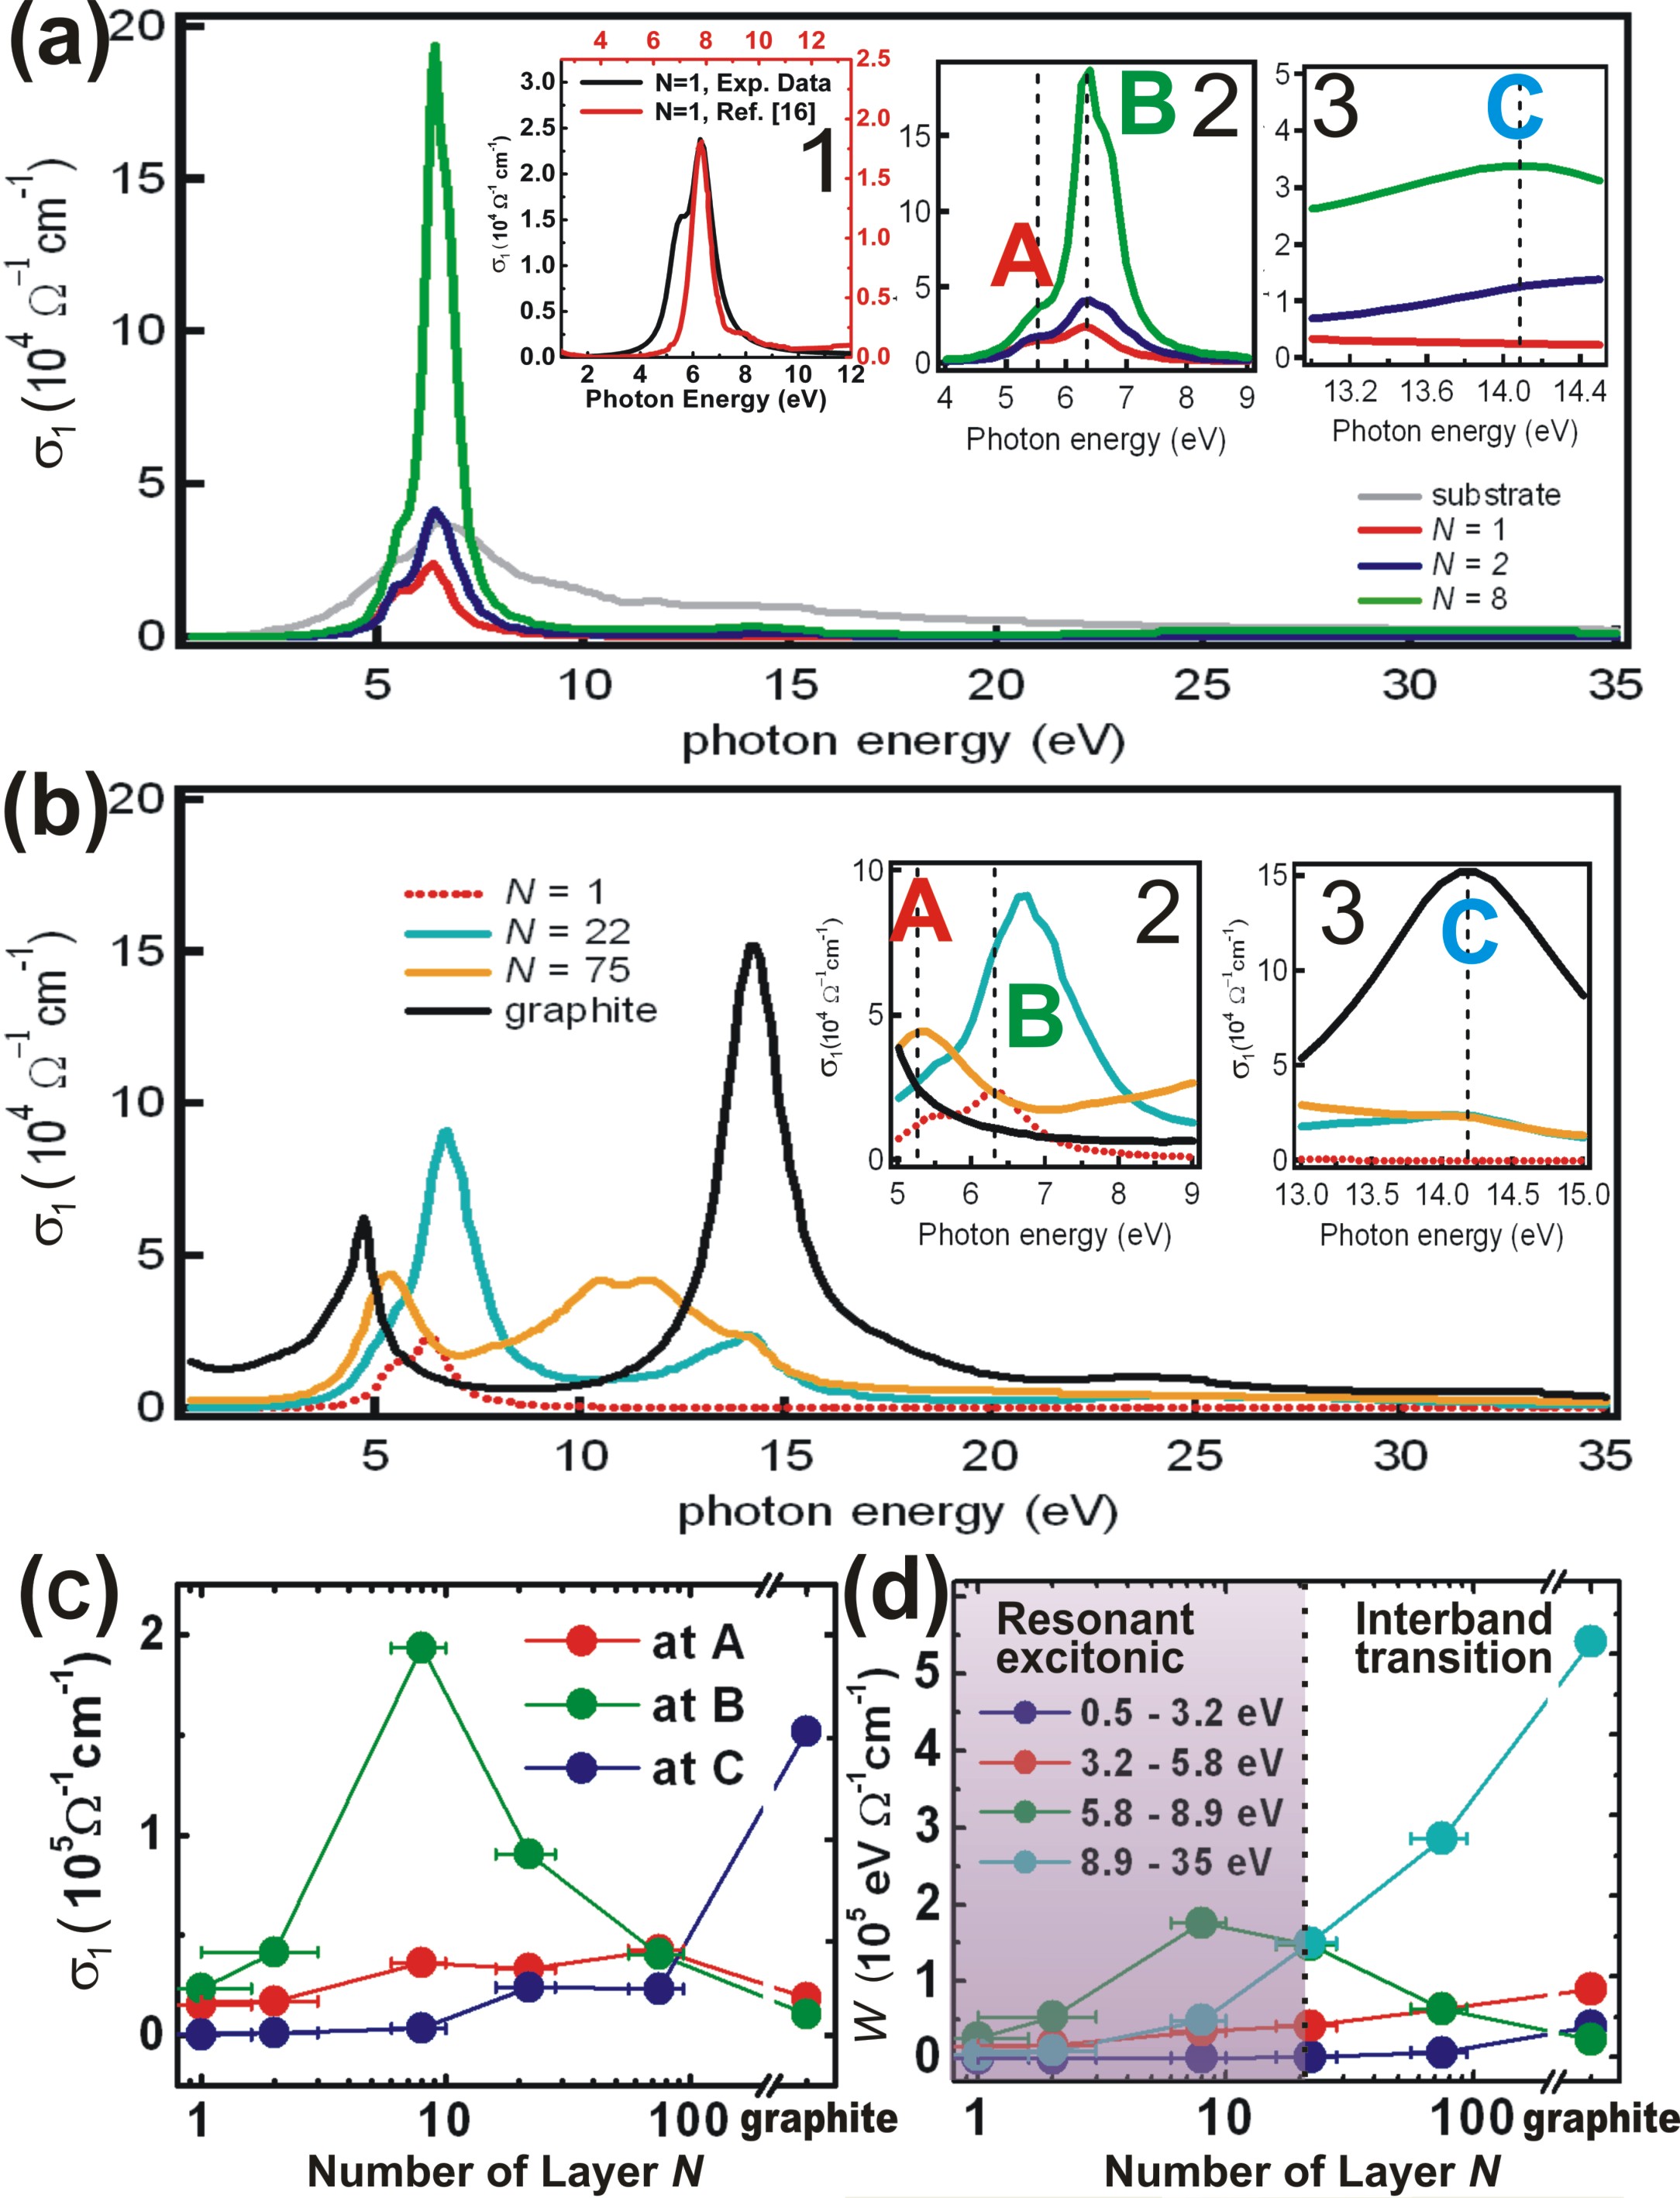
The shows striking results (Figs. 2 (a) and (b)). For , the is dominated by two well-defined peaks, very pronounced at 6.3 eV (peak B) and less pronounced at 5.4 eV (peak A), with almost equal full-width at half maximum (FWHM) of 0.8 eV. These structures, especially the peak B, are considerably sharp for this high energy range.
Now, we shall focus our discussion on peak B as it shows an interesting dependence on (Fig. 2(c)). The increases rapidly towards =8, while its FWHM and peak position remain independent of . For , (B) decreases while the peak position shifts towards higher energy (6.7 eV and 11 eV for N = 22 and N = 75, respectively). For graphite, peak B disappears and our result is similar to the published dataTaftPR .
To find out the origin of peak B, we have directly compared our experimental data with theoretical calculationsYangPRL ; TrevisPRB . As shown in inset 1 of Fig. 2(a), the line shape and the (B) between experimental data and theoretical calculations from Ref. TrevisPRB are surprisingly very similar. This comparison shows a decisive evidence of the high energy resonant exciton in epitaxial graphene. The resonant exciton arises from dipole transitions of the single-particle continuum. However, the observed resonant exciton peak occurs red shifted compared to the calculations. Our calculations show that the red shifted exciton could result from film-substrate interactions, which are not included in the previous calculations (see below for the details). Thus, the origin of peak B is the high energy resonant exciton as predicted.
Furthermore, our detail study rules out the interband transitions and plasmonic excitations as origin of peak B. Based on Density Functional Theory (DFT), we have calculated optical conductivity for = 1 and 2, and found that the peak B does not originate from interband transitions (see Fig. 3a and discussion below). Secondly, one may argue that we have to consider contributions from a plasmonic excitation. To address this issue, we have studied in detail an energy loss function Im which can reveal collective excitations such as plasmonic excitationsMarinPRL01 ; EberPRB . As shown in Fig. 1(b), there is no feature that can be attributed to a plasmonic excitation. For = 1, Im is dominated by a strong structure at 10 eV and a weak structure at 5.5 eV. These structures are from and in-plane plasmon modes, respectivelyEberPRB . Based on the symmetry, the 5.5 eV plasmon peak structure is only visible for light polarization parallel to c-axis (E). In our measurement, the E was mixed between E and E with main contribution from E, thus the observed plasmon is very weak. On the other hand, plasmon mode is very strong in our geometry which is consistent with EELS measurementsEberPRB ; JiongPRB . As N increases, the plasmon mode shifts toward higher energy and gets broader, while the structure at 5.5 eV is nearly N-dependent. This blueshift may be due to strong effects of the interlayer Coulomb interaction on the total plasmonMarinPRL01 .
The exciton energy of 6.3 eV suggests an untypically high binding energy which can also be made responsible for the presence of the exciton up to room temperature. If one considers the angular-resolved photoemission data, the distance of band at point to Fermi level is around 4.5 eVEmtsevPRB . By assuming the distance of band to Fermi level to be similar to that of band one will end up with 9 eV as the separation between and bands. Based on these values the binding energy of the resonant exciton is 2.7 eV which is 108 times larger than the thermal energy. This binding energy is significantly larger as compared to that of ZnO which is around 60 meV ( 2.4 times thermal energy)Thomas60 and is very clearly seen at room temperature while the binding energy of the excition for GaAs is about 3.4 meV and can only be seen at low temperaturesHegarty85 . Such a very high binding energy exciton observed on graphene is indeed remarkable and a direct consequence of its low dimensionality in conjunction with its intriguing electronic properties.
We next discuss peak A and its origin. As shown in Fig. 2(c), increases monotonically as a function of . Interestingly, for as well as for graphite the position of peak A shifts towards lower energies as opposed to peak B, while the line shape is rather symmetric and the FWHM is broader for larger . Based on electronic band structure calculationsLatilPRL , peak A is the result of interband transitions from the to bands at M-point where the van Hove singularity occurs. Furthermore, from analysis of energy loss function (Fig. 1(b)) the Im shows a weak -plasmon contribution. Thus one can conclude that the peak A is a mixture between interband transitions and a plasmonic excitation.
Another notable observation is a broad structure at 14.1 eV (peak C). The peak C is absent for and (C) increases dramatically for (Fig. 2(c)). Interestingly, for graphite the is dominated by peak C with symmetric lineshape. Based on electronic band structure calculationsTrevisPRB ; LatilPRL ; AhujaPRB this structure is interband transitions from to bands at point. Peak C clearly has an intimate relationship with optical conductivity in graphite while peak B is a unique characteristic of graphene.
We next discussed partial spectral weight integral () because it describes the effective number of electrons excited by photons of respective energy. The is restricted by the f-sum rule: , where is the electron density, is elementary charge and is effective electron mass. Hence, one can extract the , for various energy ranges. Due to the f-sum rule and charge conservation, the is constant, and thus one can study the spectral weight transfer and reveal interactions as well as the effect of in the broad energy range of 0.5 to 35 eV. Figure 2(d) shows for the different energy regions: 0.5 to 3.2 eV (region I, ), 3.2 to 5.8 eV (region II, ), 5.8 to 8.9 eV (region III, ), and 8.9 to 35.0 eV (region IV, ).
The is mainly governed by the transition around Dirac cone, i.e., to around point in Brillouin zone which is consistent with previous publicationsBostwickNatPhys ; MakPRL01 . While the , , and show the main contribution from the peak A, B, and C, respectively. Interestingly, and show almost similar trend in which the increases monotonically as function of , while the and show completely different fashion. For the increases as increases while for decreases as increases. On the other hand, increases rapidly for . In graphite, is maximum while obtains its smallest value. We find a crossover between and at (see Fig. 2(d)). Thus, we propose that for the optical conductivity of epitaxial multilayer graphene is dominated by high energy resonant excitonic effects, while for , the optical conductivity is dominated by interband transitions.
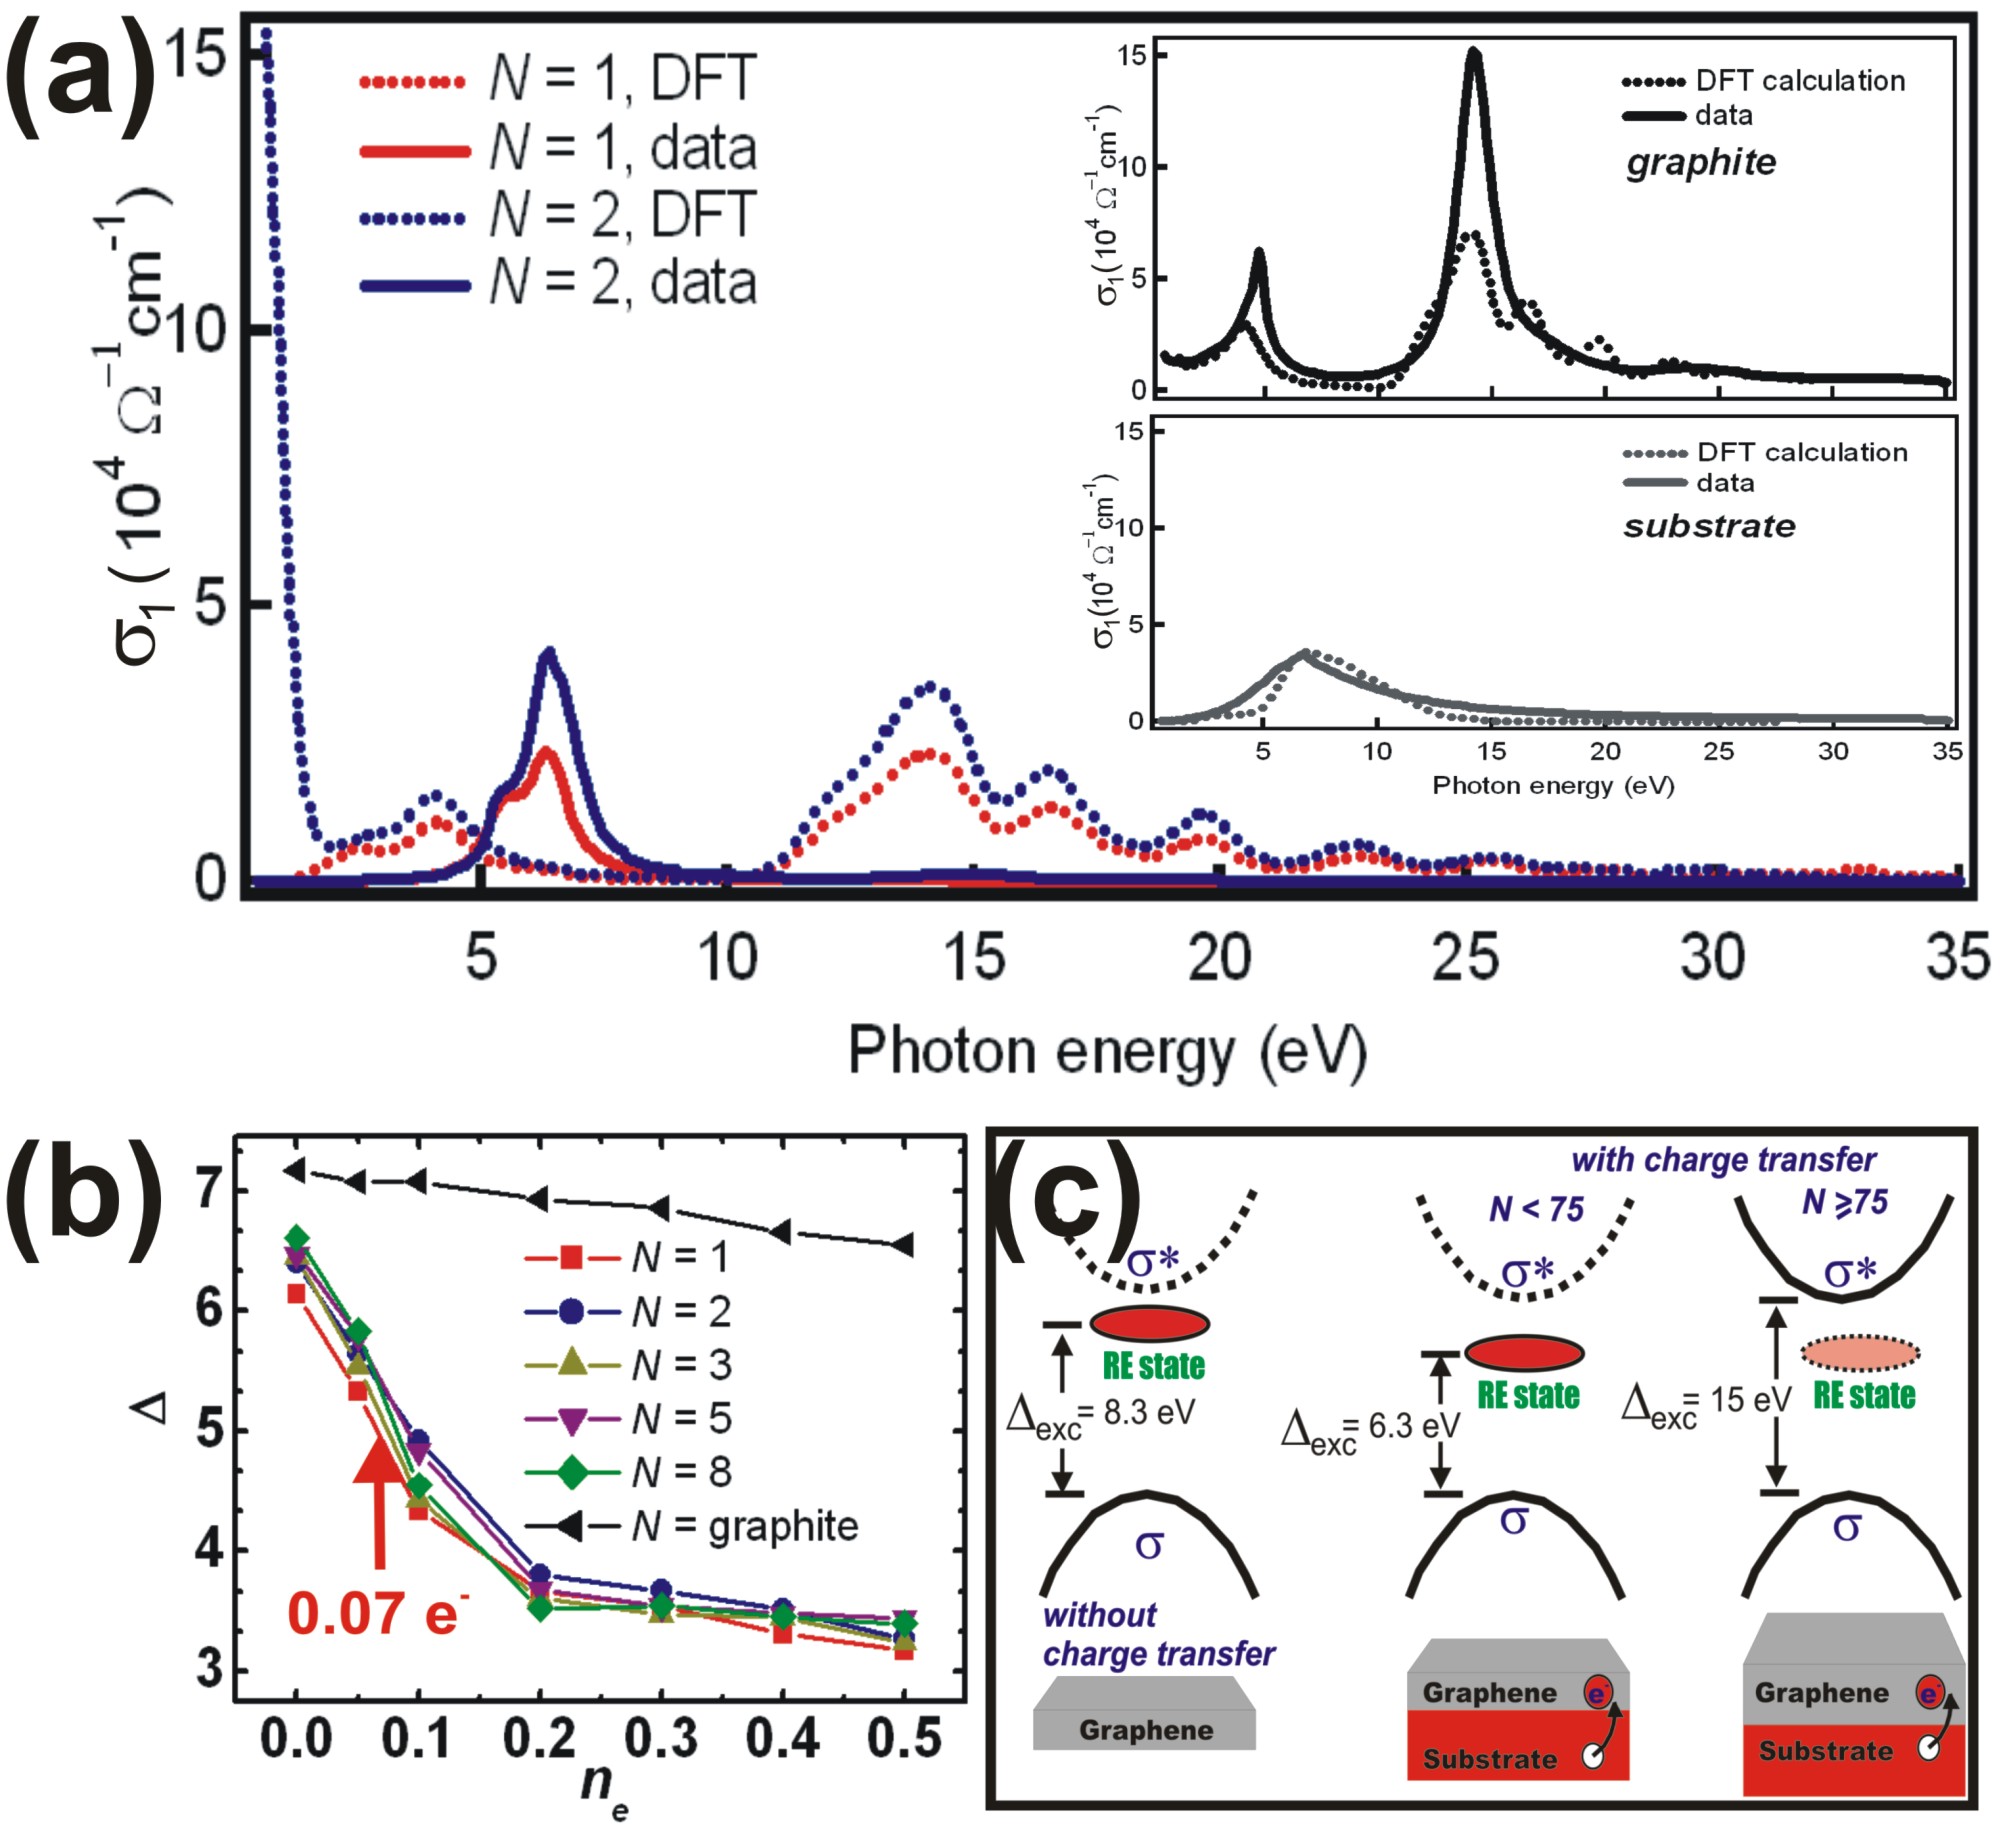
To gain further insight, we have calculated the optical conductivity () of graphene, graphite, and substrate using Density Functional Theory (DFT). We have studied the role of interband transitions and have compared them with experimental results (see Fig. 3(a)). Noting that our calculations do not include electron-hole () interactions, thus () is mainly driven by interband transitions and serves as reference for the non-correlated case. (The detail of calculation is given in supplementary section.) Based on the DFT calculation, () mimics reasonable well the () for graphite as well as for 6H-SiC(0001)/buffer layer. For graphite, the peak at 4 eV is dominated by transitions from bands while the peak at 14.1 eV is transitions from bands. This is consistent with previous theoretical studyAhujaPRB .
On the other hand, the DFT calculations for graphene show that its optical conductivity cannot be explained with interband transitions. As shown in Figure 3(a), the calculated optical conductivity for graphene shows a completely different result than the experimental data and thus our attempt to mimic for = 1 and 2 failed. Calculations based on DFT show that the for graphene ( = 1, 2) above 3 eV is very similar to graphite. This is in contrast to our experimental results. This further supports that the is mainly driven by strong interactions which lead to high energy resonant exciton and form unusual electronic band structure while the optical conductivity of graphite is mainly driven by interband transitions. It is shown that for = 1, once one turns on the interactions, the peak around 4 eV and peak around 14.1 eV (inset of Fig. 3(a)) vanish resulting new and very strong peak in betweenTrevisPRB .
To find out the origin of the redshift of the excitonic excitation, we have calculated the variation of the bands and the background single-particle continuum transitions () as function of charge transfer () and strain. We find out that while the bands are nearly independent from these two effects, the background single-particle continuum transitions are very much dependending on the charge transfer from substrate to the graphene layer (Fig. 3(b)). Based on our DFT calculations, the charge transfer from substrate to graphene is about 0.07e (per graphene unit) and thus the background single-particle continuum transitions reduce by 1.4 eV compared to that of for . The strain in graphene due to the lattice mismatch with the substrate reduce the background single-particle continuum transitions by eV. These two effects altogether decrease the single-particle continuum transitions to about 2.0 eV in total. Thus, one may expect to see the exciton at lower energy of 6.3 eV. Our result may suggest that energy excitation of exciton depends on the and the strain.
Interestingly, our calculation shows that does not dependent on significantly (Fig. 3(b)). This is in fact consistent with our experimental result. In contrast, the theoretical predictions in Ref.TrevisPRB show an energy shift between the exciton in graphene and bilayer graphene which is attributed to enhanced screening. Our experimental results show, however, that the position of the exciton does not depend on the value till about to = 22. This can be reconciled with the Ref.TrevisPRB only if one assumes that screening effects are significantly reduced. Thus, by comparing the experimental results and theoretical calculations, one may conclude that screening effects in graphene are much weaker than one would expect. Altogether our results suggest that graphene belongs to the class of strongly correlated electron systems.
Finally, based on our experimental results of high energy optical conductivity, DFT calculations, and recent ab initio GW-BSE calculations TrevisPRB , we have proposed the following phase diagram (Fig. 2(c-d)) and a model for optical absorption which is proportional to (Fig. 3(c)). For free standing graphene of =1, the optical absorption is dominated by high energy resonant exciton effects which occur around 8.3 eV. However, in our case due to the charge transfer and lattice mismatch between graphene and the substrate, the resonant exciton reduces to 6.3 eV. For , the optical absorption shows very strong resonant excitonic-like structure and weak interband transitions. While for the optical absorption shows a mixture between exciton and interband transitions (Figs. 2(d) and 3(c)). For as well as for graphite, the optical absorption is dominated by interband transitions.
In summary, we have observed a high energy room temperature stable resonant exciton at 6.3eV with a large binding energy of 2.7 eV in the optical conductivity of multilayer epitaxial graphene revealing strong collective interactions. The resonant exciton persists for very large and thus dominates the electronic properties owing to the poor screening in graphene. Furthermore, the mixture of interband transition from to at the M point and weak plasmonic excitation gives rise to peak in the optical conductivity at 5.4 eV. These findings demonstrate the importance of high energy optical conductivity and have strong implications on the understanding of the electronic structure of epitaxial graphene.
We are grateful to George A. Sawatzky, Antonio Castro Neto, and Alexey Kuzmenko for their very useful discussions. This work is supported by NRF-CRP grant Tailoring Oxide Electronics by Atomic Control, NRF-CRP grant graphene and Related Materials R-143-000-360-281, NRF-CRP grant Multi-functional spintronic materials and devices, NUS YIA, Advance Material (NanoCore) R-263-000-432-646, BMBF 05KS7GUABMBF07-204 and MOE-AcRF-Tier-1 (Grant No. M52070060).
References
- (1) A. H. Castro Neto et al, Rev. Mod. Phys. 81 109 (2009).
- (2) K. S. Novoselov et al, Science 306, 666 (2004).
- (3) K. S. Novoselov et al Nature 438, 197 (2005).
- (4) Y. Zhang et al Nature 438, 201 (2005).
- (5) T. Ohta et.al Science 313, 951-954 (2006).
- (6) Y. Zhang et.al Nature 459, 820 (2009).
- (7) A. Bostwick et.al Nature Phys. 3, 36 (2007).
- (8) R. R. Nair et.al Science 320, 1308 (2008).
- (9) Z. Li et.al Nature Phys. 4, 532 (2008).
- (10) L. Yang et.al, Phys. Rev. Lett. 103, 186802 (2009).
- (11) P. E. Trevisanutto et.al, Phys. Rev. B 81, 121405R (2010).
- (12) A. B. Kuzmenko et.al, Phys. Rev. Lett. 100, 117401 (2008).
- (13) K.F. Mak et.al, Phys. Rev. Lett. 101, 196405 (2008).
- (14) S. Latil et.al, Phys. Rev. Lett. 97, 036803 (2006).
- (15) T. Ohta et.al, Phys. Rev. Lett. 98, 206802 (2007).
- (16) Kravets et.al, Phys. Rev. B 81, 155413 (2010).
- (17) A. Rusydi et.al, Phys. Rev. B 78, 125110 (2008).
- (18) W. Chen et.al, Surf. Sci. 596, 176 (2005).
- (19) H. Huang et.al, ACS Nano 2, 2513 (2008).
- (20) S. Shivaraman et.al, J. Elec. Mat 38, 725 (2009).
- (21) E.A. Taft et.al, Phys. Rev. 138 A197 (1965).
- (22) A. G. Marinopolous et.al, Phys. Rev. Lett. 89, 076402 (2002).
- (23) T. Eberlein et.al, Phys. Rev. B 77, 233406 (2008).
- (24) L. Jiong et.al, Phys. Rev. B 80, 113410 (2009).
- (25) R. Ahuja, et.al, Phys. Rev. B 55, 4999 (1997).
- (26) K.V. Emtsev, et.al, Phys. Rev. B 77, 155303 (2008).
- (27) D.G. Thomas, J. Phys. Chem. Solids 15, 86 (1960).
- (28) J. Hegarty and M.D.Sturge, J. Opt. Soc. Am. B 2, 1143 (1985).