The He-rich Stripped-Envelope Core-Collapse Supernova 2008ax.††thanks: This paper is based on observations collected at the 3.58m Telescopio Nazionale Galileo (La Palma, Spain), the 2.2m Telescope of the Centro Astronómico Hispano Alemán (Calar Alto, Spain), the Asiago 1.82m and 1.22m Telescopes (Italy) and the 1.08m AZT-24 telescope (Campo Imperatore, Italy).
Abstract
Extensive optical and near-infrared (NIR) observations of the type IIb supernova 2008ax are presented, covering the first year after the explosion. The light curve is mostly similar in shape to that of the prototypical type IIb SN 1993J, but shows a slightly faster decline rate at late phases and lacks the prominent narrow early-time peak of SN 1993J. From the bolometric light curve and ejecta expansion velocities, we estimate that about 0.07–0.15 of 56Ni were produced during the explosion and that the total ejecta mass was between 2 and 5 , with a kinetic energy of at least erg. The spectral evolution of SN 2008ax is similar to that of the type Ib SN 2007Y, exhibiting high-velocity Ca II features at early phases and signs of ejecta-wind interaction from H observations at late times. NIR spectra show strong He I lines similar to the type Ib SN 1999ex, and a large number of emission features at late times. Particularly interesting are the strong, double-peaked He I lines in late NIR spectra, which – together with double-peaked [O I] emission in late optical spectra – provide clues for asymmetry and large-scale Ni mixing in the ejecta.
keywords:
supernovae: general – supernovae: individual (SN 2008ax, SN 1993J, SN 1999ex, SN 2007Y) – galaxies: individual (NGC 4490).1 Introduction
Type IIb, Ib and Ic supernovae (SNe IIb, Ib, Ic), also referred to as stripped-envelope supernovae (SE-SNe), show a large diversity in observed properties. They are distinguished from the majority of all core-collapse events (type IIP SNe) by less persistent or absent hydrogen lines in their early spectra and the lack of a plateau phase in their light curves. SNe IIb represent a transition between hydrogen-dominated SNe IIP and mostly hydrogen-free, helium-dominated SNe Ib. They are therefore particularly interesting to clarify the evolutionary path of SE-SN progenitors. However, SNe IIb are relatively rare. Only few have been observed up to now, and little is known about their spread in mass and energy.
The subdivision of SNe into type IIb and type Ib is not uncompromising, as it depends strongly on the hydrogen mass and distribution, and on the phase at which the supernova was discovered. Recent studies have suggested that there may be traces of hydrogen in all SN Ib spectra, and of both hydrogen and helium even in SNe Ic (Branch et al., 2002, 2006; , 2006; Parrent et al., 2007).
Despite the increasing interest in SE-SNe due to their link to long-duration -ray bursts (GRBs; e.g. Galama et al., 1998; Hjorth et al., 2003; Mirabal et al., 2006; Campana et al., 2006) and X-ray flashes (Sollerman et al. 2006; Mazzali et al. 2008; but see also e.g. Modjaz et al. 2009), their diversity has not yet been fully understood. New observations, like the first detection of a very energetic type IIb hypernova (SN 2003bg; 2009; Mazzali et al. 2009), rather indicate more diversity than previously thought. At present, possible progenitor scenarios include massive stars in close binary systems experiencing strong mass transfer, very massive single stars with strong stellar winds (Heger et al., 2003), or a combination of these two processes. So far, it has not been possible to discriminate between these scenarios by direct progenitor detections. SN 2008ax provides a rare opportunity to add detailed observations of a SN of this class. It is one of few cases discovered soon after explosion, with the progenitor detected in HST images (Li et al., 2008; Crockett et al., 2008). From X-ray to radio wavelengths, it is the best-monitored SN IIb after the very nearby SN 1993J (e.g. van Driel et al., 1993; Lewis et al., 1994; Ohta et al., 1994; Barbon et al., 1995; Richmond et al., 1996), which has become a prototype for the entire subclass.
SN 2008ax was discovered independently by Mostardi et al. (2008) and Nakano & Itagaki (2008). With coordinates and (J2000) it was located arcsec east and arcsec south of the centre of NGC 4490. Follow-up observations of SN 2008ax started soon after discovery. The SN site had been monitored by Arbour (2008) on UT March 3.19, and no source had been detected down to a limiting magnitude of 18.5. This detection limit allowed Pastorello et al. (2008, hereafter P08) to constrain the explosion time to be UT March 3.30, with a small uncertainty of 0.15 days (JD = ). Early X-ray, UV, optical and radio observations of SN 2008ax were presented by Roming et al. (2009, hereafter R09), and densely sampled optical photometry was published by P08 and Tsvetkov et al. (2009, hereafter Ts09). A series of optical and early NIR spectra were presented by P08 and Chornock et al. (2010, hereafter Ch10). Three epochs of optical spectropolarimetry were analysed by Ch10, and reveal strong line polarisation, especially across the hydrogen lines, shortly after the explosion. 23 GHz Very-Long-Baseline-Interferometry (VLBI) observations of SN 2008ax, made 33 days after the explosion with the Very Long Baseline Array (VLBA) by Martí-Vidal et al. (2009), resulted in a marginal detection of the supernova. A total flux density of mJy was measured, and the structure was interpreted as either a core-jet or a double source. A progenitor mass-loss rate of yr-1 was inferred by R09 based on X-ray data. Ch10 estimated yr-1 by the lack of narrow emission lines in a moderate-resolution early-time spectrum, in good agreement with the R09 result. R09 detected an initial fading in the UV light curves of SN 2008ax, interpreted as a fingerprint of adiabatic cooling after shock breakout. With this paper we contribute additional broadband optical and infrared imaging and spectroscopy of SN 2008ax, starting shortly after the explosion and extending to one year thereafter. Modelling of our nebular spectra has already been published by Maurer et al. (2010a, hereafter M10).
2 Observations and Data Reduction
2.1 Photometry
Optical () imaging of SN 2008ax was carried out using the following instruments:
-
1.
DOLORES (with a scale of 0.252 arcsec px-1 and a field of view of arcmin2) at the 3.58m Telescopio Nazionale Galileo (La Palma, Spain)
-
2.
CAFOS (with a scale of 0.53 arcsec px-1 and a field of view of arcmin2) at the Calar Alto 2.2m Telescope (Andalucía, Spain)
-
3.
AFOSC (with a scale of 0.46 arcsec px-1 and a field of view of arcmin2) mounted on the 1.82m Copernico Telescope of Mt. Ekar (Asiago, Italy)
The optical data were reduced following standard prescriptions (overscan, bias, flat-field correction) in the iraf111Image Reduction and Analysis Facility (iraf), a software system distributed by the National Optical Astronomy Observatories (NOAO). environment. Instrumental magnitudes were measured on the reduced images using a PSF-fitting technique with the software package snoopy, specifically developed for SN photometry by E. Cappellaro and F. Patat. For late-time - and -band data we used the template-subtraction technique with pre-explosion reference images of the host galaxy. Several tests performed with the PSF-fitting and template-subtraction techniques showed negligible differences as long as the SN was brighter than 19 mag.
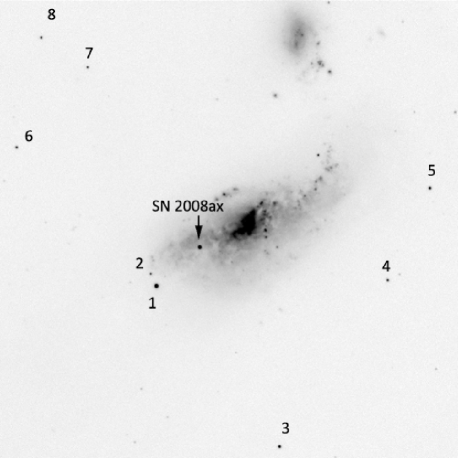
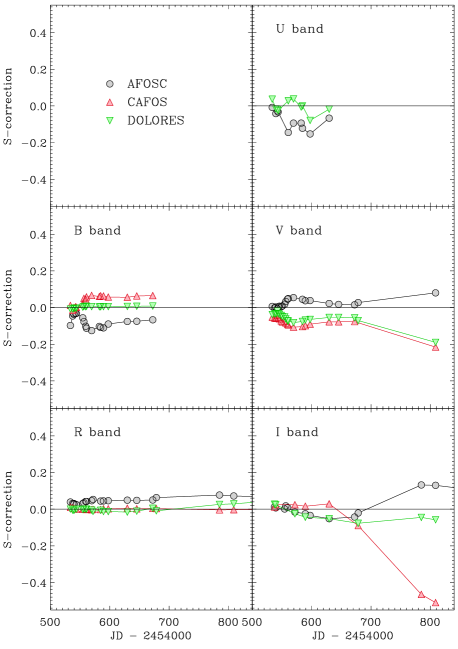
The calibration of the optical photometry was performed with respect to standard fields of Landolt (1992), observed in the same nights as the SN. The magnitudes of a sequence of stars in the field of NGC 4490 (Fig. 1 and Table 6) were computed averaging the measurements obtained during four photometric nights, with the uncertainties reported in Table 6 being the r.m.s. deviations over these nights. Care was taken to exclude saturated stars from the analysis. The SN magnitudes were finally determined relative to these stars. Since instruments with different passbands were used for the follow-up of SN 2008ax (see fig. 2 of Taubenberger et al. 2010), we applied the ‘-correction’ technique (Stritzinger et al., 2002; Pignata et al., 2004) to calibrate the optical SN magnitudes to the standard photometric system of Johnson and Cousins (Bessell, 1990). The -correction was determined from our spectral sequence of SN 2008ax. At epochs where no spectra were available, the terms were determined by linear interpolation or constant extrapolation.
NIR () imaging was obtained with NICS (0.25 arcsec px-1, field of view arcmin2) mounted on the 3.58m Telescopio Nazionale Galileo (La Palma, Spain) and SWIRCAM (1.03 arcsec px-1, field of view arcmin2) mounted on the 1.08m AZT-24 Telescope (Campo Imperatore, Italy).
The pre-reduction of the NIR images required some additional steps. Owing to the bright background in the NIR, we had to remove the sky contribution from the target images. This was done by median-combining a number of dithered science frames. The resulting sky template was then subtracted from the target images. Our data were obtained in several dithered, short exposures to enable a clean sky subtraction and to avoid exceeding the linearity regimes of the detectors. The NICS images were additionally corrected for cross-talk and for the distortion of the NICS optics. These corrections were performed using the SNAP222Written by F. Mannucci,
http://www.tng.iac.es/news/2002/09/10/snap/ pipeline available at TNG for the reduction of NICS data.
In analogy to the optical observations, NIR instrumental magnitudes were measured using a PSF-fitting technique. Only two stars of our local sequence (stars 1 and 2 in Fig. 1 and Table 6) were contained in the field of view of the NIR instruments. They were calibrated on three photometric nights using standard fields of the Arnica catalogue (Hunt et al., 1998). Again, the SN photometry was derived relative to the local standards.
The calibrated SN magnitudes in optical and infrared bands are reported in Tables 1 and 2, respectively. The -correction for the optical bands (i.e., the quantity added to the zero-point calibrated magnitudes instead of a colour-term correction) is listed in Table 7, and its temporal evolution for the different instruments is shown in Fig. 2.
| Date | JD | Phase333Phase in days with respect to the explosion date (JD = ). -band maximum light occurred on day 18.3. | Seeing444Average seeing in arcsec over all filter bands. | Instr.555CAFOS = Calar Alto 2.2m Telescope + CAFOS; DOLORES = 3.58m Telescopio Nazionale Galileo + DOLORES; AFOSC = Asiago 1.82m Copernico Telescope + AFOSC. | |||||
| (days) | (arcsec) | ||||||||
| 08/03/08 | 533.59 | 4.8 | 1.5 | CAFOS | |||||
| 12/03/08 | 537.53 | 8.7 | 2.1 | AFOSC | |||||
| 14/03/08 | 539.76 | 10.9 | 0.9 | DOLORES | |||||
| 16/03/08 | 542.41 | 13.6 | 1.4 | CAFOS | |||||
| 28/03/08 | 554.47 | 25.7 | 2.8 | AFOSC | |||||
| 30/03/08 | 556.44 | 27.6 | 1.3 | AFOSC | |||||
| 03/04/08 | 559.50 | 30.7 | 3.1 | AFOSC | |||||
| 04/04/08 | 560.61 | 31.8 | 2.1 | CAFOS | |||||
| 05/04/08 | 561.56 | 32.8 | 1.9 | CAFOS | |||||
| 12/04/08 | 569.35 | 40.6 | 1.5 | CAFOS | |||||
| 15/04/08 | 571.75 | 42.9 | 2.3 | DOLORES | |||||
| 25/04/08 | 582.35 | 53.6 | 1.2 | CAFOS | |||||
| 01/05/08 | 588.47 | 59.7 | 1.1 | CAFOS | |||||
| 02/05/08 | 589.38 | 60.6 | 1.7 | AFOSC | |||||
| 10/05/08 | 597.39 | 68.6 | 1.0 | DOLORES | |||||
| 11/06/08 | 629.48 | 100.7 | 1.2 | DOLORES | |||||
| 27/06/08 | 645.37 | 116.6 | 1.4 | CAFOS | |||||
| 05/07/08 | 653.41 | 124.6 | 1.8 | CAFOS | |||||
| 24/07/08 | 672.39 | 143.6 | 2.2 | AFOSC | |||||
| 24/11/08 | 794.69 | 265.9 | 1.6 | DOLORES | |||||
| 22/12/08 | 822.76 | 294.0 | 0.9 | DOLORES | |||||
| 19/02/09 | 881.54 | 352.7 | 1.2 | CAFOS |
| Date | JD | Phase666Epoch in days with respect to the explosion date (JD = ). -band maximum light occurred on day 18.3. | Instr.777NICS = 3.58m Telescopio Nazionale Galileo + NICS; CI = Campo Imperatore 1.08m AZT-24 Telescope + SWIRCAM. | |||
| (days) | ||||||
| 13/03/08 | 539.61 | 10.8 | NICS | |||
| 20/03/08 | 546.57 | 17.8 | CI | |||
| 28/03/08 | 554.56 | 25.8 | CI | |||
| 29/03/08 | 555.48 | 26.7 | CI | |||
| 31/03/08 | 557.48 | 28.7 | CI | |||
| 01/04/08 | 558.44 | 29.6 | CI | |||
| 07/04/08 | 564.38 | 35.6 | CI | |||
| 12/04/08 | 569.49 | 40.7 | CI | |||
| 14/04/08 | 571.48 | 42.7 | NICS | |||
| 11/06/08 | 629.54 | 100.7 | NICS | |||
| 11/07/08 | 659.42 | 130.6 | NICS |
2.2 Spectroscopy
The log of spectroscopic observations is reported in Table 3. The instruments were mostly the same as for the photometry. Three additional spectra near maximum brightness were taken with the B&C spectrograph mounted on the 1.22m Telescope in Asiago. We collected 27 epochs of spectroscopy, from 4.8 to 358.7 days after the explosion. To avoid flux losses due to differential refraction (Filippenko, 1982), the slit was aligned at the parallactic angle when the object was observed at airmass higher than 1.3.
The spectra were reduced using iraf routines. Frames were de-biased and flat-field corrected before the extraction of the spectra. Wavelength calibration was accomplished with the help of comparison lamps. Flux calibration and telluric-line removal were done using spectrophotometric standard star spectra observed during the same nights. If necessary, the spectral fluxes were adjusted to match the photometry.
Four low-resolution NIR spectra of SN 2008ax were obtained with NICS at TNG (Table 3). The spectral range of 8800–24500 Å was covered using the and dispersers with resolving power 500. All NIR spectroscopic observations were split into sub-exposures taken at different positions along the slit following an ABBA scheme. After dark and flat-field corrections and a pairwise subtraction of dithered frames, the SN spectra were optimally extracted, scaled to match in intensity and then combined. As for the optical spectroscopy, wavelength calibration was accomplished using arc lamps. In order to remove atmospheric absorption features and instrumental response, the object spectra were divided by a telluric standard of spectral type A0V, and re-scaled using the spectral energy distribution of Vega. Finally, the flux scale was adjusted to match the broadband magnitudes.
| Date | JD | Phase888Phase in days with respect to the explosion date (JD = ). -band maximum light occurred on day 18.3. | Instrument999CAFOS = Calar Alto 2.2m Telescope + CAFOS; DOLORES = 3.58m Telescopio Nazionale Galileo + DOLORES; AFOSC = Asiago 1.82m Copernico Telescope + AFOSC; B&C = Asiago 1.22m Galilei Telescope + B&C; NICS = 3.58m Telescopio Nazionale Galileo + NICS. | Range | Resolution101010Measured from the full-width at half maximum of night-sky lines. |
| (days) | configuration | (Å) | (Å) | ||
| 08/03/08 | 533.59 | 4.8 | CAFOS+B200 | 3600–8800 | 14 |
| 11/03/08 | 537.46 | 8.7 | AFOSC+gm2,4 | 3600–9500 | 24,38 |
| 13/03/08 | 539.49 | 10.7 | AFOSC+gm2,4 | 3600–9700 | 24,38 |
| 14/03/08 | 539.69 | 10.8 | NICS+IJ,HK | 8800–24500 | 22,26 |
| 14/03/08 | 539.68 | 10.9 | DOLORES+LRB,LRR | 3200–9300 | 11 |
| 16/03/08 | 542.42 | 13.6 | CAFOS+B200 | 3400–6400 | 14 |
| 18/03/08 | 543.53 | 14.7 | CAFOS+B200 | 3300–8850 | 13 |
| 20/03/08 | 545.54 | 16.7 | B&C+600ll/mm | 4750–7160 | 5 |
| 23/03/08 | 548.60 | 19.8 | B&C+600ll/mm | 4750–7160 | 5 |
| 25/03/08 | 550.60 | 21.8 | B&C+600ll/mm | 4730–7150 | 5 |
| 28/03/08 | 554.50 | 25.7 | AFOSC+gm2,4 | 3600–9200 | 24,38 |
| 30/03/08 | 556.37 | 27.6 | AFOSC+gm2,4 | 3600–9400 | 24,38 |
| 02/04/08 | 559.45 | 30.6 | AFOSC+gm2,4 | 3600–9400 | 24,38 |
| 04/04/08 | 560.62 | 31.8 | CAFOS+ B200 | 3300–8850 | 14 |
| 12/04/08 | 569.38 | 40.6 | CAFOS+B200 | 3300–8850 | 13 |
| 14/04/08 | 571.49 | 42.7 | NICS+IJ,HK | 8800–24500 | 22,26 |
| 14/04/08 | 571.76 | 43.0 | DOLORES+LR-R | 5200–9200 | 11 |
| 25/04/08 | 582.37 | 53.6 | CAFOS+B200 | 3300–6400 | 13 |
| 28/04/08 | 584.52 | 55.7 | CAFOS+B200 | 3500–8800 | 13 |
| 02/05/08 | 589.34 | 60.5 | AFOSC+gm2,4 | 3600–9400 | 24,38 |
| 10/05/08 | 597.41 | 68.6 | DOLORES+LR-B,LR-R | 3350–9300 | 11 |
| 11/06/08 | 629.49 | 100.7 | DOLORES+LR-B,LR-R | 3350–9300 | 11 |
| 12/06/08 | 629.56 | 100.8 | NICS+IJ,HK | 8800–24500 | 22,26 |
| 27/06/08 | 645.38 | 116.6 | CAFOS+B200 | 3300–6400 | 13 |
| 11/07/08 | 659.44 | 130.6 | NICS+IJ,HK | 8800–24500 | 22,26 |
| 24/07/08 | 672.34 | 143.6 | AFOSC+gm2,4 | 3600–9400 | 24,38 |
| 30/07/08 | 678.36 | 148.6 | CAFOS+G200 | 4850–10000 | 14 |
| 24/11/08 | 784.75 | 255.9 | DOLORES+LR-R | 5200–9200 | 15 |
| 08/12/08 | 808.77 | 280.0 | DOLORES+LR-R | 5200–9200 | 11 |
| 09/12/08 | 809.67 | 280.9 | AFOSC+gm4 | 4200–7700 | 24 |
| 25/02/09 | 887.53 | 358.7 | DOLORES+LR-R | 5200–9200 | 16 |
3 Distance and reddening
NGC 4490 is the brighter member of a closely interacting pair of galaxies, variously classified as a spiral or irregular system. In RC3 (de Vaucouleurs et al., 1991) NGC 4490 is classified as type SB(s)d, and the smaller companion NGC 4485 as type IB(s)m. Both galaxies show signs of tidal disruption (see Fig. 1). NGC 4485/90 is well studied over a wide range of wavelengths (from radio to X-rays). Its properties have already been discussed by P08 and Crockett et al. (2008). SN 1982F, classified as SN IIP, was also detected in the same galaxy.
The distance is the dominant source of uncertainty in the calibration of the luminosity of SN 2008ax, as there is some discrepancy among published distances of NGC 4490. Here we adopt a distance of Mpc ( mag), derived by P08 averaging several different estimates, including Tully-Fisher, Sosies and kinematic distances.
Another source of error is the unknown extinction along the line of sight towards SN 2008ax. Galactic reddening in the direction of NGC 4490 [ mag, Schlegel et al. 1998] is very small compared to the reddening inside the host galaxy. Our measurement of the equivalent width (EW) of the Na I D lines ( Å), averaged over 20 epochs, is in good agreement with published numbers (P08, Chornock et al. 2008). Based on the EW of Na I D, Chornock et al. (2008) and P08 estimated colour excesses mag and mag, respectively. Ch10 showed that the Na I D lines are saturated, and derived a colour excess of mag using the EW of the K I absorption. Here we adopt mag as the total colour excess towards SN 2008ax, accounting for the facts that the empirical relation of Turatto et al. (2003), used by P08, only gives a lower limit for the reddening, and that a closer match to the colour curves of SN 1993J is achieved with slightly larger reddening [adopting mag for SN 1993J; Maund et al. 2004].
4 Photometric analysis
4.1 Observed Light Curves
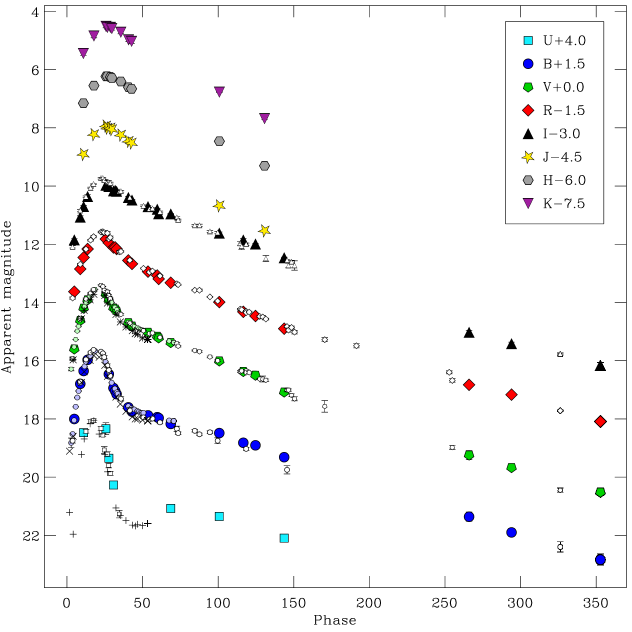
The magnitudes, acquired from five days to almost one year after the supernova explosion, are tabulated in Tables 1 and 2. The reported uncertainties are a quadratic combination of the measurement errors of the instrumental SN magnitudes and the errors associated with the photometric calibration. In Fig. 3 we compare our light curves of SN 2008ax with Johnson - and -band data points from P08 (small lightly coloured symbols), data from Ts09 (small open symbols) and observations from R09 (pluses, crosses, asterisks). The P08 points are in very good agreement with our photometry, any systematic offset being smaller than the scatter of the light curves. Our -band photometry is a bit brighter than that of Ts09, whereas in other bands our measurements are fainter, at least during the peak phase. The differences are time-dependent: large at early phases and smaller later on. The differences at peak are 0.10, 0.14, 0.19 and 0.19 mag in , , and , respectively. A comparison of the magnitudes of the single sequence star we have in common with Ts09 shows that most of this difference (at least the time-independent component) comes from a deviant local-sequence calibration and hence different photometric zero points. The SWIFT band is bluer than most ground-based bands, and some differences between our and the R09 -band photometry may be expected. The apparent re-brightening in the combined -band light curve about 50 d after the explosion may thus be an artefact caused by different passbands. The R09 - and -band light curves are slightly fainter than ours after maximum light, but agree within the measurement errors. In the end, most time-dependent differences can be related to different filter transmissions. Note that no -correction has been applied to the photometry of P08, R09 and Ts09.
The epoch of the light-curve peak and the observed peak magnitude in each filter were estimated using moderate-order (3–5) polynomial fits. In Table 4 the derived light-curve parameters are presented. SN 2008ax reached -band maximum on UT March 23 at m. Adopting a distance modulus of 29.92 mag, and a total extinction mag, the absolute magnitude was at peak. This value can be considered normal for a member of this inhomogeneous class of objects (Richardson et al., 2006). It coincides with the second peak of SN 1993J (M for the distance and reddening adopted by Maund et al. 2004) and the peak of the type IIb hypernova 2003bg (M, 2009; Mazzali et al. 2009). At the same time, it is mag and mag brighter than the type Ib SNe 2008D (Mazzali et al., 2008) and 2007Y (Stritzinger et al., 2009), respectively. About 60 d after the explosion, SN 2008ax settles onto a linear decline with a rate of 1.90 mag per 100 d in the band (see Table 4). This rate and those derived for other bands are similar, but somewhat faster, than the decline of SN 1993J. A least-squares fit to the data of SN 1993J from Barbon et al. (1995) gives slopes for the , , and light curves of 1.46, 1.73, 1.57 and 1.77 mag per 100 d, respectively, between 60 and 300 d after the explosion. Except for rare cases (e.g. SN Ib 1984L; Schlegel & Kirshner 1989) where the slope approaches the rate expected for 56Co decay in case of complete -ray trapping (0.98 mag per 100 d), a steeper decline is common for SE-SNe between and d [e.g. SN Ib 2007Y (Stritzinger et al., 2009), SN Ib 1990I (, 2004), SN Ib 1983N, SN Ic 1983V, SN Ic 1994I (Clocchiatti & Wheeler, 1997), SN IIb 1993J (Richmond et al., 1996; Barbon et al., 1995), and SN Ib 1996N (Sollerman et al., 1998)], suggesting in general rather low ejecta masses compared to SNe IIP.
| Filter | Peak time111111Based on a polynomial fit. | Peak observed | Peak absolute | Decline rate of | |
|---|---|---|---|---|---|
| (days after explosion) | magnitude | magnitude121212Distance modulus mag, colour excess mag. | radioactive tail131313Average decline rate between 100 and 300 d after the explosion for , and between 60 and 150 d for (in mag per 100 d). | (mag)141414Decline within 15 d from peak. | |
| 151515-band parameters were calculated including the data points of R09 and Ts09. | |||||
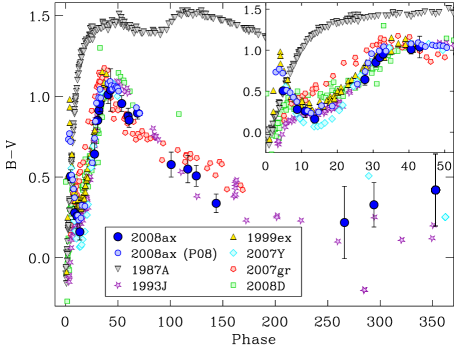
Fig. 4 compares the colour evolution of SN 2008ax, the type Ic SN 2007gr (Hunter et al., 2009), the type Ib SNe 1999ex (Stritzinger et al., 2002) and 2008D (Modjaz et al., 2009), the type IIb SNe 1993J (van Driel et al., 1993; Lewis et al., 1994; Barbon et al., 1995; Richmond et al., 1996) and 2007Y (Stritzinger et al., 2009), and the type IIP SN 1987A (e.g. Catchpole et al. 1989; see also Hillebrandt & Höflich 1989 and references therein). The extinction towards SN 1999ex is rather uncertain. Here we adopt mag (Stritzinger et al., 2002). The values for the other objects are the same as used for the bolometric curves (see Section 4.2 and Table 5). During the first two weeks after explosion, the colour curve of SN 2008ax closely resembles those of SNe 1999ex and 2007Y. These three SNe initially evolve towards bluer colours, suggesting a photospheric-temperature increase. Two weeks after the explosion, SN 2008ax reaches mag. Thereafter it turns redder, with a peak mag at 40 d. At late phases the SN becomes bluer again, with mag on day 270. The close similarity of the colour curves of SNe 2008ax and 1993J from ten days after the explosion onwards is remarkable.
4.2 Bolometric Light Curves
We constructed the pseudo-bolometric light curve of SN 2008ax based on our optical and infrared data, assuming mag and a distance of Mpc. To this aim, the magnitudes were first corrected for reddening and converted into monochromatic fluxes. The spectral energy distribution was then interpolated linearly and integrated over frequency. Finally, the integrated flux was converted into a luminosity using our adopted distance to NGC 4490. The extrapolation for missing -band data at early and late phases, and missing coverage at late phases, was done assuming a constant colour with respect to the band closest in wavelength that covered these phases.
Since SWIFT UV photometry exists for SN 2008ax (R09), we repeated the calculation of the pseudo-bolometric light curve including also these bands. The result, however, is quite uncertain owing to the extended red tail of the SWIFT and passbands, which for red objects shifts the effective wavelengths of the bands to the red. Brown et al. (2010) found that in type Ia SNe sometimes 90 per cent of the flux measured in and actually arises from the red tail. Lacking UV spectra of SN 2008ax, there is no possibility to determine proper red-tail corrections. The UV flux based on the magnitudes reported by R09 is thus only an upper limit to the true UV flux of SN 2008ax. Since even without a red-tail correction the UV contribution to the pseudo-bolometric light curve does not exceed 15 per cent at very early phases (when it is largest) and has dropped below 10 per cent by maximum light, we conclude that the UV does not give a major contribution to the luminosity of SN 2008ax at any phase, and neglect it hereafter.
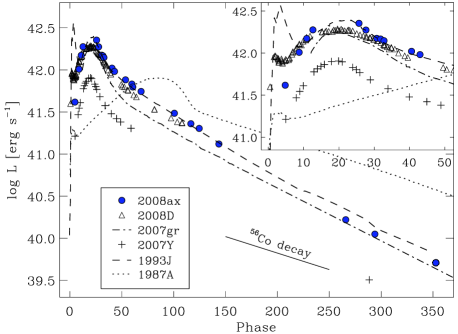
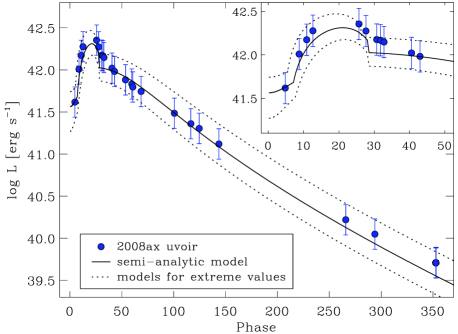
In Fig. 5 the pseudo-bolometric -through--band light curve of SN 2008ax is compared to those of several well-studied SE-SNe and the type IIP SN 1987A. For SN 1987A the adopted distance modulus and total reddening are mag and mag, whereas for the SE-SNe the values are reported in Table 5. For SN 2008D we have used the numbers given by Mazzali et al. (2008). SN 2007Y is assumed to have had a -band rise time of 19 d, similar to SNe 1999ex and 2008ax. The bolometric luminosity of SN 2008ax peaks at erg s-1 on day 20.7. Except for the first 10 d, its light curve is very well matched by that of SN 1993J. The flux level at late times (after about 250 d), however, is more similar to that of SN 2007gr.
5 Spectroscopic analysis
5.1 Optical spectroscopy
The spectral sequence of SN 2008ax highlights that the sub-classification of SE-SNe is not straightforward, but may strongly depend on the phase at which a SN is discovered. The spectra of SN 2008ax show differences from those of the type IIb SN 1993J at early times. Similar to SN 1996cb (Qiu et al., 1999), SN 2008ax was initially classified as a type II SN based on prominent Balmer P-Cygni features (Blondin et al., 2008). Only 5 d after explosion it was re-classified as SN IIb (Chornock et al., 2008), as the spectra showed increasing He I features and strong polarisation in H, more typical of type IIb than normal type II SNe at this early stage. By maximum light, He I lines dominated the optical and near-infrared spectra, which then closely resembled those of SNe Ib such as SN 1999ex.
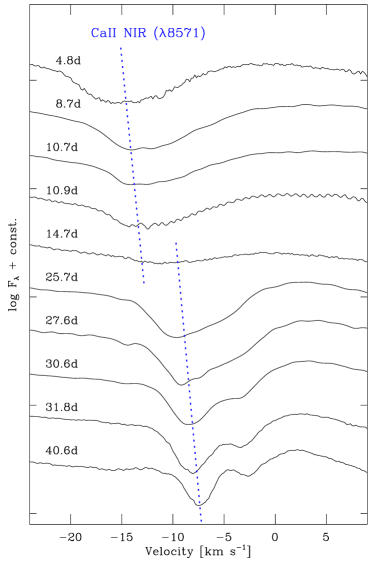
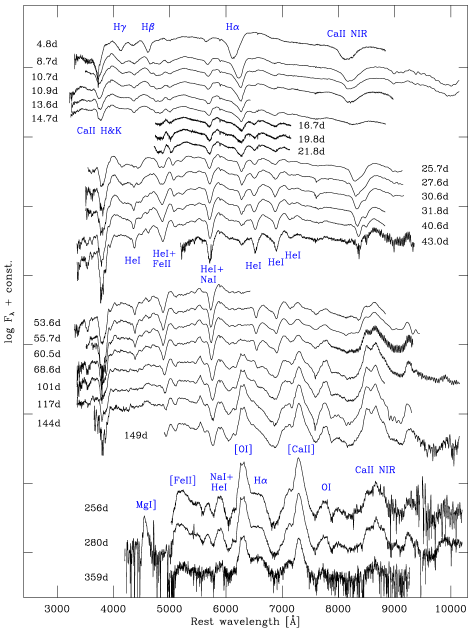
In Fig. 6 we show our sequence of spectra, ranging from 5 d to 1 yr after the explosion. The earliest phases are dominated by P-Cygni features of the hydrogen Balmer series and Ca II. Evolving through maximum, the strength of H steadily decreases, possibly overwhelmed by increasing He I . At this phase, the SN was re-classified as type Ib (Taubenberger et al., 2008; Marion et al., 2008). After maximum, the spectrum is dominated by strong He I lines, with the feature near 5700 Å probably being a blend of He I and Na I . The depth of the Ca II NIR triplet absorption decreases until 15 d after the explosion and increases again thereafter (Fig. 7). This phenomenon was already observed in other SNe and interpreted as the transition from a high-velocity component to a photospheric component (e.g. Stritzinger et al., 2009; Folatelli et al., 2006). All in all, the photospheric phase lasts for about two months. Later, during the nebular phase, the spectra of SN 2008ax share similarities with those of SN 1993J, including prominent [O I] emission and a boxy feature redwards of this line. The strong asymmetric emission peak at 4549 Å on day 280 can be identified as Mg I] .
Fig. 8 shows a comparison of the spectra of SN 2008ax at five days (upper-left panel), two weeks (upper-right), six weeks (lower-left) and 300 days (lower-right) after the explosion with those of the type IIP SN 1987A, the type IIb SNe 1993J (Barbon et al., 1995), 2007Y (Stritzinger et al., 2009) and 2008bo (Asiago SN archive), the type Ib SN 1999ex (, 2002), and the type Ic SN 2007gr (Valenti et al., 2008; Hunter et al., 2009) at similar phases.
At early epochs, SN 2008ax is similar to SNe 2007Y and 2008bo, but exhibits more prominent H. At 5 d, SN 2008ax has an expansion velocity (deduced from the H absorption minimum) of km s-1, compared to km s-1 in SN 2007Y. SN 1993J shows a blue, almost featureless continuum at this epoch, and in SN 2007gr no H can be identified. Near maximum, SN 2008ax resembles type Ib/c rather than type II SNe, exhibiting higher expansion velocities and little hydrogen in its spectra. Helium lines are not yet fully developed at this phase. Six weeks after the explosion, the He I lines are conspicuous, and SN 2008ax resembles a normal type Ib event with very weak H. At a similar phase, SN 2007Y shows no trace of H near 6300 Å.
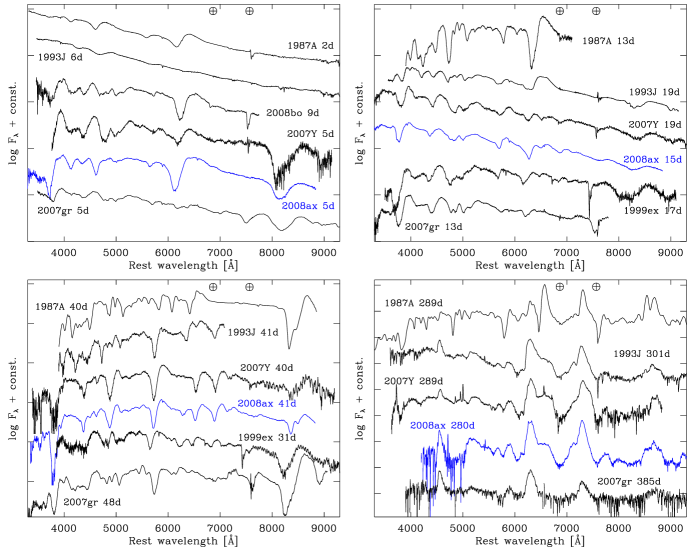
With strong Mg I] , [O I] [Ca II] emission lines, blended [Fe II] lines at Å and a characteristic, boxy feature on the red wing of the [O I] doublet, the nebular spectra of SN 2008ax share similarities with those of SNe 1993J and 2007Y. For SN 1993J the boxy line profile has been explained by H emission from a shell of hydrogen, possibly excited by interaction with a dense CSM (e.g. Patat et al., 1995; Houck & Fransson, 1996). A similar feature can also be seen in SNe 2007Y and 2008bo (Milisavljevic et al., 2010) during the nebular phase (Milisavljevic et al., 2010), and thus seems to be common in SNe IIb. The flux ratio [Ca II]/[O I] of SN 2008ax is slightly larger than in SN 1993J, and comparable to that of SN 2007Y. Fransson & Chevalier (1987, 1989) have shown that [Ca II]/[O I] is weakly dependent on the density and temperature of the emitting zone and remains relatively constant at late epochs. Besides, it seems to be sensitive to the core mass, thus tracing the main-sequence mass of the progenitor. The ratio increases with decreasing main-sequence mass. The [Ca II]/[O I] ratio of SN 2008ax ( at day 359) suggests a rather low-mass progenitor in a binary system rather than a single massive WR star, in agreement with the moderate mass-loss rate observed by R09.
5.2 NIR spectroscopy
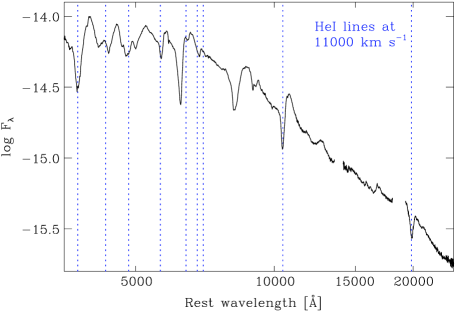
While the knowledge of the properties of SNe at optical wavelengths has made significant progress in recent years, still little is known in the infrared spectral range. Fig. 9 shows our earliest combined optical/NIR spectrum taken on 2008 March 14, about 11 d after the explosion. Vertical lines mark the expected positions of He I features for an expansion velocity of 11 000 km s-1. The spectrum shows strongly developed NIR He I m lines, whereas optical He I lines are still weak at this epoch.161616This comes not unexpected, since the NIR He I lines are transitions between (singlet or triplet) 2s and 2p levels. Being the lowest excited levels of He I, especially the meta-stable 2s levels are strongly populated. The optical He I transitions, on the other hand, all involve levels with . The good agreement in the expansion velocities measured in all He I lines and the very pronounced He I m feature suggest that the strong P-Cygni feature at m is indeed dominated by He I m, although some contribution of Paschen , C I, Mg II and other ions might be possible. Unfortunately, Pa lies in a region where the earth’s atmosphere is opaque. A weak feature at 1.24 m, which was also observed in SN 1993J (Matthews et al., 2002), is probably a hint of Pa. As the suspected Pa is already weak, we do not expect a large contribution of Pa to He I m.
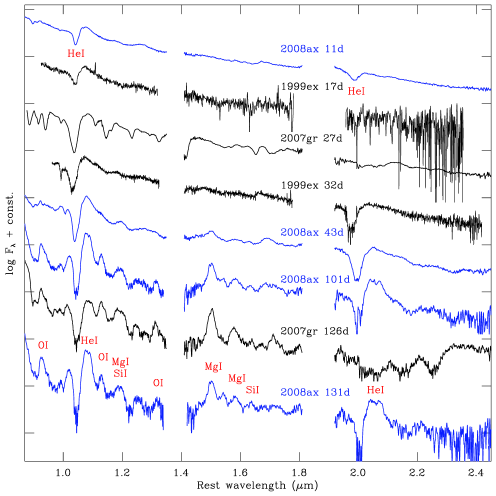
In Fig. 10 we compare our four NIR spectra of SN 2008ax with spectra of the type Ib SN 1999ex (, 2002) and the type Ic SN 2007gr (Hunter et al., 2009) acquired at similar phases. All spectra are redshift-corrected and dereddened with the same values as adopted for the optical data. The most prominent features of the NIR spectra of SN 2008ax at all epochs are the strong He I m lines. In that respect, SN 2008ax shows much closer resemblance to SN 1999ex than SN 2007gr, which lacks any hint of He I m as do all SNe Ic (Taubenberger et al., 2006). In quasi-nebular spectra, the emission bands at and m are attributed to O I m and O I m, respectively. Some contribution of [S I] m to the band at m is likely (Mazzali et al., 2010). Three emission bands between 1.15 and 1.35 m can be attributed to Mg I m + Si I m, [Fe II] m and O I m, respectively (Mazzali et al., 2010). Mg I also contributes at 1.502, 1.575 and 1.711 m, but the 1.7 m feature is probably blended with He I m, [Fe II] m and [Co II] m. Contrary to SN 2007gr, no emission from CO molecular bands at m is observed in SN 2008ax at these epochs.
5.3 Ejecta velocities
Here we present a more detailed and quantitative study of the expansion velocities measured from relatively isolated lines. All velocities have been determined measuring the blueshift of the minimum of the P-Cygni features, which is done by fitting a Gaussian profile to the absorption component in the redshift-corrected spectra. This procedure yields a rough estimate of the expansion velocities of the layers where the individual lines predominantly form.
A comparison of the H, He I 5876, Fe II 5169 and Ca II NIR triplet line velocities of SN 2008ax with those of SN 1993J (Barbon et al., 1995; Ohta et al., 1994), SN 1999ex (measured in spectra of 2002) and SN 2007Y (Stritzinger et al., 2009) is shown in Fig. 11. Ca II NIR triplet velocities are measured with respect to 8571 Å and should be used with caution, as this feature apparently has two components. A high-velocity component at km s-1 fades quickly and has disappeared by day 15, whereas a photospheric component at km s-1 develops just thereafter (Fig. 7). This phenomenon has also been observed in SNe 2005bf (Folatelli et al., 2006) and 2007Y (Stritzinger et al., 2009).
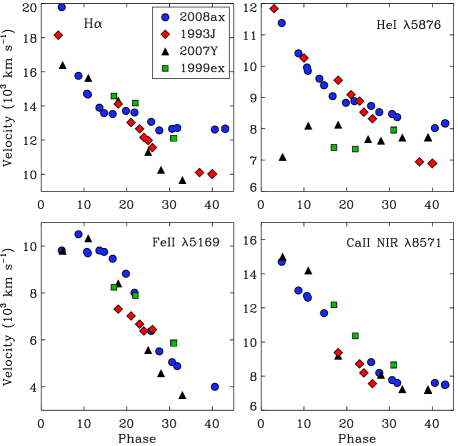
SN 2008ax shows a large initial H expansion velocity and a rapid decrease thereof during the first 15 days, with a drop from to km s-1. The velocity then remains almost constant. The evolution of the expansion velocities measured from He I 5876 is similar to that of H, but with smaller initial velocities of km s-1. After 20 d it settles at km s-1. The H and He expansion velocities of SN 1993J exhibit a similar evolution as those of SN 2008ax before day 20, but continue to decrease until day 35. Instead, SN 2007Y shows an increase of the He velocity at early phases, followed by a slow decrease from 8500 to 7500 km s-1. This non-uniform behaviour of He I 5876 velocities in SE-SNe may be caused by variable degrees of contamination with Na I . The evolution of the expansion velocities of Fe II 5169, which is often used as a tracer of the photospheric velocity, is in good agreement among the four SE-SNe considered here. In early spectra, Fe II velocities of km s-1 are measured, decreasing to km s-1 six weeks after the explosion.
6 Discussion
6.1 Explosion parameters
6.1.1 Light-curve modelling
The physical properties of the envelope have been derived using a semi-analytic code (see Zampieri et al. 2003 and Zampieri 2007 for details), which performs a simultaneous fit of three observable quantities (the bolometric light curve, the evolution of the photospheric velocity and the continuum temperature at the photosphere) with model calculations. The code assumes a homologously expanding SN envelope of uniform density and spherical symmetry. With the explosion epoch, distance modulus and reddening adopted in this paper, a good fit is obtained with an initial radius cm (), a velocity of the expanding envelope of about 10 000 km s-1, an explosion energy of erg, a 56Ni mass of and a total ejected mass of . The computed bolometric light curve is shown in Fig. 12 (solid line). It fits the radioactive tail quite well, but slightly underestimates the maximum. Large uncertainties related to distance and reddening cause uncertainties in the estimated physical parameters. These have been determined calculating models for extreme assumptions on distance and reddening: small distance with low reddening (lower dashed line) and large distance with high reddening (upper dashed line). Moreover, being a one-zone model our light-curve fit tends to overestimate the ejecta mass (and hence the kinetic energy) to compensate for the reduced opacity. As a result of all these considerations, we estimate the ejecta mass to be between and , the 56Ni mass to be in the range 0.07–0.15 , and the explosion energy to be between 1 and 6 foe (1 foe is erg).
6.1.2 Modelling of the early-time H absorption
The high-velocity H absorption wing 4.8 d after the explosion is sensitive to the hydrogen density in the outermost layers of the ejecta, which in turn depends on the mass and kinetic energy. One can use this fact to constrain independently these ejecta parameters. We use two versions of the density distribution , an exponential profile and a plateau with an external power-law decay . Both distributions seem reasonable: the exponential one approximates supernovae arising from compact progenitors, while the power law is more adequate in case of SNe IIP with extended hydrogen envelopes, e.g. SN 1987A (Utrobin, 2007). The population of the level of hydrogen in the model is determined by recombination, Ly scattering and two-photon decay. This is a reasonable approximation for the outer layers. The hydrogen abundance is set to be solar, while the ionisation fraction () is chosen such that the level population is maximised. This choice minimises the hydrogen mass in the outer layers required in our model to produce the high-velocity H absorption wing. We fixed the ejecta mass at (as a compromise between the results by R09, Ts09 and the light-curve modelling in this work) and varied only the kinetic energy between 1 and 2 foe (see Fig. 13).

For both the exponential and power-law density distribution the blue absorption wing
suggests that foe is a lower limit for the total kinetic energy of
the ejecta. If the hydrogen fraction was lower or the degree of ionisation different,
a larger kinetic energy would be required to reproduce the highest velocities in
H. The adopted mass and the derived minimum energy are consistent with the
parameters estimated by Ts09 and M10, as well as the light-curve modelling in
Section 6.1.1. The low energy of 0.5 foe found by R09, however,
is not supported by our modelling of the early H absorption.
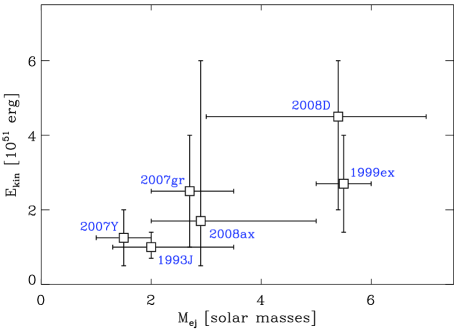
In Table 5 we show the physical parameters of SN 2008ax and other SE-SNe, derived using a variety of methods. SN 2008ax appears to be similar to SNe 1993J and 2007Y in terms of 56Ni and ejecta mass. A plot of the kinetic energy as a function of ejected mass (Fig. 14) shows the expected correlation between these two quantities within the (admittedly large) uncertainties. It also suggests that type IIb SNe generally have ejecta masses between 1 and 5 and explosion energies between 0.5 and 6 foe.
| SN | Type | MB,max | 171717Distance to SN 2008ax from P08, obtained averaging the results from several methods; short distance to SN 2008D ( mag) from the Tully-Fisher relation; distances to SNe 1993J and 2007gr from Cepheids; kinematic distances used for SNe 1999ex, 2007Y and 2008D (long distance, mag). | 56Ni mass | Ejecta mass | Reference | ||
| (mag) | (mag) | () | () | (1051 erg) | ||||
| 2008ax | IIb | 0.07–0.15 | 2–5 | 1–6 | This work | |||
| 0.07–0.15 | 1.9–4.0 | 0.7–2.1 | Maurer et al. (2010a) | |||||
| 0.3 | 0.06 | 2.9 | 0.5 | Roming et al. (2009) | ||||
| 0.3 | 0.11 | 2.3 | 1.5 | Tsvetkov et al. (2009) | ||||
| 2008D | Ib | 32.16 | 0.05–0.10 | 3–5 | 2–4 | Soderberg et al. (2008) | ||
| 32.45 | 0.65 | 0.09 | 7 | 6 | Mazzali et al. (2008) | |||
| 2007gr | Ic | 0.06–0.10 | 2.0–3.5 | 1–4 | Hunter et al. (2009) | |||
| 2007Y | Ib/IIb | 0.11 | 0.06 | 1–2 | 0.5–2.0 | Stritzinger et al. (2009) | ||
| 1999ex | Ib/c | 0.16 | 5–6 | 2.7 | Stritzinger et al. (2002) | |||
| 1993J | IIb | 0.2 | 0.10–0.14 | 1.9–3.5 | 1.0–1.4 | Young et al. (1995) | ||
| 0.2 | 0.10 | 1.3 | 0.7 | Richardson et al. (2006) |
6.2 Nature of the progenitor star
Two different scenarios for the progenitor of SN 2008ax have been proposed by Crockett et al. (2008) analysing pre-explosion HST observations: the precursor may have been a single massive star, which had lost most of its H-rich envelope and exploded as a helium-rich Wolf-Rayet star, or a stripped star in an interacting binary system. P08 favoured the explosion of a WNL star on the basis of the early spectro-photometric evolution of the SN. R09 instead suggested a binary progenitor based on UV, optical, X-ray and radio properties of SN 2008ax.
With our estimated physical parameters, SN 2008ax lies between SN 1993J, whose progenitor is thought to be a relatively-low-mass star in a binary system (Podsiadlowski et al., 1993; Young et al., 1995; Maund & Smartt, 2009), and SN 2008D, which probably had a massive Wolf-Rayet progenitor (Mazzali et al., 2008; Soderberg et al., 2008; Modjaz et al., 2009; Tanaka et al., 2009a). However, the [Ca II]/[O I] ratio in nebular spectra of SN 2008ax (Section 5.1) lends support to the lower-mass binary scenario.
6.3 Late-time H emission
Patat et al. (1995) found a late-time flux excess in the H line of SN 1993J compared to radioactive models. They argued that the nebular H luminosity was powered by interaction with a stellar wind from the progenitor. With a model for the ejecta-wind interaction, they derived a mass-loss rate of km s-1) yr-1 for the progenitor of SN 1993J. However, Houck & Fransson (1996) argued that H should be optically thick even during the nebular phase. Considering all contributions, in particular the scattering of photons emitted in the strong [O I] feature by H, they did not detect a significant flux excess until 200 d, suggesting no dominant contribution from ejecta-wind interaction up to that phase. Similarly, Chevalier & Soderberg (2009) tried to explain the H emission in nebular spectra of the SN 2007Y with radioactivity alone, claiming that circumstellar interaction should be undetectable at late phases because of the low density and large shock radius.
In SN 2008ax, observations of the H luminosity evolution may hint at some contribution from shock interaction at the latest phases. The H luminosity evolution of SN 2008ax was determined as follows. At early epochs, the local continuum around H was removed from the reddening-corrected spectra by subtracting a linear fit. The residual flux in the H P-Cygni profile was then integrated over wavelength, and transformed into a luminosity adopting a distance of 9.6 Mpc. At nebular epochs, the emission immediately redwards of [O I] was assumed to be H. Since the blue wing was contaminated by [O I], the H emission profile was assumed to be symmetric about the rest wavelength. The total flux is thus twice the value obtained by integration redwards of 6563 Å only.
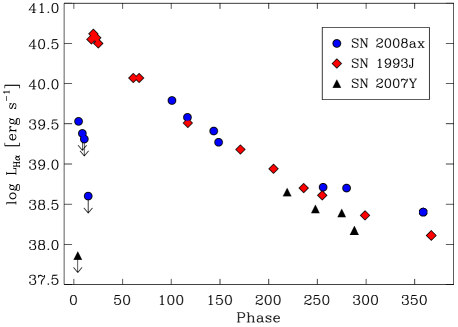
Fig. 15 shows a comparison of the H luminosity curve of SN 2008ax with those of SNe 1993J (Patat et al., 1995) and 2007Y (derived from spectra published by Stritzinger et al. 2009). Adopted distances are reported in Table 5. Compared to SN 1993J, SNe 2008ax and 2007Y show almost no net emission in H at early times. Instead, their H lines have perfect P-Cygni scattering profiles. After about 100 days after the explosion, a broad feature arises redwards of [O I] , which can be tentatively identified with H. However, at least during the early nebular phase until about 150 days after the explosion, a contribution from various other elements, most notably Fe, is likely (Patat et al., 1995). Moreover, at least part of the flux could arise from H scattering rather than pure emission (Houck & Fransson 1996, M10). Finally, there is a flattening in the H luminosity curve at very late phases, after 300 d for SN 1993J and 250 d for SN 2008ax. In SN 1993J this was interpreted as the transition to an interaction-dominated phase. The similarity of the H luminosity evolution of SNe 1993J and 2008ax suggests that the same mechanism is responsible for the emission in both objects.
The shock-wave mechanism for the late H emission in SN 2008ax, however, faces a serious problem: the high velocity of the interface between the ejecta and wind at this stage. We calculated the interaction dynamics in the thin-shell approximation, adopting foe, for the SN ejecta, and a wind density g cm-1, which corresponds to a mass-loss rate of yr-1 for a wind velocity km s-1 (as estimated by Ch10). If the H line is emitted by the cool dense shell at the reverse shock, this model results in a boxy line profile with a characteristic radial velocity of km s-1 on day 359, at least twice as large as the velocity of 6000 km s-1 measured at the edge of the observed feature.
The mechanism of the H emission powered by the shock wave could be salvaged if the hydrogen-rich ejecta or the surrounding circumstellar material were distributed in a disk, observed at a small inclination angle. The required angle is determined by the ratio of the observed line width and the model velocity of the thin shell: . In this scenario, however, significantly broader H emission (with edge velocities km s-1) is expected to be found in future observations of other SNe IIb.
Alternatively, most of the emission is actually related to low-velocity hydrogen of the unshocked ejecta, located far from the shock. This scenario requires a hydrogen distribution with an inner cut-off at 5000 km s-1, and a maximum hydrogen density attained at about this velocity. The mechanism of hydrogen emission in that case could include excitation by hard ( keV) X-rays from the forward shock. However, owing to the low luminosity of the shock ( erg s-1) and the small dilution factor ( 0.06), the excitation by hard X-rays can provide only a minor contribution to the non-thermal excitation owing to 56Co decay with a -ray luminosity of erg s-1. Ly scattering, however, might help by increasing the population of the second level, from which hydrogen can be ionised by SN radiation with eV. The emission rate of H quanta is then equal to the number of quanta absorbed from the Balmer continuum. This is another version of the ordinary non-thermal radiative mechanism of hydrogen emission in SNe IIP.
6.4 Explosion geometry
6.4.1 Nebular [O I] line profile
What distinguishes SN 2008ax from SNe 1993J and 2007Y during the nebular phase is the symmetric, double-peaked profile of [O I] . Double-peaked emission lines in late-time spectra of SE-SNe are relatively frequent (Maeda et al., 2008; Modjaz et al., 2008), and a possible explanation is that oxygen has a torus-like distribution and our line of sight is near the plane of the torus (Mazzali et al., 2005; Maeda et al., 2008; Tanaka et al., 2009b; Taubenberger et al., 2009; Maurer et al., 2010b). A different model has been discussed by Milisavljevic et al. (2010), suggesting the double peak to be caused by the doublet nature of [O I] , with a line ratio close to 1. The atomic physics of the [O I] doublet has been discussed by Spyromilio & Pinto (1991) and Li & McCray (1992), who show that in a supernova the ratio of [O I] to [O I] should evolve from at early times to at late times, as the ejecta expand and the lines become optically thin. This was actually observed in SNe 1986J (Leibundgut et al., 1991), 1987A (Spyromilio & Pinto, 1991; Li & McCray, 1992) and 1988A (Spyromilio, 1991). Taubenberger et al. (2009) argue that for SE-SNe at 100 d after the explosion the ratio should already be 3:1. Fig. 16a shows the evolution of the [O I] line of SN 2008ax between 101 and 359 d since explosion. One would expect to see a temporal intensity decrease of the red peak with respect to the blue one if the two peaks were due to optically thick [O I] and [O I] , as seen in SN 1987A (Li & McCray, 1992). However, this ratio increases with time, as seen also in SN 2004ao (Modjaz et al., 2008).
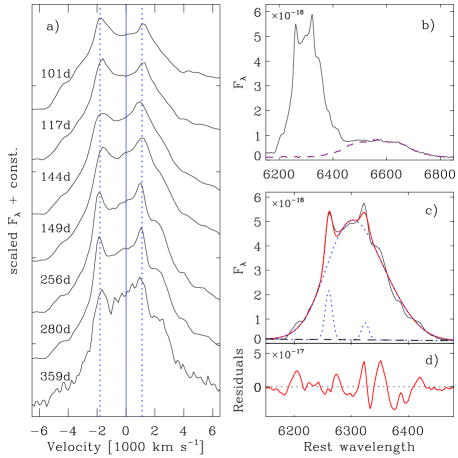
To exclude a contribution of H flux to the redshifted peak of [O I], we have subtracted the boxy profile assuming symmetry with respect to the H rest wavelength (see Fig. 16b, dashed line). We have then fitted the H-free [O I] profiles at four epochs (149–359 d) adopting the multi-Gaussian fitting procedure described by Taubenberger et al. (2009). One-component and classical double-peak fits have shortcomings in that they do not reproduce the two narrow peaks. A satisfactory fit can be obtained using 2 components: a broad one approximately at the rest wavelength, with a blueshifted, narrow one superimposed. The FWHM of the broader component is about 4800 km s-1, and it is systematically blueshifted by about 300 km s-1. The narrow component with FWHM of about 700 km s-1 is blueshifted by about 1900 km s-1. The relative flux of the second component ( in the notation of Taubenberger et al. 2009) is about 0.07. The best 2-component fit for the 280 d spectrum is presented in Fig. 16c, and the residuals are shown in Fig. 16d. The residuals might suggest an additional redshifted component, but the significance is rather low. Taken at face value, the derived fit configuration indicates an almost central, spherically symmetric distribution of the bulk of the oxygen-rich ejecta with an expansion velocity of km s-1, and a clump with enhanced density and/or excitation at a line-of-sight velocity of km s-1. However, a thin torus viewed from an equatorial direction in addition to a spherically symmetric mass of oxygen, or an aspherical distribution of the 56Ni exciting the oxygen, might be possible alternatives. Finally, M10 suggested that the minimum between the two peaks of [O I] may not have a geometric origin, but instead be produced by scattering in optically thick H, with the corresponding emission contributing to the late-time H feature discussed in Section 6.3.
6.4.2 Nebular line profiles in the NIR
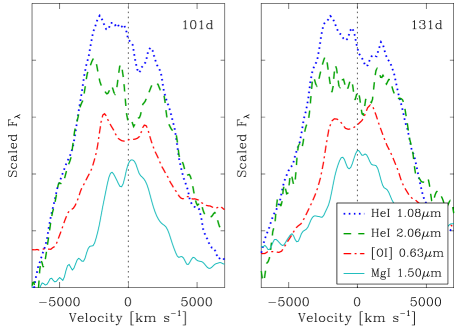
During the nebular phase, also the NIR He I m lines of SN 2008ax show double-peaked emission (Fig. 17). Actually, there are additional narrow peaks on day 101 in He I m, blueshifted by about 450 km s-1 with respect to the rest wavelength, and on day 131 in He I m, blueshifted by about 400 km s-1. However, as these narrow peaks do not persist at both epochs, they might be reduction artefacts and we do not consider them hereafter. The good match of the two NIR He I lines suggests that the observed double peak is indeed due to He I and not caused by a blend with other lines. In Fig. 17 we overlap the NIR He I emission lines with Mg I m and the double-peaked optical [O I] . Vertical lines mark zero velocity. The fluxes are scaled arbitrarily. The left panel shows the profiles at 101 d, the right one at 131 d ([O I] at 144 d). The expansion velocities of He I are higher than those of O I. We have measured a FWHM of km s-1 for the He I lines and a FWHM of km s-1 for [O I] (corrected for the doublet nature). The peaks of the He I lines are centred at and km s-1 with respect to the rest wavelength on day 131, while those of [O I] are found at and km s-1 with respect to 6300 Å on day 144. The Mg I m line has a smaller FWHM ( km s-1), in good agreement with the value from Mg I] on day 280. The blueshifted peak is centred at km s-1, the redshifted one close to the rest wavelength.181818 The structure seen in Mg I may, however, also be due to a blend of several Mg I lines (m). A possible common explanation for all these double-peaked profiles might be non-uniform distribution of 56Ni within the ejecta, which induces different degrees of heating and ionisation/excitation in the surrounding material. The variation in the double-peak separation for different species would then be a consequence of the chemical stratification of the ejecta.
7 Conclusions
SN 2008ax is one of the rare cases of a SN IIb discovered soon after the explosion and densely monitored from X-rays to radio waves. Our optical and NIR photometric and spectroscopic observations of SN 2008ax span almost one year from explosion. We have compared our data with previously published observations of SN 2008ax and with a sample of relatively well-studied SE-SNe. SN 2008ax appears to be a normal SE-SN, exhibiting properties in common with other SNe IIb and Ib. Its light curves most closely resemble those of SN 1993J from day 10 onwards, reaching an absolute peak magnitude of M. Similar to SN 1993J, the late decline rates are substantially faster than the decay rate of 56Co, indicating a leakage of -rays.
The spectral similarities with SNe 2007Y and 1999ex at early phases suggest similar photospheric conditions. However, some differences are also observed, which are likely related to deviations in ejected mass and geometry. We argue that the double peaks in the [O I] lines observed in spectra since d after the explosion have a geometric origin and are not caused by a 1:1 flux ratio of the doublet lines at high optical depth. This is consistent with significant late-time continuum polarisation found by Ch10.
NIR spectra show strong He I lines similar to SN 1999ex. Nebular NIR spectra exhibit a large number of emission features: He I, O I, Mg I, Si I, [Fe II]. Particularly interesting are the prominent, double-peaked profiles of the He I m lines, which – together with the profiles of [O I] – provide a clue for an asymmetric large-scale Ni mixing in the ejecta.
From modelling the bolometric light curve with a semi-analytic code, we have derived a total ejected mass of 4.5 , 0.1 of which is 56Ni. Our model yields a progenitor radius cm, which is consistent with the radius of cm derived by Chevalier & Soderberg (2009), but much smaller than the estimate of Ts09 ( cm). Owing to large uncertainties in distance and reddening, and knowing that our one-zone model tends to overestimate the ejecta mass, we conclude that lies between 2 and 5 , the 56Ni mass between 0.07 and 0.15 , and the explosion energy between 1 and 6 foe. However, modelling of the early-time H absorption restricts the total kinetic energy to be larger than 1.5 foe.
Acknowledgments
We are grateful to the anonymous referee, whose comments helped to improve this work considerably. Our thanks also go to the staff at the 3.58m Telescopio Nazionale Galileo (La Palma, Spain), the 2.2m Telescope of the Centro Astronómico Hispano Alemán (Calar Alto, Spain), the Asiago 1.22m and 1.82m Telescopes (Asiago, Italy) and the 1.08m AZT-24 telescope (Campo Imperatore, Italy). ST acknowledges support by the Transregional Collaborative Research Centre TRR33 ‘The Dark Universe’ of the German Research Foundation (DFG). We have made use of the NASA/IPAC Extragalactic Database (NED), operated by the Jet Propulsion Laboratory, California Institute of Technology, under contract with the National Aeronautics and Space Administration. This paper makes use of data obtained from the Isaac Newton Group Archive, which is maintained as part of the CASU Astronomical Data Centre at the Institute of Astronomy, Cambridge.
References
- Arbour (2008) Arbour R., 2008, CBET, 1286, 2
- Barbon et al. (1995) Barbon R., Benetti S., Cappellaro E., Patat F., Turatto M., Iijima T., 1995, A&AS, 110, 513
- Bessell (1990) Bessell M. S., 1990, PASP, 102, 1181
- Blondin et al. (2008) Blondin S., Filippenko A. V., Foley R., Li W., Dessart L., Vaz A., 2008, CBET, 1285
- Branch et al. (2002) Branch D., et al., 2002, ApJ, 566, 1005
- Branch et al. (2006) Branch D., Jeffery D. J., Young T. R., Baron E., 2006, PASP, 118, 791
- Brown et al. (2010) Brown P. J., et al., 2010, ApJ, 721, 1608
- Campana et al. (2006) Campana S., et al., 2006, Nature, 442, 1008
- Catchpole et al. (1989) Catchpole R. M., et al., 1989, MNRAS, 237, 55
- Chevalier & Soderberg (2009) Chevalier R. A., Soderberg A. M., 2009, ApJ, 711, L40
- Chornock et al. (2008) Chornock R., Filippenko A. V., Li W., Foley R. J., Stockton A., Moran E. C., Hodge J., Merriman K., 2008, CBET, 1298
- Chornock et al. (2010) Chornock R., et al., 2010, ApJ submitted, arXiv:1001.2775 (Ch10)
- Clocchiatti & Wheeler (1997) Clocchiatti A., Wheeler J. C., 1997, ApJ, 491, 375
- Crockett et al. (2008) Crockett R., et al., 2008, MNRAS, 391, L5
- de Vaucouleurs et al. (1991) de Vaucouleurs G., de Vaucouleurs A., Corwin H. G., Buta R. J., Paturel G., Fouque P., 1991, Third Reference Catalog of Bright Galaxies, Vols. 1–3, XII., Springer-Verlag, Berlin (RC3)
- (16) Elmhamdi A., Danziger I. J., Cappellaro E., Della Valle M., Gouiffes C., Phillips M. M., Turatto M., 2004, A&A, 426, 963
- (17) Elmhamdi A., Danziger I. J., Branch D., Leibundgut B., Baron E., Kirshner R. P., 2006, A&A, 450, 305
- Filippenko (1982) Filippenko A. V., 1982, PASP, 94, 715
- Folatelli et al. (2006) Folatelli G., et al., 2006, ApJ, 641, 1039
- Fransson & Chevalier (1989) Fransson C., Chevalier R. A., 1987, ApJ, 322, 15
- Fransson & Chevalier (1987) Fransson C., Chevalier R. A., 1989, ApJ, 343, 323
- Fridriksson et al. (2008) Fridriksson J., et al., 2008, ApJS, 177, 465
- Galama et al. (1998) Galama T. J., et al., 1998, Nature, 395, 670
- (24) Hamuy M., et al., 2002, AJ, 124, 417
- (25) Hamuy M., et al., 2009, ApJ, 703, 1612
- Heger et al. (2003) Heger A., Fryer C. L., Woosley S. E., Langer N., Hartmann D. H., 2003, ApJ, 591, 288
- Hillebrandt & Höflich (1989) Hillebrandt W., Höflich P., 1989, RPPh, 52, 1421
- Hjorth et al. (2003) Hjorth J., et al., 2003, Nature, 423, 847
- Houck & Fransson (1996) Houck J. C., Fransson C., 1996, ApJ, 456, 811
- Hunt et al. (1998) Hunt L. K., Mannucci F., Testi L., Migliorini S., Stanga R. M., Baffa C., Lisi F., Vanzi L., 1998, AJ, 115, 2594
- Hunter et al. (2009) Hunter D., et al., 2009, A&A, 508, 371
- Landolt (1992) Landolt A. U., 1992, AJ, 104, 340
- Leibundgut et al. (1991) Leibundgut B., et al., 1991, ApJ, 372, 531
- Lewis et al. (1994) Lewis J. R., et al., 1994, MNRAS, 266, 27
- Li et al. (2008) Li W., Filippenko A. V., Van Dyk S., 2008, ATel, 1433
- Li & McCray (1992) Li H., McCray R., 1992, ApJ, 387, 309
- Maeda et al. (2008) Maeda K., et al., 2008, Sci., 319, 1220
- Marion et al. (2008) Marion H., Garnavich P., Gerardy C. L., Rudy R. J., Lynch D. K., Russell R. W., Woodward C. E., 2008, CBET, 1305, 1
- Martí-Vidal et al. (2009) Martí-Vidal I., et al., 2009, A&A, 499, 649
- Matheson et al. (2001) Matheson T., Filippenko A. V., Li W., Leonard D., Shields J., 2001, AJ, 121, 1648
- Matthews et al. (2002) Matthews K., Neugebauer G., Armus L., Soifer B. T., 2002, AJ, 123, 753
- Maund & Smartt (2009) Maund J., Smartt S., 2009, Sci, 324, 486
- Maund et al. (2004) Maund J., Smartt S., Kudritzki R., Podsiadlowski P., Gilmore G., 2004, Nature, 427, 129
- Maurer et al. (2010a) Maurer I., Mazzali P. A., Taubenberger S., Hachinger S., 2010a, MNRAS, 409, 1441
- Maurer et al. (2010b) Maurer J. I., et al., 2010b, MNRAS, 402, 161
- Mazzali et al. (2005) Mazzali P. A., et al., 2005, Sci., 308, 1284
- Mazzali et al. (2008) Mazzali P. A., et al., 2008, Sci., 321, 1185
- Mazzali et al. (2009) Mazzali P. A., Deng J., Hamuy M., Nomoto K., 2009, ApJ, 703, 1624
- Mazzali et al. (2010) Mazzali P. A., Maurer I., Valenti S., Kotak R., Hunter D., 2010, MNRAS, 408, 87
- Milisavljevic et al. (2010) Milisavljevic D., Fesen R., Gerardy C., Kirshner R., Challis P., 2010, ApJ, 709, 1343
- Mirabal et al. (2006) Mirabal N., Halpern J. P., An D., Thorstensen J. R., Terndrup D. M., 2006, ApJ, 643, L99
- Modjaz et al. (2008) Modjaz M., Kirshner R. P., Blondin S., Challis P., Matheson T., 2008, ApJ, 687, 9
- Modjaz et al. (2009) Modjaz M., et al., 2009, ApJ, 702, 226
- Mostardi et al. (2008) Mostardi R., Li W., Filippenko A. V., 2008, CBET, 1280, 1
- Nakano & Itagaki (2008) Nakano S., Itagaki K., 2008, CBET, 1286, 1
- Ohta et al. (1994) Ohta K., Maemura H., Ishigaki T., Aoki K., Ohtani H., 1994, PASJ, 46, 117
- Parrent et al. (2007) Parrent J., et al., 2007, PASP, 119, 135
- Pastorello et al. (2008) Pastorello A., et al., 2008, MNRAS, 389, 955 (P08)
- Patat et al. (1995) Patat F., Chugai N., Mazzali P., 1995, A&A, 299, 715
- Pignata et al. (2004) Pignata G., et al., 2004, MNRAS, 355, 178
- Podsiadlowski et al. (1993) Podsiadlowski Ph., Hsu J. J. L., Joss P. C., Ross R. R., 1993, Nature, 364, 509
- Qiu et al. (1999) Qiu Y., Li W., Qiao Q., Hu J., 1999, AJ, 117, 736
- Richardson et al. (2006) Richardson D., Branch D., Baron E., 2006, AJ, 131, 2233
- Richmond et al. (1996) Richmond M. W., Treffers R. R., Filippenko A. V., Paik Y., 1996, AJ, 112, 732
- Roming et al. (2009) Roming P. W. A., et al., 2009, ApJ, 704, L118 (R09)
- Schlegel et al. (1998) Schlegel D. J., Finkbeiner D. P., Davis M.,1998, 500, 525
- Schlegel & Kirshner (1989) Schlegel E., Kirshner R. P., 1989, AJ, 98, 577
- Soderberg et al. (2008) Soderberg A. M., et al., 2008, Nature, 453, 469
- Sollerman et al. (1998) Sollerman J., Leibundgut B., Spyromilio J., 1998, A&A, 337, 2007
- Sollerman et al. (2006) Sollerman J., et al., 2006, A&A, 454, 503
- Spyromilio (1991) Spyromilio J., 1991, MNRAS, 253, 25
- Spyromilio & Pinto (1991) Spyromilio J., Pinto P. A., 1991, in Danziger I. J., Kjär K., eds, Proceedings to the ESO/EIPC Workshop, Supernova 1987A and Other Supernovae. ESO, Garching, p. 423
- Stritzinger et al. (2002) Stritzinger M., et al., 2002, AJ, 124, 2100
- Stritzinger et al. (2009) Stritzinger M., et al., 2009, ApJ, 696, 713
- Tanaka et al. (2009a) Tanaka M., et al., 2009a, ApJ, 692, 1131
- Tanaka et al. (2009b) Tanaka M., et al., 2009b, ApJ, 700, 1680
- Taubenberger et al. (2006) Taubenberger S., et al., 2006, MNRAS, 371, 1459
- Taubenberger et al. (2008) Taubenberger S., Elias-Rosa N., Harutyunyan A., Navasardyan H., Benetti S., 2008, CBET, 1309, 1
- Taubenberger et al. (2009) Taubenberger S., et al., 2009, MNRAS, 397, 677
- Taubenberger et al. (2010) Taubenberger S., et al., 2010, MNRAS accepted (arXiv:1011.5665)
- Tsvetkov et al. (2009) Tsvetkov D. Y., Volkov I. M., Baklanov P. V., Blinnikov S. I., Tuchin O., 2009, Peremennye Zvezdy, vol.29, no. 2, arXiv:0910.4242 (Ts09)
- Turatto et al. (2003) Turatto M., Benetti S., Cappellaro E., 2003, in Hillebrandt W., Leibundgut B., eds, Proceedings to the ESO/MPA/MPE Workshop, From Twilight to Highlight: The Physics of Supernovae. Springer, Berlin, p. 200
- Utrobin (2007) Utrobin V. P., 2007, in Immler S., Weiler K., McCray R., eds, Conference Proceedings, Supernova 1987A: 20 Years After: Supernovae and Gamma-Ray Bursters. American Institute of Physics Conference Series, 937, 25
- Valenti et al. (2008) Valenti S., et al., 2008, ApJ, 673, L155
- van Driel et al. (1993) van Driel W., et al., 1993, PASJ, 45, L59
- Wesley et al. (2008) Wesley K., Baron E., Branch D., 2008, ApJ, 674, 371
- Young et al. (1995) Young T. R., Baron E., Branch D., 1995, ApJ, 449, 51
- Zampieri et al. (2003) Zampieri L., et al., 2003, MNRAS, 338, 711
- Zampieri (2007) Zampieri L., 2007, AIP Conference Proceedings, 924, 358
Appendix A Tables
| Star | ||||||||
|---|---|---|---|---|---|---|---|---|
| 1 | ||||||||
| 2 | ||||||||
| 3 | ||||||||
| 4 | ||||||||
| 5 | ||||||||
| 6 | ||||||||
| 7 | ||||||||
| 8 |
| Date | JD | Phase191919Phase in days with respect to the explosion date (JD = ). -band maximum light occurred on day 18.3. | Instr.202020CAFOS = Calar Alto 2.2m Telescope + CAFOS; DOLORES = 3.58m Telescopio Nazionale Galileo + DOLORES; AFOSC = Asiago 1.82m Copernico Telescope + AFOSC. | |||||
|---|---|---|---|---|---|---|---|---|
| (days) | ||||||||
| 08/03/08 | 533.59 | 4.8 | 212121Constant extrapolation. | CAFOS | ||||
| 12/03/08 | 537.53 | 8.7 | AFOSC | |||||
| 14/03/08 | 539.76 | 10.9 | DOLORES | |||||
| 16/03/08 | 542.41 | 13.6 | CAFOS | |||||
| 28/03/08 | 554.47 | 25.7 | AFOSC | |||||
| 30/03/08 | 556.44 | 27.6 | AFOSC | |||||
| 03/04/08 | 559.50 | 30.7 | AFOSC | |||||
| 04/04/08 | 560.61 | 31.8 | CAFOS | |||||
| 05/04/08 | 561.56 | 32.8 | CAFOS | |||||
| 12/04/08 | 569.35 | 40.6 | CAFOS | |||||
| 15/04/08 | 571.75 | 42.9 | DOLORES | |||||
| 25/04/08 | 582.35 | 53.6 | CAFOS | |||||
| 01/05/08 | 588.47 | 59.7 | CAFOS | |||||
| 02/05/08 | 589.38 | 60.6 | AFOSC | |||||
| 10/05/08 | 597.39 | 68.6 | DOLORES | |||||
| 11/06/08 | 629.48 | 100.7 | DOLORES | |||||
| 27/06/08 | 645.37 | 116.6 | CAFOS | |||||
| 05/07/08 | 653.41 | 124.6 | CAFOS | |||||
| 24/07/08 | 672.39 | 143.6 | AFOSC | |||||
| 24/11/08 | 794.69 | 265.9 | DOLORES | |||||
| 22/12/08 | 822.76 | 294.0 | DOLORES | |||||
| 19/02/09 | 881.54 | 352.7 | CAFOS |