An optical spectroscopic survey of the 3CR sample of radio galaxies with z 0.3.
From an optical spectroscopic survey of 3CR radio galaxies with , we discovered a new spectroscopic class of powerful radio-loud AGN. The defining characteristics of these galaxies are that compared with radio galaxies of similar radio luminosity they have: a /H ratio of 0.5, indicative of an extremely low level of gas excitation; a large deficit of emission and radio core power. We interpret these objects as relic AGN, i.e. sources that experienced a large drop in their level of nuclear activity, causing a decrease in their nuclear and line luminosity. This class opens a novel approach to investigating lifetimes and duty cycles of AGN.
Key Words.:
galaxies: active, galaxies: jets, galaxies: elliptical and lenticular, cD1 Introduction
Optical spectroscopy has played a major role in enhancing our understanding of active galactic nuclei (AGN). Heckman (1980) and Baldwin et al. (1981) demonstrated that optical lines can be used as tools to classify in general emission-line objects, particularly AGN. Diagnostic diagrams comparing emission line ratios can distinguish H II regions from gas clouds ionized by nuclear activity (Veilleux & Osterbrock, 1987). Moreover, AGN can be separated into Seyferts and Low Ionization Nuclear Emission-line Regions (LINERs, Heckman, 1980) since they form separate branches in the diagnostic diagrams (Kewley et al., 2006).
We performed an optical spectroscopic survey of the 113 radio galaxies (RG) belonging to the 3CR sample and with 0.3 (Spinrad et al., 1985), using the Telescopio Nazionale Galileo (Buttiglione et al., 2009, 2010b). Most RGs belong to two main spectroscopic classes, those of high and low excitation galaxies (HEG and LEG respectively, originally introduced by Laing et al. 1994, the analogous to Seyfert and LINER for radio-loud AGN). In Buttiglione et al. (2010a), we also reported the discovery of a new class, characterized by an extremely low level of gas excitation whose properties are discussed in this Letter.
We adopt the following cosmological parameters: km s-1 Mpc-1, , and .
2 A new spectroscopic class: ‘Relic’ radio galaxies
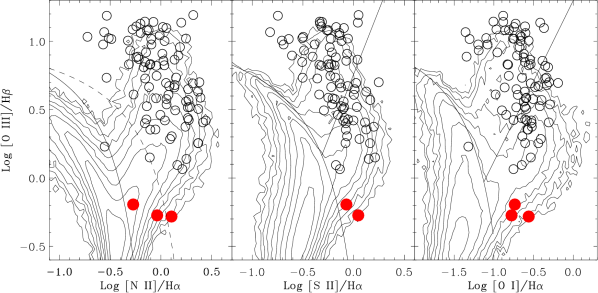
Fig. 1 shows the location of the 3CR sources in the emission-line diagnostic diagrams. They all fall in the area populated by AGN, with only one exception represented by an object with emission line ratios typical of star-forming galaxies. Their /H ratios are in the range 1.3 - 16.
Three galaxies (namely 3C 028, 3C 314.1, and 3C 348, shown in Fig. 2 as example111Since the [S II] doublet is not covered by our spectrum, 3C 348 is not represented in the central panel of Fig. 1, where, for the same reason, the star-forming galaxy discussed above is also missing.) stand out for a lower ratio, /H 0.5. For this reason, in Buttiglione et al. (2010a) we refer to this class as ‘extremely low excitation galaxies’ (ELEG). They are well separated from the rest of the 3CR sample and fall in a region scarcely populated by Sloan Digital Sky Survey (SDSS, Kewley et al. 2006) emission-line sources. Considering first their [S II]/H and [O I]/H ratios, they are located in the region of the diagnostic diagram occupied by AGN. In the /H versus [N II]/H plane, they straddle the boundary separating AGN from composite galaxies, which are possibly objects with a contribution from young stars and AGN to the emission lines.
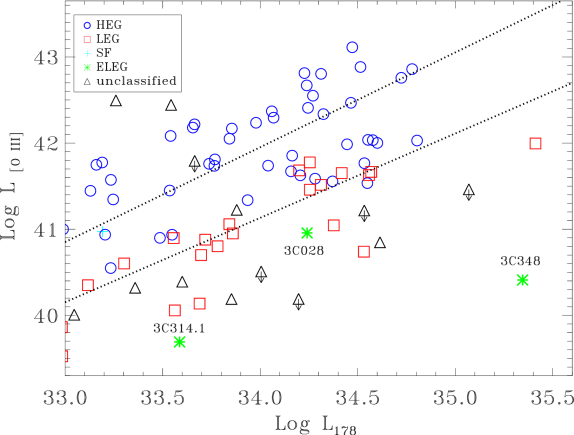
The ELEG are also distinctive because of their radio properties (see Table. 1): 3C 028 and 3C 314.1 do not appear to contain a radio-core at the level of 0.2 and 1.0 mJy respectively (see Giovannini et al. 1988 and references therein), while a 10 mJy radio core is detected in 3C 348 (Morganti et al., 1993). The ratio of core (at 5 GHz) to total (at 178 MHz) radio emission for these sources is in the range Fcore/F, compared to an average ratio of for RGs of similar luminosity. They also have a line luminosity that is 10 to 1000 times lower than RG of similar radio power (see Fig. 3).222As noted above, two ELEG lie in Fig. 1 among the composite galaxies, generally thought to be objects with a mixed contribution from young stars and AGN to the emission lines. However, if this were the case for the ELEG, they should exhibit a line excess with respect to RG of similar radio luminosity, in contrast to what is observed.
| Name | z | L | Lcore | L178 |
|---|---|---|---|---|
| 3C 028 | 0.195 | 40.96 | 29.33 | 34.24 |
| 3C 314.1 | 0.120 | 39.69 | 29.56 | 33.59 |
| 3C 348 | 0.154 | 40.41 | 30.80 | 35.35 |
On the basis of these findings, we interpret these objects as relic AGN in which the nuclear activity is currently switched-off (or substantially weaker than its long-term average level). The quantities considered (radio-core, emission-line luminosity and ratios, and total radio emission) respond to changes in the AGN activity level on different timescales. This is because they are produced on scales of sub-parsec for the radio-core, to kpc for the line emission produced in the narrow line region (NLR), to hundreds of kpc for the extended radio-emission. A drop in the activity level is rapidly followed by a decrease in both the radio core flux and the flux of ionizing photons. This in turn causes the cooling of the NLR, leading to a relative low level of 5007 emission and a decrease in the /H ratio, as described in more detail in the next section. In contrast, the luminosity of the extended radio emission remains essentially unchanged over very long timescales, accounting for the observed properties of ELEG.
3 Spectroscopic time evolution of relic RG
Binette & Robinson (1987) investigated the time evolution of the properties of a photoionized cloud following a sharp decrease in the strength of the ionizing photon field. They considered a plane-parallel cloud, in the low density limit, and an instantaneous drop in the intensity of the nuclear emission by a factor of 100. Their analysis found a very rapid quenching of the line. This is due to the high efficiency of the charge exchange reaction, O + H 0 O + H, which proceeds rapidly as soon as the gas begins to recombine and the fraction of neutral hydrogen increases. They estimated that the decay time of the (the time after which the line intensity has decreased by a factor 1/) is years, where is the electronic density. Since the decay time of the H line is substantially longer, years, the /H ratio decreases with time. Starting from an initial value of /H15, after years the ratio has decreased to 0.5 (the value observed in ELEG).
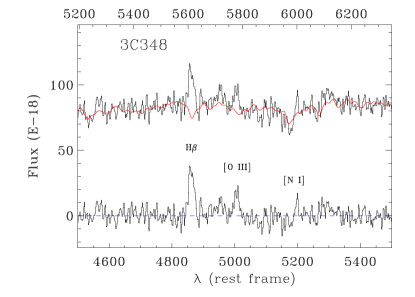
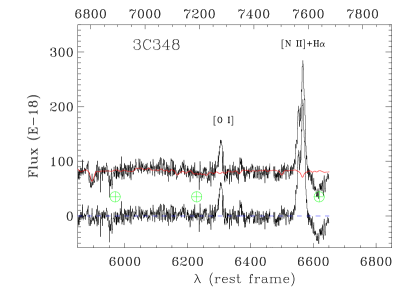
All relevant timescales depend on density. The density tracers corresponding to the brightest emission lines are the [O II]3726,3729 and [S II]6716,6731 doublets. The individual measurement of the [O II] lines is irreparably compromised by the intrinsic line widths in the NLR, leaving one only with the possibility of exploiting the [S II] doublet alone. Unfortunately, from our spectra we cannot obtain an accurate estimate of this parameter. We have no measurements of the [S II] for 3C 348 (not covered by the TNG data, see the right panel in Fig. 2), while in our spectrum of 3C 028 the [S II]6731 line falls in a CCD defect. Only for 3C 314.1 are we able to measure a ratio [S II]6716/[S II]6731 = 1.6 0.3, which is indicative only of a low density ( cm-3) regime (Osterbrock, 1989).
An additional factor to consider in the temporal evolution is the light travel time from the nucleus to the NLR clouds. The light travel time from the nucleus to the edge of the 2 slit is years. This must be considered as an upper limit to the response of the portion of the NLR probed by our observations to a change in the nuclear flux since emission lines of RG are usually highly concentrated around the nucleus (e.g. Tremblay et al., 2009). Nonetheless, considering the uncertainties related to the actual distribution and density of ionized gas, it can be envisaged that the light travel effects might play a key role in the evolution of the observable properties of the NLR.
4 Discussion and conclusions
The energy carried by the jets of radio-loud AGN has a profound impact on the evolution of their hosts and the energy balance of the intracluster medium (e.g. Fabian et al. 2003; Croton et al. 2006). To ascertain the effects of AGN feedback, it is necessary to measure not only the jet power, but also the timescales and frequency of the energy release, i.e. measure AGN lifetimes and duty cycles. Several approaches, based purely on radio properties, have been used previously (e.g. Alexander & Leahy 1987; Shabala et al. 2008; Bird et al. 2008) to investigate these issues. These analyses have led to evidence (Giovannini et al., 1988; Parma et al., 2007) of relic (fossil) RG based on the low core dominance or very steep spectral indices (a manifestation of the energy losses of the radio-emitting relativistic electrons) of some systems. Using radio observations it is possible to derive model-dependent estimates of the RG lifetimes or, in case of fossil RG, the time elapsed since the ‘death’ of the active nucleus, .
Relic RGs, distinguished by their optical spectroscopic properties, open a new and complementary path to exploring the lifetime and duty cycles of radio galaxies. The fraction of relics in the RG population is given by the ratio of the duration of the relic phase to the RG lifetime. In principle, both parameters can be derived once all RG in a complete sample are spectroscopically classified, a situation that is (almost) met by our 3CR spectroscopic survey.
Considering the range of extended luminosity where relic RG are observed, Log L , there are 83 objects in the 3CR with , three of which are relics, one has a star-forming-like spectrum, 46 are HEG, and 20 are LEG. This leads to the fraction of relics being 3/83. This fraction can increase substantially depending on the nature of the 13 objects in the sample that could not be classified spectroscopically. In particular, as explained in more detail below, some of them can be considered as ‘candidate relics’. A second, less important, uncertainty in the relic fraction would also exist if HEG only can evolve into relic systems.
The duration of the relic phase could in principle be estimated using the spectroscopic evolution, by comparing the temporal changes in line ratios with those predicted by photoionization models. Furthermore, the intensity of the various lines can be compared with those of RG of similar extended luminosity, i.e. with the relic progenitors. This approach requires a direct measurement of the NLR density, the parameter that drives its temporal evolution. Unfortunately, the density in the relic galaxies is essentially unconstrained by our observations as we are unable to measure the [S II] doublet ratio in two of the ELEG, and it is poorly constrained for 3C 314.1. However, future measurements should be easily attainable with dedicated observations as the intensity of the [S II] doublet is similar to that of the H line, whose flux was accurately measured in our spectra.
Although the extended radio emission is, in this context, the structure responding on the longer timescale to the changes in the nuclear properties, the radio morphology of the three relics can provide useful insights into their evolution. All of them can be classified as FR II following the original definition of Fanaroff & Riley (1974), but they differ when examined in more detail:
– 3C 028 has well-defined twin jets linking the host to a double-lobed structure, with well-defined hot spots, but lacks a radio core (Feretti et al., 1984). There is no apparent brightness discontinuity in the jets on either side of the host, an indication that the drop in nuclear activity occurred recently.
– 3C 314.1 has a structure known as a “fat double” as it lacks jets and hot spots (Leahy & Perley, 1991). This is an indication that the switching-off of the jets of this galaxy occurred at least years ago, based on the light travel time to the edge of the radio source 250 kpc from the nucleus.
– 3C 348 is considered to be a “born again” RG based on its peculiar radio morphology (Gizani & Leahy, 2003): two jets emerge from the core and propagate within a relaxed double-lobed, steep-spectrum structure. On the basis of the size of the inner radio structure embedded in the FR II fossil ( 200 kpc), the relic phase started at least years ago. Despite the presence of a restarted AGN, the relic line emission appears to be still the dominant component observed in this galaxy; this implies that the current phase must be associated with a significantly lower level of nuclear luminosity than the earlier phase of activity.
Evidence of the different evolutionary stages in the three sources is supported by comparing their luminosity with respect to HEG of similar radio luminosity (see Fig. 3): for 3C 028 this is lower by only a factor of 10, while 3C 314.1 and 3C 348 exhibit much larger deficits (a factor of 102 - 103) .
An independent estimate of the relic phase duration, , can be obtained by directly spatially mapping the change in state of the AGN using deeper optical spectroscopy of the off-nuclear emission line regions (e.g. Robinson et al. 1987). Owing to light travel effects, information about the drop in the nuclear emission might not have reached these outer regions. In a sort of reversed light-echo effect, the regions located at radii would still show the original high excitation state, characterized by a ratio /H times higher than in the nuclear regions. In practice, geometrical effects affect the estimate of , since the isochrones are paraboloids centered on the nucleus and the derived timescale depends on the orientation of the gas cloud with respect to the line of sight. This degeneracy can be broken when emission lines are detected on both sides of the nucleus.
Finally, we consider in more detail the 13 spectroscopically unclassified sources (usually because the and/or the H lines are too faint to be measured). Not all of them should be considered as potential additional relics since the uncertain classification is caused by a variety of factors333 For example, 3C 111 and 3C 445 are broad line RG, not classified because their broad Balmer lines hides completely the narrow components; 3C 132 is seen through a region of very high galactic absorption (); in 3C 346 the H line coincides with a telluric band.. However, relative to RG of similar total radio luminosity nine unclassified sources also have a relatively low luminosity (see Fig. 3) and we therefore consider them to be plausible ‘candidate relics’. The importance of these objects is two-fold: first of all, only after a proper spectroscopic validation will it be possible to derive the ratio of the number of relic to active galaxies, and consequently the relative duration of the two phases; secondly, it is possible that these sources might be in a different evolutionary stage than the three relic galaxies discussed here. A clearer characterization of the class of relic RG would require a study of these objects in greater detail from both the radio and spectroscopic point of view.
Relics AGN are also likely to exist among radio-quiet objects; for example, NGC 5252, with its high-excitation extended NLR surrounding a nuclear region with a LINER spectrum, is a likely relic QSO (Goncalves et al., 1998; Capetti et al., 2005). In the region of the spectroscopic diagrams typical of the 3CR relics there is indeed a substantial number of SDSS emission-line galaxies (see Fig. 1). However, the lack of radio diagnostics makes it identify genuine relics among the broad distribution of radio-quiet AGN in the diagnostic planes. Furthermore, relics are likely to be rare in a flux-limited sample of emission line galaxies, particularly when their definition requires the detection of the short-lived line. As an alternative, one could rely on non-classical diagnostic diagrams, including lines originating from high excitation gas unaffected by the charge exchange reaction (e.g. HeII4686) that causes the extremely short-decay time for the [O III] line. The temporal evolution within these same diagnostic diagrams can provide us with an estimate of the relic age. However, the likelihood of observing these effects will in general depend on both the gas density and (through light travel times) the size of the emitting region. In principle, extrapolating backward in time it will be possible to associate these sources with their active counterparts at the correct level of luminosity and thus estimate their lifetimes.
References
- Alexander & Leahy (1987) Alexander, P. & Leahy, J. P. 1987, MNRAS, 225, 1
- Baldwin et al. (1981) Baldwin, J. A., Phillips, M. M., & Terlevich, R. 1981, PASP, 93, 5
- Binette & Robinson (1987) Binette, L. & Robinson, A. 1987, A&A, 177, 11
- Bird et al. (2008) Bird, J., Martini, P., & Kaiser, C. 2008, ApJ, 676, 147
- Buttiglione et al. (2009) Buttiglione, S., Capetti, A., Celotti, A., et al. 2009, A&A, 495, 1033
- Buttiglione et al. (2010a) Buttiglione, S., Capetti, A., Celotti, A., et al. 2010, A&A, 509, A6
- Buttiglione et al. (2010b) Buttiglione, S., Capetti, A., Celotti, A., et al. 2011, A&A, 525, A28
- Capetti et al. (2005) Capetti, A., Marconi, A., Macchetto, D., & Axon, D. 2005, A&A, 431, 465
- Croton et al. (2006) Croton, D. J., Springel, V., White, S. D. M., et al. 2006, MNRAS, 365, 11
- Fabian et al. (2003) Fabian, A. C., Sanders, J. S., Allen, S. W., et al. 2003, MNRAS, 344, L43
- Fanaroff & Riley (1974) Fanaroff, B. L. & Riley, J. M. 1974, MNRAS, 167, 31P
- Feretti et al. (1984) Feretti, L., Gioia, I. M., Giovannini, G., Gregorini, L., & Padrielli, L. 1984, A&A, 139, 50
- Giovannini et al. (1988) Giovannini, G., Feretti, L., Gregorini, L., & Parma, P. 1988, A&A, 199, 73
- Gizani & Leahy (2003) Gizani, N. A. B. & Leahy, J. P. 2003, MNRAS, 342, 399
- Goncalves et al. (1998) Goncalves, A. C., Veron, P., & Veron-Cetty, M. 1998, A&A, 333, 877
- Heckman (1980) Heckman, T. M. 1980, A&A, 87, 152
- Kewley et al. (2006) Kewley, L. J., Groves, B., Kauffmann, G., & Heckman, T. 2006, MNRAS, 372, 961
- Laing et al. (1994) Laing, R. A., Jenkins, C. R., Wall, J. V., & Unger, S. W. 1994, in Astronomical Society of the Pacific Conference Series, Vol. 54, The Physics of Active Galaxies, ed. G. V. Bicknell, M. A. Dopita, & P. J. Quinn, 201
- Leahy & Perley (1991) Leahy, J. P. & Perley, R. A. 1991, AJ, 102, 537
- Morganti et al. (1993) Morganti, R., Killeen, N. E. B., & Tadhunter, C. N. 1993, MNRAS, 263, 1023
- Osterbrock (1989) Osterbrock, D. E. 1989, Astrophysics of Gaseous Nebulae and Active Galactic Nuclei (Mill Valley: Univ. Sci. Books)
- Parma et al. (2007) Parma, P., Murgia, M., de Ruiter, H. R., et al. 2007, A&A, 470, 875
- Robinson et al. (1987) Robinson, A., Binette, L., Fosbury, R. A. E., & Tadhunter, C. N. 1987, MNRAS, 227, 97
- Shabala et al. (2008) Shabala, S. S., Ash, S., Alexander, P., & Riley, J. M. 2008, MNRAS, 388, 625
- Spinrad et al. (1985) Spinrad, H., Marr, J., Aguilar, L., & Djorgovski, S. 1985, PASP, 97, 932
- Tremblay et al. (2009) Tremblay, G. R., Chiaberge, M., Sparks, W. B., et al. 2009, ApJS, 183, 278
- Veilleux & Osterbrock (1987) Veilleux, S. & Osterbrock, D. E. 1987, ApJS, 63, 295