Relation Between Globular Clusters and Supermassive Black Holes in Ellipticals as a Manifestation of the Black Hole Fundamental Plane
Abstract
We analyze the relation between the mass of the central supermassive black hole () and the number of globular clusters () in elliptical galaxies and bulges as a ramification of the black hole fundamental plane, the theoretically predicted and observed multi-variable correlation between and bulge binding energy. Although the tightness of the – correlation suggests an unlikely causal link between supermassive black holes and globular clusters, such a correspondence can exhibit small scatter even if the physical relationship is indirect. We show that the relatively small scatter of the – relation owes to the mutual residual correlation of and with stellar mass when the velocity dispersion is held fixed. Thus, present observations lend evidence for feedback-regulated models in which the bulge binding energy is most important; they do not necessarily imply any ‘special’ connection between globular clusters and . This raises the question of why traces the formation of ellipticals and bulges sufficiently well to be correlated with binding energy.
Subject headings:
black hole physics—galaxies: evolution—galaxies: formation—galaxies: elliptical and lenticular, cD1. Introduction
There are now well-established correlations between the mass of supermassive black holes (SMBHs) and properties of their host galaxies, such as bulge luminosity, mass, light concentration, and velocity dispersion (Kormendy & Richstone 1995; Magorrian et al. 1998; Ferrarese & Merritt 2000; Gebhardt et al. 2000; Tremaine et al. 2002; Marconi & Hunt 2003; Gültekin et al. 2009). This suggests that the physical mechanism driving growth of the SMBH also plays a key role in forming the bulge (for spiral galaxies) or galaxy (for ellipticals). Analytical estimates (Silk & Rees 1998; Burkert & Silk 2001; Hopkins & Hernquist 2006), as well as numerical simulations (Di Matteo et al. 2005; Springel et al. 2005; Cox et al. 2006; Robertson et al. 2006; Croton et al. 2006; Johansson et al. 2009) with simple prescriptions for SMBH accretion have demonstrated the plausibility of this inference by matching the expected slopes of these correlations.
Regardless of the detailed feedback prescription, these models predict that SMBHs grow until reaching some critical mass, where the energy and/or momentum released by feedback expels material from the nucleus. As such, they robustly predict that the “true” correlation should be between SMBH mass and a quantity such as the binding energy or potential well depth of material in the bulge. Hopkins et al. (2007a) show that the observed correlations with different variables, and importantly their scatter and systematic deviations from the relations, can be understood as the projections of a single fundamental dependence. This relation is approximated closely by a multi-variable correlation, a black hole fundamental plane (BHFP). Aller & Richstone (2007) confirmed this in a sample of ellipticals and spiral bulges using dynamical models of bulge potentials, and Feoli & Mancini (2009) did so with simple proxies such as .
Additional correlations have been found between SMBH mass and dark matter halo mass, as well as the number of globular clusters (GC) in the host galaxy (Spitler & Forbes 2009; Burkert & Tremaine 2010; Harris & Harris 2010). In particular, Burkert & Tremaine (2010, hereafter BT10) argued that is a better predictor of than the velocity dispersion , citing a smaller intrinsic scatter and a residual correlation between and in elliptical galaxies even after accounting for the median correlation, suggesting a fundamental link between the accretion of gas by the SMBH and the formation of a galaxy’s globular cluster system. Harris & Harris (2010, hereafter HH10) extended the sample by making reasonable estimates of from the literature in galaxies with measurements.
In this letter, we illustrate that the above link can be understood as a consequence of the BHFP relation combined with a residual correlation between and the bulge’s stellar mass at fixed . Rather than suggesting a single “best” correlation between and a single galaxy parameter, the BHFP implies that the best predictor of SMBH mass is some combination thereof. For example, has a positive correlation with the bulge’s stellar mass even at fixed . Although the number of globular clusters in a particular galaxy, like , is a complex function of the galaxy’s formation history, there exists a similar positive residual correlation between and , so that the resulting – residuals (fixing ) will be positively correlated.
In §2 we describe a sample of 32 elliptical galaxies from Peng et al. (2008) with auxiliary data compiled in Hopkins et al. (2008b, and subsequent papers). In §3 we fit separately the relations – and – in these galaxies to establish the residual correlation between and . Then we combine this residual slope with knowledge of the – correlation at fixed from the BHFP, and calculate the residual correlation and scatter expected between and . We summarize and conclude in §4.
2. The Data
To determine the dependence of on at fixed , we cross-match objects compiled in Hopkins et al. (2008b) and subsequent works with the ACS Virgo Cluster Survey (VCC, Côté et al. 2004), from which Peng et al. (2008) determined globular cluster counts () and uncertainties. Following BT10, we obtained for several additional galaxies from Spitler et al. (2008).
We obtained stellar masses and uncertainties from Peng et al. (2008) and Hopkins et al. (2009a, b), who compiled photometric data from several authors (e.g. Bender et al. 1988; Rothberg & Joseph 2004; Lauer et al. 2007; Kormendy et al. 2009, and references therein). We use velocity dispersions as compiled by Hopkins et al. (2009a, b). The latter quantity is the one best-determined for nearby massive galaxies, so we assume a log-uniform uncertainty in of 0.02 dex, consistent with literature values. This approach yields 33 galaxies for which we will determine the residual correlation between and . We discard the known recent merger remnant NGC1316 because its nuclear velocity dispersion is unrelaxed and the globular cluster system is actively evolving (Schweizer 1980). The galaxy properties used to analyze this 32-galaxy sample are provided in Table 1.
In addition, we will utilize the , , and data directly from Table 1 of BT10 (compiled mostly from Gültekin et al. (2009)), and the , data from Table 1 of HH10. For the latter, we use the mean recorded values from the Hyperleda database (Paturel et al. 2003; McElroy 1995). These two sources yield 21 galaxies that serve as a combined comparison sample (Table 2) for our derived – residual correlation. We note that BT10 and HH10 use slightly different, but statistically consistent, values for where the samples overlap. The differing values of may make a larger difference in cases where multiple measurements exist; here, we follow BT10 and give half weight to each in our fits. Furthermore, different studies provide different values for the velocity dispersion of a given galaxy; for example, Hyperleda returns values 10-20 km/s smaller than the ones from BT10, and the papers by Hopkins et al. provide values that differ by 10-20 km/s. We computed the observed residual – correlation using these alternate sources of , and find that the small changes this introduces leave our conclusions completely unchanged.

3. Correlations
Both the BHFP and – relation appear to perform better than the – relation because they explain its residuals and hence have a smaller intrinsic dispersion. Rigorously, this can be restated as follows: at fixed , the residuals in correlate tightly with the residuals in and in for the BHFP.
The question then arises: does directly explain the residuals in , or could the latter be attributed to other variables already proposed? Specifically, we examine whether the observed – relation is predicted as an indirect consequence of the BHFP relation. This is motivated by the BHFP prediction that at fixed , good tracers of the bulge binding energy correlate tightly with the residuals in . (Interestingly, a similar relation was shown for the binding energies of individual Milky Way globulars by McLaughlin (2000).) An approximation to the bulge binding energy in ellipticals is a quantity like , so that at fixed , galaxies with larger will have a greater binding energy. Thus, if adequately traces at fixed , as might be natural given the observed –galaxy correlations, then the tightness of the - relation is expected.
In this work, we focus on a particular projection of the BHFP that uses the bulge binding energy as the driving parameter. However, we note that the general BHFP, and also the corresponding salient relation for GCs (e.g. Harris & van den Bergh 1981; McLaughlin 1999, and subsequent works) depends on galaxy formation history in a more complicated way (Hopkins et al. 2009c). Thus while the bulge binding energy serves adequately for our purposes, a more detailed accounting of, for example, the total baryon mass may lead to an even tighter expected correspondence.
As follows, we calculate the expected residuals in – assuming that this relation is a consequence of the BHFP and no other physics. As an expression of the BHFP correlation, we use the relation between the mass of the SMBH and bulge binding energy from Hopkins et al. (2007a),
where , and . We will denote this quantity as predicted from the other observed variables as BHFP. Then we subtract from this the logarithm of as predicted solely from –, denoted by , to obtain the BHFP-predicted residual correlation between and . We will signify this difference in logarithmic quantities as (, ):
| (1) |
This is just the statement that at fixed , .
If there exists a relation between and :
| (2) |
this will therefore result in a correlation between and :
| (3) |
To test this, we first calculate from the existing data to establish a correlation between and at fixed velocity dispersion (Figure 1), and then combine it with the BHFP to create a prediction for the – residuals. Then, in Figure 2, we compare this prediction to the observed residual correlation between and from BT10 and HH10.
Specifically, we begin by determining the observed best-fit linear correlations between and , and and . The resulting fits are shown in the top two panels of Figure 1. We undertake all fits using two methods: the -minimization methods of Tremaine et al. (2002) (hereafter, T02), and the bivariate correlated errors and intrinsic scatter (BCES) estimators of Akritas & Bershady (1996). For the former, we account for intrinsic scatter in the Y axis by adding a uniform scatter in quadrature with the measurement errors such that the reduced- value of the fit is 1. For the latter, we choose the regression line that bisects the BCES(YX) and BCES(XY) curves. Altering these choices leads to small changes in the residual values, but does not change the residual slope in a statistically significant way. One-sigma uncertainties in the fitted slopes are calculated using paired nonparametric bootstrap simulations (Babu & Rao 1993).
For each object, we then use the fitted relation to compute the expected value of () given its observed value of , and subtract it from the observed value of () to obtain (). In the lower left panel of Figure 1, as expected we see a clear positive correlation between and , indicating that at a fixed , elliptical galaxies with more globular clusters also have a larger total stellar mass. We note that the values of and calculated using BCES or -minimization on the direct correlations are the same to within 0.1 dex. Subsequent estimates of the residual slope are unaffected by this choice.
However, the two fitting methods obtain somewhat different estimates for the slope of the resulting residual correlation, , which we will use to estimate the expected – residual slope . As plotted in Figure 1, we find
and correspondingly,
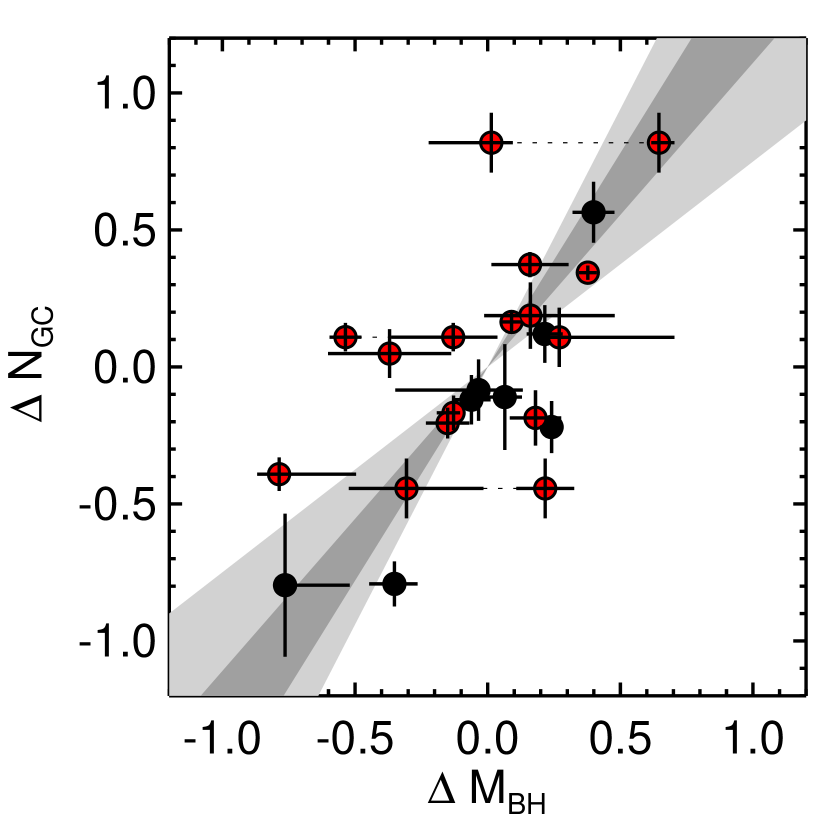
In Figure 2, we compare this predicted slope with the one observed in the comparison sample of BT10 and HH10. Again, we compute the residuals against in both and ; note that for consistency, this is slightly different than the quantities plotted in BT10’s Figure 3 where the residual was computed against the bulge luminosity, not velocity dispersion. We plot a region in light gray to highlight the extremes of the predicted slopes, corresponding to the range bounded by the 1-sigma uncertainties in the slope given by our two regression methods. In darker gray we simply plot the range bounded by our two slope estimates.
As in Figure 1, we fit the data directly and find that the observed residual slope between and is
in good agreement with the BHFP predictions above.
The detection of this residual correlation by BT10 quantitatively demonstrates that is a better predictor of than is . Such a comparison can be alternatively phrased as a reduction in the intrinsic scatter of the correlation. In BT10, the intrinsic scatter of – was found to be dex, while the intrinsic scatter in – is dex. The magnitude of this dispersion can be predicted by combining the BHFP relation with the observed correlations with . From Hopkins et al. (2007a), we see that the – correlation has an intrinsic scatter - dex, and from the present data, we find the scatter of – is dex. By propagating these as measurement uncertainties to the – relation, we predict that the measured – intrinsic scatter should be dex, consistent with the measurement by BT10. It is also consistent with the combined dataset of BT10 and HH10, for which we find dex.
4. Conclusions
We have shown that the number of globular clusters in elliptical galaxies exhibits a residual dependence on at fixed , implying that the bulge binding energy () is a better indicator of than or alone. The same was shown to be true for by Hopkins et al. (2007a), as these parameters constitute a formulation of the BHFP. Thus the apparent power of – versus – owes to the fact that and are both tracers of the same fundamental property such as the bulge binding energy.
This resolves several puzzling aspects of the previous interpretation of the data. As BT10 themselves point out, there cannot be a direct causal correlation between and , since most of the GC mass is at very large radii and has never had any interaction with the galaxy nucleus. Moreover, while most GCs likely formed at very high redshift, the final mass of the SMBH is sensitive to its growth via gas accretion at (e.g. Hopkins & Hernquist 2006; Hopkins et al. 2007c, 2008a). However, this naturally predicts that should serve reasonably well as a mass tracer, so that the dependence of on and formation time leads to a surprisingly tight but expected – correlation. The same arguments explain the result in Hopkins et al. (2009c), who show that the observed is sensitive to the entire galaxy baryonic mass – i.e. perhaps the mass traced by is the same as the mass that actually sets the escape velocity and potential well depth at , rather than just the stellar mass enclosed in a small radius around the BH, which can vary widely in systems of similar . Such a relation between and global galaxy mass or luminosity has been demonstrated (e.g. Harris & van den Bergh 1981; McLaughlin 1999), and this trait supports the idea that and are connected indirectly by a more fundamental galaxy property.
This also naturally explains why HH10 find that the relation breaks down for S0 galaxies. These galaxies are structurally different than ellipticals and may have different formation histories (Larson et al. 1980), so and the total stellar mass may not faithfully trace the bulge binding energy. Since S0’s are not particularly discrepant in – (e.g. Gültekin et al. 2009, and previous works), this suggests that the –bulge relation is the connection that weakens for these systems. HH10 also find no statistically significant correlation in spirals: although three out of the four spirals from HH10 lie on the – relation, there simply isn’t yet enough data to know for sure if this relation persists for spiral bulges. However, the underlying BHFP relation ties to the binding energy and explains its residual correlations with bulge parameters, even for these disky galaxies where possibly deviates. This alone suggests that the BHFP, not – or –, is the ‘more fundamental’ correlation.
Hopkins et al. (2007b) showed that the existence of a black hole fundamental plane is a robust prediction of numerical simulations of gas-rich mergers that include the effects of gas dissipation, cooling, star formation, and black hole accretion and feedback. The present work shows that this local and widely expected correlation between supermassive black hole mass and bulge binding energy in feedback-regulated scenarios, combined with a similar correlation for , can account for the observed – relation and its scatter. The interesting question raised by such a correlation is not why correlates tightly with , since this is indirect, but why correlates tightly with galaxy binding energy/potential well depth. Some such correlation is expected and observed (McLaughlin 1999; Blakeslee 1999; Peng et al. 2008): an example is that systems at fixed velocity dispersion with higher stellar mass have accreted or formed more stars, likely including globular clusters. But that the –bulge relation should be so tight, and include both metal-rich and metal-poor populations, may support the inferences by BT10 and HH10 (and references therein) that the formation of globular cluster systems and growth of supermassive black holes in elliptical galaxies are driven by a common galaxy property.
References
- Akritas & Bershady (1996) Akritas, M. G., & Bershady, M. A. 1996, ApJ, 470, 706
- Aller & Richstone (2007) Aller, M. C., & Richstone, D. O. 2007, ApJ, 665, 120
- Babu & Rao (1993) Babu, G. J., & Rao, C. R. 1993, Handbook of Statistics, Vol. 9 (Amsterdam: Elsevier Science), 627–659
- Babu & Singh (1983) Babu, G. J., & Singh, K. 1983, Annals of Statistics, 11, 999
- Bender et al. (1988) Bender, R., Doebereiner, S., & Moellenhoff, C. 1988, A&AS, 74, 385
- Blakeslee (1999) Blakeslee, J. P. 1999, AJ, 118, 1506
- Burkert & Silk (2001) Burkert, A., & Silk, J. 2001, ApJ, 554, L151
- Burkert & Tremaine (2010) Burkert, A., & Tremaine, S. 2010, ApJ, 720, 516
- Côté et al. (2004) Côté, P., et al. 2004, ApJS, 153, 223
- Cox et al. (2006) Cox, T. J., Dutta, S. N., Di Matteo, T., Hernquist, L., Hopkins, P. F., Robertson, B., & Springel, V. 2006, ApJ, 650, 791
- Croton et al. (2006) Croton, D. J., et al. 2006, MNRAS, 365, 11
- Di Matteo et al. (2005) Di Matteo, T., Springel, V., & Hernquist, L. 2005, Nature, 433, 604
- Feoli & Mancini (2009) Feoli, A., & Mancini, L. 2009, ApJ, 703, 1502
- Ferrarese & Merritt (2000) Ferrarese, L., & Merritt, D. 2000, ApJ, 539, L9
- Gebhardt et al. (2000) Gebhardt, K., et al. 2000, ApJ, 539, L13
- Gültekin et al. (2009) Gültekin, K., et al. 2009, ApJ, 698, 198
- Harris & Harris (2010) Harris, G. L. H., & Harris, W. E. 2010, ArXiv:1008.4748
- Harris & van den Bergh (1981) Harris, W. E., & van den Bergh, S. 1981, AJ, 86, 1627
- Hopkins et al. (2009a) Hopkins, P. F., Cox, T. J., Dutta, S. N., Hernquist, L., Kormendy, J., & Lauer, T. R. 2009a, ApJS, 181, 135
- Hopkins et al. (2008a) Hopkins, P. F., Cox, T. J., Kereš, D., & Hernquist, L. 2008a, ApJS, 175, 390
- Hopkins & Hernquist (2006) Hopkins, P. F., & Hernquist, L. 2006, ApJS, 166, 1
- Hopkins et al. (2008b) Hopkins, P. F., Hernquist, L., Cox, T. J., Dutta, S. N., & Rothberg, B. 2008b, ApJ, 679, 156
- Hopkins et al. (2007a) Hopkins, P. F., Hernquist, L., Cox, T. J., Robertson, B., & Krause, E. 2007a, ApJ, 669, 45
- Hopkins et al. (2007b) —. 2007b, ApJ, 669, 67
- Hopkins et al. (2009b) Hopkins, P. F., Lauer, T. R., Cox, T. J., Hernquist, L., & Kormendy, J. 2009b, ApJS, 181, 486
- Hopkins et al. (2009c) Hopkins, P. F., Murray, N., & Thompson, T. A. 2009c, MNRAS, 398, 303
- Hopkins et al. (2007c) Hopkins, P. F., Richards, G. T., & Hernquist, L. 2007c, ApJ, 654, 731
- Johansson et al. (2009) Johansson, P. H., Naab, T., & Burkert, A. 2009, ApJ, 690, 802
- Kormendy et al. (2009) Kormendy, J., Fisher, D. B., Cornell, M. E., & Bender, R. 2009, ApJS, 182, 216
- Kormendy & Richstone (1995) Kormendy, J., & Richstone, D. 1995, ARA&A, 33, 581
- Kundu & Whitmore (2001) Kundu, A., & Whitmore, B. C. 2001, AJ, 121, 2950
- Larson et al. (1980) Larson, R. B., Tinsley, B. M., & Caldwell, C. N. 1980, ApJ, 237, 692
- Lauer et al. (2007) Lauer, T. R., et al. 2007, ApJ, 664, 226
- Magorrian et al. (1998) Magorrian, J., et al. 1998, AJ, 115, 2285
- Marconi & Hunt (2003) Marconi, A., & Hunt, L. K. 2003, ApJ, 589, L21
- McElroy (1995) McElroy, D. B. 1995, ApJS, 100, 105
- McLaughlin (1999) McLaughlin, D. E. 1999, AJ, 117, 2398
- McLaughlin (2000) —. 2000, ApJ, 539, 618
- Paturel et al. (2003) Paturel, G., Petit, C., Prugniel, P., Theureau, G., Rousseau, J., Brouty, M., Dubois, P., & Cambrésy, L. 2003, A&A, 412, 45
- Peng et al. (2008) Peng, E. W., et al. 2008, ApJ, 681, 197
- Robertson et al. (2006) Robertson, B., Hernquist, L., Cox, T. J., Di Matteo, T., Hopkins, P. F., Martini, P., & Springel, V. 2006, ApJ, 641, 90
- Rothberg & Joseph (2004) Rothberg, B., & Joseph, R. D. 2004, AJ, 128, 2098
- Schweizer (1980) Schweizer, F. 1980, ApJ, 237, 303
- Silk & Rees (1998) Silk, J., & Rees, M. J. 1998, A&A, 331, L1
- Spitler & Forbes (2009) Spitler, L. R., & Forbes, D. A. 2009, MNRAS, 392, L1
- Spitler et al. (2008) Spitler, L. R., Forbes, D. A., Strader, J., Brodie, J. P., & Gallagher, J. S. 2008, MNRAS, 385, 361
- Springel et al. (2005) Springel, V., Di Matteo, T., & Hernquist, L. 2005, MNRAS, 361, 776
- Tremaine et al. (2002) Tremaine, S., et al. 2002, ApJ, 574, 740
| Galaxy | |||
|---|---|---|---|
| () | (km/s) | ||
| NGC0821 | 320 45aaSpitler et al. (2008) | 229 57 | 209 10 |
| NGC1399 | 5800 700aaSpitler et al. (2008) | 363 91 | 359 18 |
| NGC3377 | 266 66bbKundu & Whitmore (2001) | 26.3 6.6 | 141 7 |
| NGC3379 | 270 68aaSpitler et al. (2008) | 107 27 | 221 11 |
| NGC4318 | 18 6.1 | 5.0 1.7 | 101 5 |
| NGC4365 | 3246 598 | 226 52 | 269 13 |
| NGC4374 | 4301 1201 | 236 61 | 287 14 |
| NGC4382 | 1110 181 | 186 44 | 196 10 |
| NGC4387 | 69.5 9.8 | 13.7 3 | 84 4.2 |
| NGC4406 | 2660 129 | 289 60 | 250 12 |
| NGC4434 | 141 34 | 21.4 4 | 118 6 |
| NGC4458 | 72 12 | 8.7 2 | 85 4.3 |
| NGC4459 | 218 28 | 77.9 14 | 168 8 |
| NGC4464 | 25.3 9.2 | 7.1 1.4 | 120 6 |
| NGC4467 | -6 13 | 1.8 0.6 | 67 3.4 |
| NGC4472 | 7813 830 | 531 110 | 287 14 |
| NGC4473 | 76 97 | 53.5 12 | 178 9 |
| NGC4476 | 20.1 7.3 | 3.7 2 | 41 2.1 |
| NGC4478 | 58 11 | 22 4 | 149 7 |
| NGC4486 | 14660 891 | 302 79 | 360 18 |
| NGC4489 | 31 9 | 6.98 1.7 | 49 2.4 |
| NGC4515 | 81 10 | 7.7 1.5 | 90 4.5 |
| NGC4551 | 47 11 | 11.6 2.4 | 100 5 |
| NGC4552 | 984 198 | 95 16.9 | 261 13 |
| NGC4564 | 213 31 | 26 6 | 153 8 |
| NGC4621 | 803 355 | 83.9 19 | 237 12 |
| NGC4649 | 4745 1099 | 339 50 | 341 17 |
| NGC4660 | 205 28 | 23.8 4 | 191 9 |
| VCC1199 | -9 14 | 0.58 0.16 | 69 3.5 |
| VCC1440 | 26.7 6.8 | 1.2 0.44 | 59 3 |
| VCC1627 | 3.6 3.7 | 1.0 0.32 | 47 2.4 |
| VCC1871 | 10.4 5 | 2.3 0.58 | 51 2.6 |
Note. — Properties of elliptical galaxies used to determine the correlation of with at fixed velocity dispersion (Figure 1). Values of and are compiled from Peng et al. (2008) unless otherwise noted. Values of are compiled from Hopkins et al. (2009a, b) and assumed to have a log-uniform uncertainty of 0.02 dex.
| Galaxy | +1-sigma | -1-sigma | |||||
|---|---|---|---|---|---|---|---|
| () | () | () | (km/s) | ||||
| Burkert & Tremaine (2010) | |||||||
| NGC0821 | 320 45 | 209 10 | -0.39 | -0.79 | |||
| NGC1316 | 1173 240 | 226 9 | 0.05 | -0.37 | |||
| NGC1399 | 5800 700 | 337 16 | 0.11 | -0.13 | |||
| 0.11 | -0.54 | ||||||
| NGC3377 | 266 66 | 145 7 | 0.11 | 0.27 | |||
| NGC3379 | 270 68 | 206 10 | -0.44 | -0.31 | |||
| -0.44 | 0.22 | ||||||
| NGC4374 | 4301 1201 | 296 14 | 0.19 | 0.16 | |||
| NGC4459 | 218 28 | 167 8 | -0.20 | -0.15 | |||
| NGC4472 | 7813 830 | 310 10 | 0.37 | 0.16 | |||
| NGC4486 | 14660 891 | 375 18 | 0.34 | 0.38 | |||
| NGC4564 | 213 31 | 162 8 | -0.17 | -0.13 | |||
| NGC4594 | 1900 189 | 240 12 | 0.16 | 0.09 | |||
| NGC4649 | 4745 1099 | 385 19 | -0.19 | 0.18 | |||
| NGC5128 | 1550 390 | 150 7 | 0.82 | 0.65 | |||
| 0.82 | 0.01 | ||||||
| Harris & Harris (2010) | |||||||
| NGC2778 | 50 30 | 162 8 | -0.80 | -0.76 | |||
| NGC4261 | 530 100 | 309 14 | -0.79 | -0.35 | |||
| NGC4473 | 376 97 | 180 8 | -0.08 | -0.03 | |||
| NGC4552 | 1200 250 | 253 12 | -0.12 | -0.06 | |||
| NGC4621 | 800 355 | 225 11 | -0.11 | -0.06 | |||
| NGC4697 | 229 50 | 171 8 | -0.22 | 0.24 | |||
| NGC5813 | 1650 400 | 237 11 | 0.12 | 0.22 | |||
| NGC5846 | 4700 1200 | 239 11 | 0.56 | 0.40 | |||
Note. — Properties of elliptical galaxies used to calculate the correlation of with at fixed velocity dispersion (Figure 2), following BT10. Data for and are compiled from BT10 and HH10. Values of are as presented in BT10 for those galaxies, and values of for the HH10 ellipticals are taken as the mean value recorded in the HyperLeda database (Paturel et al. 2003; McElroy 1995).