Peculiar Type II Supernovae from Blue Supergiants
Abstract
The vast majority of Type II supernovae (SNe) are produced by red supergiants (RSGs), but SN 1987A revealed that blue supergiants (BSGs) can produce members of this class as well, albeit with some peculiar properties. This best studied event revolutionised our understanding of SNe, and linking it to the bulk of Type II events is essential. We present here optical photometry and spectroscopy gathered for SN 2000cb, which is clearly not a standard Type II SN and yet is not a SN 1987A analog. The light curve of SN 2000cb is reminiscent of that of SN 1987A in shape, with a slow rise to a late optical peak, but on substantially different time scales. Spectroscopically, SN 2000cb resembles a normal SN II, but with ejecta velocities that far exceed those measured for SN 1987A or normal SNe II, above 18,000 km s-1 for H at early times. The red colours, high velocities, late photometric peak, and our modeling of this object all point toward a scenario involving the high-energy explosion of a small-radius star, most likely a BSG, producing 0.1 of 56Ni. Adding a similar object to the sample, SN 2005ci, we derive a rate of % of the core-collapse rate for this loosely defined class of BSG explosions.
1 Introduction
Massive stars that retain their hydrogen envelope during their evolution end their lives as Type II supernovae (SNe II). The vast majority of these are characterised by a fast (few days) rise to a flat light curve, most pronounced in the reddest optical bands, with a duration of 80–100 d. This “plateau” phase, for which they have been named SNe II-P, is interpreted as the recession of the photosphere as the ejecta expand and cool (e.g., Kirshner et al., 1973; Barbon et al., 1979). The spectra of SNe II-P are typically dominated by strong P-Cygni profiles of hydrogen lines, as well as iron absorption features (e.g., see the review by Filippenko, 1997).
Due to the relatively simple physics driving their optical evolution, SNe II-P were the first SNe to be suggested as distance indicators, via the so-called expanding photosphere method (EPM; Kirshner & Kwan 1974). While this method and its descendants depend on modeling, Hamuy & Pinto (2002) suggested an empirical relation between luminosity and ejecta velocity, as measured from iron absorption lines, that proved compelling when combined with dust-extinction correction (Nugent et al., 2006; Olivares, 2010; Poznanski et al., 2009; Poznanski et al., 2010).
Over the past decade, pre-explosion locations of SNe II-P have been directly imaged with the Hubble Space Telescope or deep ground-based images, yielding five detections of progenitor stars, all of which were red supergiants (RSGs), and many limits on stars with masses in the range 7.5–15 (Smartt et al., 2009, and references therein). These masses are somewhat at odds with those derived from explosion modeling, which tend to be higher, closer to 15–25 (e.g., Nadyozhin, 2003; Utrobin et al., 2007; Utrobin & Chugai, 2009), though Dessart et al. (2010b) push toward lower masses of less than .
SNe II-P show some diversity, but overall they tend to be a fairly homogeneous group. However, there are intriguing relatives to this class of objects, most notably SN 1987A, which exploded in the nearby Large Magellanic Cloud and whose progenitor was a compact blue supergiant (BSG) star (Arnett et al., 1989, and references therein). Given the unique contribution of SN 1987A to the study of core-collapse SNe, particular attention to objects that resemble it is warranted. The most similar published SN was SN 1998A (Pastorello et al., 2005). While its light-curve shape was nearly identical to that of SN 1987A, SN 1998A was more luminous and bluer, and its spectra showed higher expansion velocities. Pastorello et al. (2005) attribute these differences to a higher-energy BSG explosion.
SN 2000cb was discovered on 27.4 April 2000 (UT dates are used throughout this paper) by Papenkova & Li (2000) in the spiral galaxy IC 1158 at , (J2000) as part of the Lick Observatory Supernova Search (Li et al., 2000; Filippenko et al., 2001). An unfiltered image obtained with the Katzman Automatic Imaging Telescope (KAIT) on 24.4 April shows the supernova, while there is no detection to a limiting magnitude of 18.7 in an image taken on 9.5 April. The SN is at a projected distance of about 4.3 kpc from the host-galaxy centre, off one of the outer arms of this spiral galaxy. Jha et al. (2000) classified it spectroscopically as a SN II on 28.4 April and noted high expansion velocities measured from the hydrogen absorption features (up to 18300 km s-1 for H), as confirmed on 29.3 April by Aldering & Conley (2000). Some peculiarities of SN 2000cb and its similarity to SN 1987A were noted by Hamuy (2001), and as a result, both SNe were excluded from a sample of SNe II-P used as standardizable candles (Hamuy, 2004).
In this paper, we present photometric and spectroscopic data on SN 2000cb, all taken within 160 d after explosion. We investigate its properties and compare it to the prototypical Type II SN 1999em, to SN 1987A, and to SN 1998A. As we show, while SN 2000cb shares some characteristics with SNe 1987A and 1998A, it does not appear to closely match any of our comparison objects, further expanding the range of known possible outcomes of massive stellar death. Various arguments, in addition to our model fit to the bolometric evolution, point to a BSG progenitor that produced a strong explosion with a small envelope and a significant amount of 56Ni.
2 Data Acquisition and Reduction
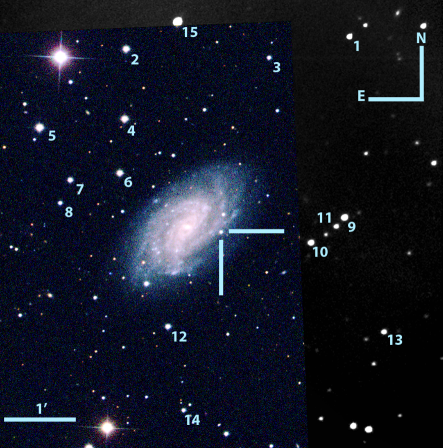
Photometric observations are given in Table 1. Data were obtained using KAIT, the robotic 0.76-m reflecting telescope at Lick Observatory, between 29.41 April and 15.14 September 2000, both in filters and as unfiltered observations that were made as part of the routine SN search. Following automatic on-site flat-fielding and bias subtraction, images were reduced using the KAIT pipeline (see Ganeshalingam et al., 2010). Galaxy subtraction was performed using template images from several months after the SN had faded beyond detection, and the DAOPHOT package in IRAF111The Image Reduction and Analysis Facility: distributed by the National Optical Astronomy Observatory, which is operated by the Association of Universities for Research in Astronomy (AURA) under cooperative agreement with the National Science Foundation. was used to perform point-spread function (PSF) fitting photometry on the SN as well as on comparison stars in the field. Figure 1 shows the SN, its host, and the comparison stars, whose magnitudes are listed in Table 2. All magnitudes are on the Vega-based system.
We correct our data for Galactic extinction of mag from Schlegel et al. (1998), using the extinction law of Cardelli et al. (1989), with a slope of . The unfiltered photometry of SNe with KAIT is usually dominated by -band light (e.g., Li et al., 2003). This appears to be a good approximation for SN 2000cb; the unfiltered data lie between the and light curves throughout most of the lifetime of the SN. We therefore correct the unfiltered data for Galactic extinction as though they were acquired with an -band filter. The distance to SN 2000cb is 30 7 Mpc (Springob et al., 2009), and its measured redshift is . We find the explosion date to be 21.5 April 2000 (JD 2,451,656) 4.1 d by extrapolating the unfiltered light curve using a cubic fit to the first five points.
Our light curve of SN 1999em was first published by Leonard et al. (2002). We adopt a total extinction value mag from spectral fitting (Baron et al., 2000) and a Cepheid distance of 11.7 1.0 Mpc (Leonard et al., 2003), with a redshift of . We assume the explosion date of 23.5 October 1999 found by Jones et al. (2009) using EPM.
The light curve of SN 1987A (Hamuy et al., 1988) is corrected for extinction using mag (Schlegel et al., 1998) and mag (Woosley et al., 1987). We adopt a distance of kpc to the Large Magellanic Cloud (Storm et al., 2004) and an explosion date of 23.316 February 1987 (Arnett et al., 1989).
Two early-time spectra of SN 2000cb, around days 7 and 9 after explosion, were obtained using the FAST spectrograph (Fabricant et al., 1998) on the 1.5 m Tillinghast telescope at the F. L. Whipple Observatory (slit width , resolution Å). Beginning about 40 d after explosion, seven additional spectra were taken with the Kast spectrograph on the Shane 3 m reflecting telescope at Lick Observatory (Miller & Stone, 1993). The first five were obtained using only the red side of the dual-arm Kast spectrograph, and the last two were taken with both sides. With a slit width of , the typical resolution (full width at half-maximum intensity) was Å on the blue side ( Å) and Å on the red side. The slit was in all cases aligned close to the parallactic angle (Filippenko, 1982) in order to minimise the effects of atmospheric dispersion. Table 3 provides a log of the spectroscopic observations.
All spectra were reduced using techniques detailed by Foley et al. (2003) and Matheson et al. (2008), among others. IRAF CCD processing was performed, and the data were sky subtracted and extracted optimally (Horne, 1986). The observations were wavelength calibrated by fitting low-order polynomials to arc-lamp spectra. Night-sky lines were cross-correlated with a template sky spectrum and small wavelength shifts were applied when appropriate. Using the spectra of standard stars, the data were then flux calibrated and corrected for telluric absorption lines (Wade & Horne, 1988; Bessell, 1999; Matheson et al., 2000). Information for the Kast data comes from our SN database (Silverman et al., in prep.).

3 Photometry
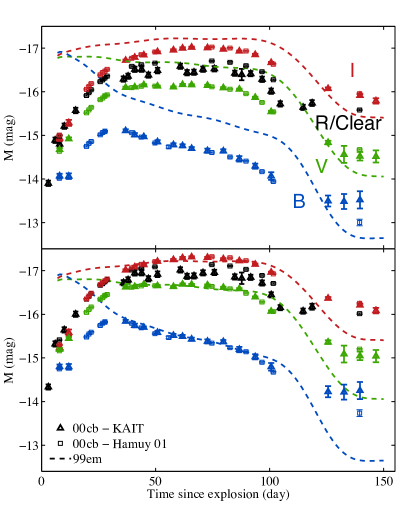
In the top panel of Figure 2, we compare the light curves of SN 2000cb and SN 1999em. SN 2000cb is fainter by 2–3 mag in each band at early times and then ascends during the first 30 d into the plateau. During the photospheric phase, SN 2000cb follows this prototypical SN II-P reasonably well until day 90, when it begins to drop off the plateau. This happens about 20 d earlier than for SN 1999em, but the decline is not as rapid. As a result, SN 2000cb is overluminous by up to mag, depending on the band, from day 110 until the latest observation at day 147. Our photometric data are listed in Table 1.
The assumption that SNe II-P have essentially the same colour evolution during the photospheric phase is one method often used to determine reddening (e.g., Leonard et al., 2002). Such a fit requires a value of mag with to be applied to SN 2000cb, as shown in the bottom panel of Figure 2. This allows us to match the light and colour curves of the two objects reasonably well during the plateau phase, roughly between days 30 and 90 after explosion. However, such a significant extinction value is inconsistent with the absence of detectable narrow Na I D absorption (see §4), and it seems unlikely considering the position of the SN near the outskirts of its host galaxy. We therefore assume throughout the rest of this paper that SN 2000cb suffered no host-galaxy extinction, though the presence of some extinction would not appreciably alter any of our conclusions.
In Figure 3, we compare the photometric evolution of SN 2000cb and SN 1987A. While the SNe show similar qualitative trends such as a slow rise time, a plateau-like phase, and a shallow dropoff (as also noted by Hamuy 2001), they clearly behave differently.
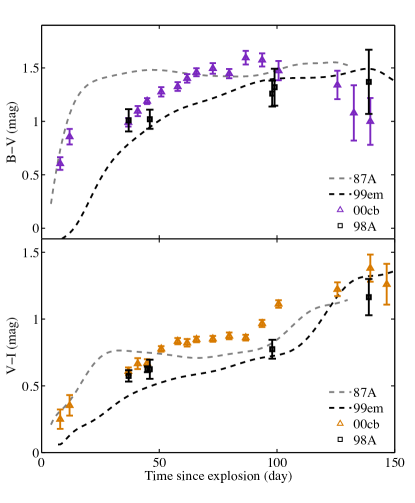
Figure 4 shows and colour curves of SN 2000cb compared with those of SNe 1999em, 1998A, and 1987A. At early times, SN 2000cb appears to follow SN 1987A, and both are redder in than SN 1999em beyond anything that could be ascribed to extinction, which indicates a lower effective temperature. In , SN 2000cb joins the bluer objects from about day 30 until day 60, when the colours of all four are comparable. Until day 100 or so, SN 2000cb is slightly redder than SNe 1999em and 1998A, but perhaps not significantly. As it falls off the plateau, SN 2000cb begins to evolve quickly toward the blue. In , SN 2000cb again tends to be redder than the three comparison SNe between days 50 and 100, but overall these objects all show broadly similar colour evolution.
4 Spectroscopy
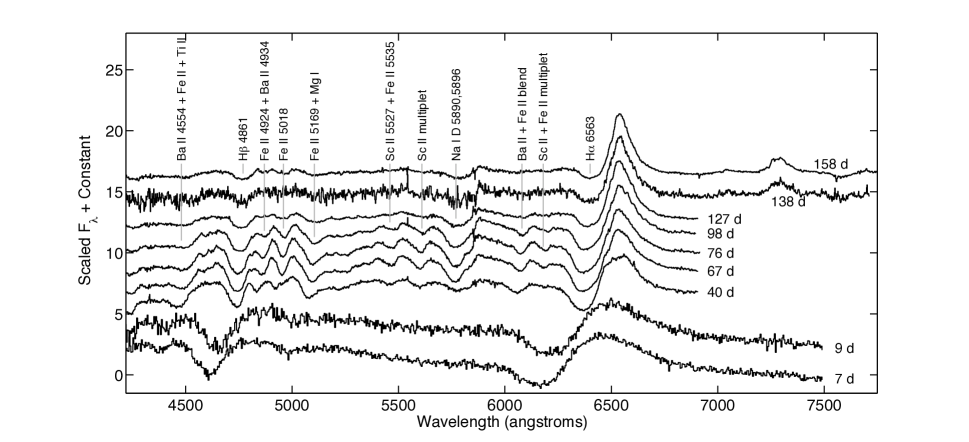
Spectra obtained between days 7 and 157 after explosion are shown in Figure 5. All exhibit features characteristic of SNe II during the photospheric phase, including strong H P-Cygni profiles as well as H absorption, Na I D 5890, 5896, Fe II 4924, 5018, 5169 (hereafter, Fe triplet), and perhaps Ba and Sc lines. A number of these absorption features are labeled in the figure based on line identifications for SN 1999em (Leonard et al., 2002) and SN 1998A (Pastorello et al., 2005).
There are indications that the equivalent width of narrow Na I D 5890, 5896 absorption correlates with the amount of dust extinction suffered by a SN, despite significant scatter (e.g., Barbon et al. 1990; Richmond et al. 1994; Turatto et al. 2003; see also Poznanski et al., in prep.). Regardless of the scatter, there seems to be a correlation between high extinction and Na I D absorption. We detect no absorption in any of the individual spectra of SN 2000cb nor in a stack of all nine spectra.
For the stack, we normalise the spectra, crop a region of 60 Å around 5893 Å, subtract a fitted line to remove any continuum contribution, and combine the spectra. The resulting average spectrum has a standard deviation of 5% in flux, and yet we do not detect any narrow Na I D absorption. For a typical resolution element of about 5 Å, we thus get a 3 limit of 0.47 Å on the equivalent width, following Equation 4 of Leonard et al. (2001); this corresponds to mag (using the relation of Barbon et al. 1990), or mag for the best-fitting value to the photometry of . Such a low is inconsistent with the value 0.2 derived by matching the photometry to SN 1999em, and it indicates that SN 2000cb most likely suffered no significant host-galaxy extinction.
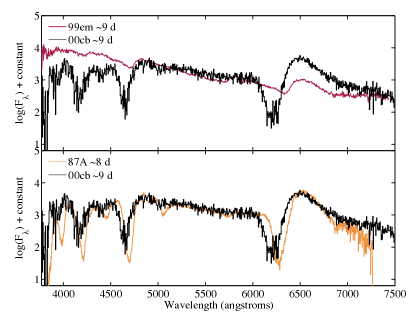
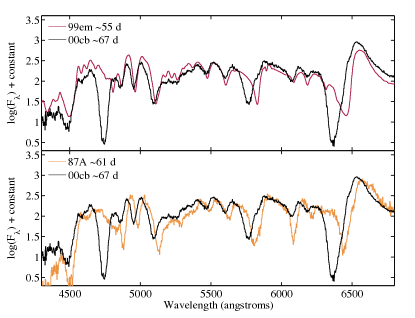
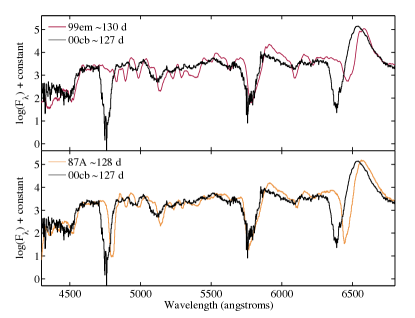
The spectra of SN 2000cb are overall very similar to those of typical SNe II, but direct comparisons to SN 1999em and SN 1987A reveal several significant differences. Figure 6 shows individual spectra of SN 2000cb plotted against spectra at similar phases for each of these objects.
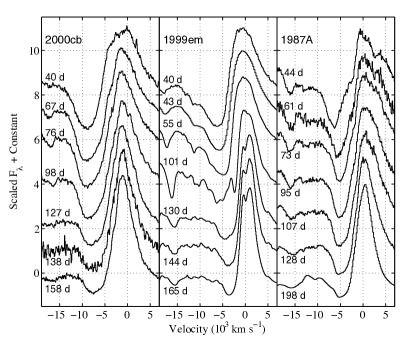
At early times, SN 2000cb closely resembles SN 1987A: their continua match well, and the strengths of the prominent hydrogen features are comparable. Both are redder than SN 1999em, which also has much weaker features. The features of SN 2000cb tend to be significantly blueshifted compared to either object throughout their evolution in our sample. Around day 67, all three objects are very similar spectroscopically, although SN 2000cb has much deeper absorption troughs for H and even more strikingly for H, which is barely discernible in the other two objects. At about day 127, SN 2000cb again matches both comparisons well; however, most of the Fe (and other metal) absorption lines are weaker. SN 2000cb still exhibits strong hydrogen compared to SN 1999em, but at this phase SN 1987A shows features of comparable depth. The equivalent widths of the hydrogen absorption lines for SN 2000cb and SN 1987A exceed those of SN 1999em by a factor of 8–10 at early times, and at later times measurements of SN 2000cb are about twice as great as those of SN 1987A, while features of SN 1999em are even weaker. We also note that the feature at about 5600 Å in SN 2000cb, identified as Na I D 5890, 5896, has a profile that differs from that of both SNe 1999em and 1987A in the day 67 comparison, but matches reasonably well at later times. This feature may be a blend with He I 5876.
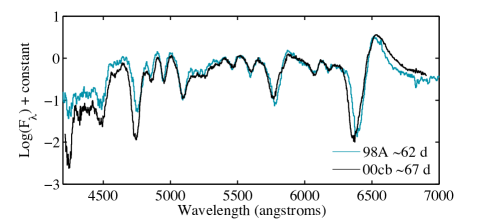
SN 1998A, identified by Pastorello et al. (2005) as a higher-energy analog of SN 1987A, is a very close spectroscopic match to SN 2000cb, as shown in Figure 7; its spectra are almost identical at all other available phases as well. The depths of the hydrogen features are comparable, while SNe 1999em and 1987A differ greatly. It is interesting to note the spectroscopic similarity between SN 2000cb and SN 1998A in spite of the fact that they are not nearly as close photometrically, the light curve of SN 1998A being nearly identical to that of SN 1987A but brighter by about 0.7 mag.
Figure 8 illustrates the evolution of the H profile beginning at d after explosion. In addition to the higher velocity and velocity dispersion of the absorption minimum, the emission peak of SN 2000cb is blueshifted significantly more than those of the other two SNe. The H emission profile also exhibits a slight excess on the blue side. This structure in the P-Cygni profile is reminiscent of the “Bochum event” observed in SN 1987A (Hanuschik & Dachs, 1987; Utrobin et al., 1995). A similar feature, tentatively attributed to the same phenomenon by Leonard et al. (2002), also appears briefly in the profile of SN 1999em, but it is not present over as much time in that object’s evolution (only at d in our spectra).
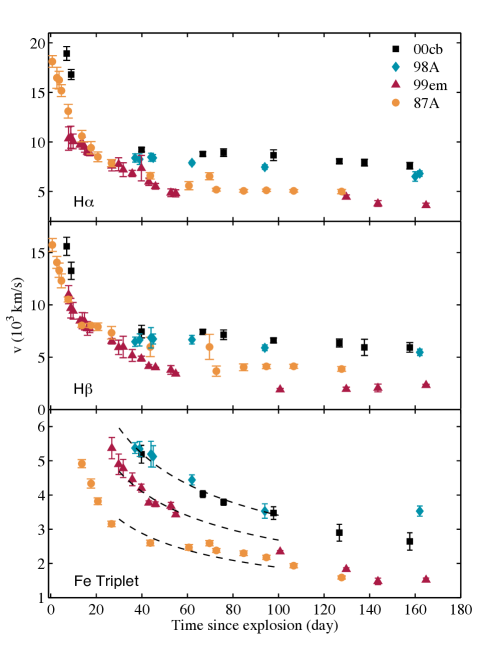
We have measured the velocities of the most prominent absorption features of all four SNe, as shown in Figure 9. The Fe triplet velocities (shown in the plot as the average of the velocities measured for Fe II 4924, 5018, 5169) of SN 2000cb and SN 1998A are similar and typically exceed those of SN 1999em by –1500 km s-1 and those of SN 1987A by –2500 km s-1. However, they appear to follow roughly the empirical relation (indicated for each object by dashed lines in the same figure) found by Nugent et al. (2006) for SNe II-P: , where is the velocity 50 d after explosion and is the velocity at some time in days. The H and H absorption velocities of SN 2000cb are more remarkable. H absorption velocities exceed 18,000 km s-1 within 10 d after explosion and remain –5000 km s-1 greater than for both SNe 1999em and 1987A. The hydrogen velocities measured for SN 1998A are almost as high, lower than those of SN 2000cb by about 500 to 1000 km s-1. Dessart & Hillier (2008) suggest that in SN 1987A-like objects, H velocities overestimate those of the photosphere by a factor of two at most phases due to non- LTE effects. SN 1987K (Filippenko, 1988) and SN 2003bg (Hamuy et al. 2009, 2009) also had very high H absorption velocities at early times. However, the spectra of these objects soon developed He I lines, leading to the “SN IIb” designation. Our spectral sequence in Figure 5 shows that SN 2000cb is not a member of this class.
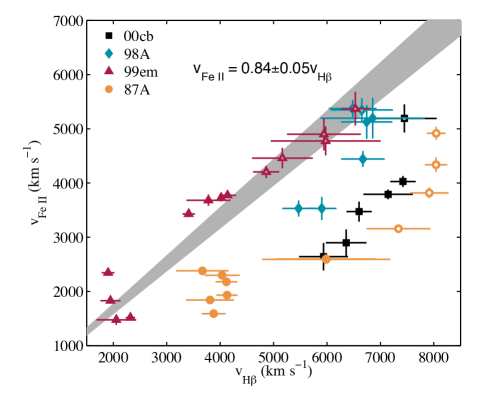
Poznanski et al. (2010) present a correlation between H and Fe II velocities for H-dominated spectra of SNe II-P: . Figure 10 shows this relation with our velocity measurements; it was derived for spectra taken between 5 and 40 d after explosion because of a tendency for H absorption to become weak and blend with metal lines at later times. Our sample of SN 2000cb contains only one usable spectrum within this timeframe (from day 40), but it is informative to examine the ratio of Fe and H velocities at a wider range of epochs in the context of this correlation. SN 1999em unsurprisingly follows this relation, as it was one of the SNe used to constrain it, especially at earlier times (and therefore at higher velocities). SN 2000cb and SN 1987A are clear outliers, while SN 1998A deviates in a similar way but to a lesser extent.
5 Bolometric properties and model fit
The first question posed by SN 2000cb is whether its light curve was powered primarily by the energy deposited in the initial explosion (as in typical SNe II-P) or by the subsequent radioactive decay of (as in SN 1987A and stripped-envelope Type Ib/c SNe). The slow rise time strongly disfavours the former possibility. The explosion shock wave deposits thermal energy throughout the stellar envelope, including the outermost layers, and thus radiation begins escaping from the ejecta immediately after shock breakout. The peak in the -band light curve occurs not long thereafter, when the outer layers have cooled to temperatures K. Model light-curve calculations of SNe II-P find rise times of d in the band (Eastman et al., 1994; Baklanov et al., 2005; Kasen & Woosley, 2009; Dessart & Hillier, 2010a), significantly shorter than the d -band rise time of SN 2000cb. It is possible that varying the structure of the hydrogen envelope could lengthen the rise time, but detailed modeling would be needed to explore such effects. It is far more likely that the explosion energy was mostly spent on expansion from a small progenitor radius, analogously to SN 1987A.
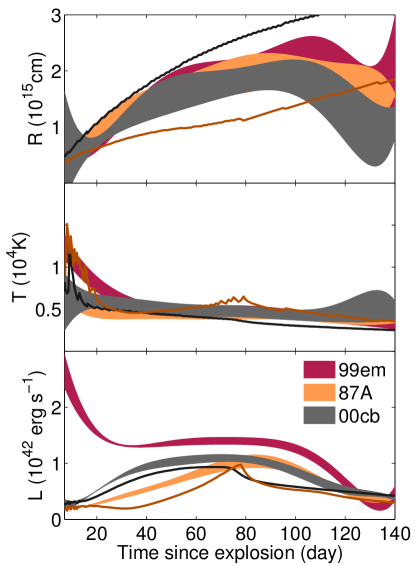
In order to derive bolometric properties, we fit a blackbody spectrum to the optical photometry of SN 2000cb, SN 1987A, and SN 1999em, with the luminosity, radius, and temperature being the free parameters. The resulting fits are shown in Figure 11. We assume that the three objects differ from perfect blackbodies to a similar extent. This may introduce a systematic uncertainty in our absolute values, but it allows for comparisons to be made between the SNe. We find for SN 2000cb a bolometric rise time of about 70 d and peak luminosity of erg s-1. Our derived values for SN 1987A and SN 1999em are generally consistent with previous estimates. While all three SNe have similar radii at most times, SN 1999em is clearly hotter and brighter at early times (as expected from its colours), similar to other well-studied SNe II-P (e.g., Dessart et al. 2008). SN 2000cb and SN 1987A reach a similar peak luminosity, but SN 2000cb reaches it about 20 d earlier.
These long rise times are readily explained by a radioactive energy source, as is typically concentrated toward the centre of the ejecta and radiation needs time to diffuse to the surface. Using the scaling relation for the effective diffusion time (Arnett, 1979), we can estimate the ejected mass, , and the explosion energy of SN 2000cb from those inferred for SN 1987A: , (Blinnikov et al. 2000; see also Woosley 1988; Shigeyama & Nomoto 1990; Utrobin et al. 1995), where erg. The rise time of SN 2000cb is only 20% faster than that of SN 1987A, and the expansion velocities are a factor of higher. Adopting a similar opacity for both SNe would give an ejected mass of , and an explosion energy B. Preliminary results from PHOENIX modeling indicate that the spectra of SN 2000cb are compatible with an ejecta mass of and the same explosion energy of 4 B (Baron et al., in prep.). These values are significantly higher than the hydrogen envelope masses and energies typically inferred for SNe II-P (, B), though Utrobin et al. (2007) do find higher envelope masses () for both SN 1987A and SN 1999em.
Assuming a radioactive energy source, we can also estimate the mass of ejected in the explosion using Arnett’s law (Arnett, 1979), which states that the luminosity at peak equals the instantaneous rate of radioactive energy deposition. The luminosity we measure implies an ejected mass for SN 2000cb of ; however, because of radiative diffusion this is actually an upper bound, as some of this energy was deposited earlier in the light curve. If we interpret the slope of the light curve at d as being due to 56Co decay, then we find a mass of . This matches the highest values measured from the decay rates of SNe II-P at nebular phases (Hamuy, 2003), while the inferred value for SN 1987A is .
The lack of a thermal (i.e., nonradioactive) contribution to the light curve of SN 2000cb — or at the very least its dimness relative to SN 1999em at early times — provides an upper limit on the progenitor star radius. Both analytic and numerical models find that the thermal luminosity of SNe II-P on the plateau scales roughly as , where is the initial stellar radius (Popov, 1993; Kasen & Woosley, 2009). Comparing our above estimates of the properties of SN 2000cb to those inferred for SN 1999em (, , ; Baklanov et al. 2005), we find that the lower bolometric luminosity of SN 2000cb and its significantly higher energy imply an initial stellar radius 10–15 times smaller, cm, similar to that of SN 1987A, cm (Woosley, 1988). Using the values for SN 1999em as found by Utrobin et al. (2007) gives similar results. These scalings have been determined under the assumption that the photosphere is near the recombination temperature of hydrogen, K, which is consistent with our best-fitting blackbody temperature during the plateau.
We use the one-dimensional Lagrangian radiation-hydrodynamics code presented by Young (2004) in order to model the light curves of SN 2000cb and SN 1987A. The pre-SN model for both objects is taken from Woosley & Weaver (1995), with an initial mass of . The code assumes spherical symmetry and that the neutron star has a mass set as an inner gravitational boundary. The simulation is initiated by artificially placing thermal and kinetic energy in the inner zones, extracted from the formation of the neutron star. The energy injection produces a density discontinuity that propagates as an outward-moving shock wave that takes several hours to exit the star. The simulation follows the progression of the SN material as it expands and releases the energy deposited by the shock.
Figure 11 shows our fits to SN 1987A and SN 2000cb. For both SNe we reproduce the time scales and approximate maximum in the light curves. Included in the simulation is a calculation of the deposition of energy from the decay of radioactive 56Ni. One of the model parameters used to fit the light curve is the mixing of the radioactive material within the ejecta. The more extensive the Ni mixing, the sooner the effects of the heating will be observed. For SN 2000cb, we find it necessary to mix the 56Ni uniformly out to of the ejecta. This allows an early heating of the material and subsequent earlier peak in the light curve. In addition, since the code does not take into account nonthermal opacity sources, an opacity floor is used to simulate continued opacity due to nonthermal ionization. The effect on the opacity of the large mass of 56Ni and its substantial mixing is emulated by a higher opacity floor. In our model for SN 1987A, more substantial mixing would help smooth the sharp peak in the luminosity.
Fitting the velocity of the Fe lines in SN 2000cb requires an explosion energy of almost twice that of SN 1987A. As a consequence of the fast expansion, the debris becomes thinner faster, so a larger ejected mass of is necessary to harness the radioactive heating. This is 10% higher than our fit to SN 1987A. The radii and temperatures we obtain are qualitatively consistent with the blackbody fits to the photometry except at early times, where the temperature from the model is significantly too high — similar to SN 1999em but unlike what we measure for these very red SNe. The basic input parameters for SN 1987A are B, cm, and . For SN 2000cb we find B, cm, and . Here again we find that SN 2000cb had a relatively small initial radius consistent with a BSG, a significant explosion energy (although not as high as derived from the scaling above), and a substantial amount of . It seems plausible that the relatively high yield of SN 2000cb is related to its higher explosion energy, consistent with the correlation proposed by Nadyozhin (2003).
While there is typically some degeneracy between the energy and envelope mass derived for SNe (as we can often constrain only their ratio), we find for SN 2000cb that both the mass and energy were substantial. The massive ejecta are required in order to trap the gamma rays emitted by the decaying . A smaller envelope would entail more escape, pushing our mass estimates even higher.
A possibility which we have not taken into consideration is that asymmetry in the explosion and ejecta may have played a significant role for this object. This would require extensive modeling and is beyond the scope of this paper; moreover, we would also need to explain why most SNe II do not have such bizarre properties or any sign of significant asphericity (e.g., Leonard et al., 2001).
6 SN 2005ci and the rate of BSG explosions
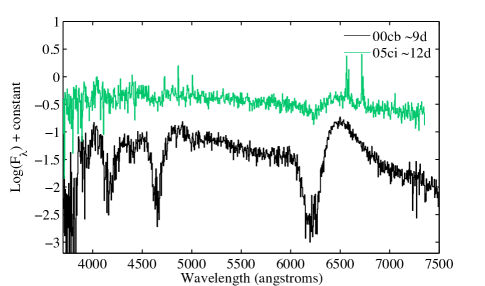
While a few possible identifications have been made (e.g., Schmitz & Gaskell 1988; Woodings et al. 1998; see a list in Pastorello et al. 2005), the only published secure analog to SN 1987A is SN 1998A. Here, in addition to SN 2000cb, we report that SN 2005ci (Madison & Li, 2005; Modjaz et al., 2005) may be of the same ilk. The peculiarity of this object was already noted by the Caltech Core-Collapse Project (Arcavi et al., 2009). Unfortunately, we have only partial coverage of the unfiltered light curve from KAIT (see Table 4). Nevertheless, the resemblance to SN 2000cb is striking. While SN 2005ci is fainter by mag (to some extent this could be due to extinction, which we cannot constrain), the rise times are nearly identical, as can be seen in the top panel of Figure 12. The bottom panel shows a spectrum of SN 2005ci at d after explosion compared to that of SN 2000cb at a similar phase. The two spectra are qualitatively similar, although the features of SN 05ci are much weaker. The velocities of the hydrogen absorption minima are measured to be 15,000 km s-1 and 13,000 km s-1 for H and H, respectively. These match well the velocities of SN 2000cb at a comparable phase (Fig. 9), and they are significantly higher than those measured for SNe 1999em and 1987A.
This additional identification raises the number of such SNe discovered by the Lick Observatory SN search to two out of 52 SNe II-P discovered over the period studied by Li et al. (2011), in a volume-limited sample. The corresponding rate is % that of normal SNe II-P, where the dominant error is derived from Poisson statistics. Since SNe II-P are the most abundant SNe in the Universe, this is not an insignificant fraction, on the order of 2% of all core-collapse SNe. The rate we derive is consistent with the one determined by Smartt et al. (2009) — less than 3% — by counting all SNe within about 28 Mpc and assuming the sample is reasonably complete and representative.
It would be of interest to study the metallicities of the locations of these SNe, given the possibility that massive stars are more likely to explode as BSGs than as RSGs at low metallicities (e.g., Langer, 1991; Chieffi et al., 2003). The location of SN 2000cb in the outskirts of its host spiral galaxy suggests a relatively low metallicity, in fact. Recently, Anderson et al. (2010) have measured the metallicity of H II regions near the positions of CC SNe, including one in the general vicinity of SN 2000cb, for which they find an oxygen abundance ( from the O3N2 method) that is close to typical for SNe II and II-P. However, that H II region was more than 3 kpc away from the supernova, so it may not give an accurate estimate of the metallicity in the progenitor’s immediate environment.
7 Conclusion
We have presented data and analysis of SN 2000cb, a peculiar Type II SN, with an atypical light curve and extreme photospheric velocities. SN 2000cb strongly resists our attempts to cast it into the standard SN II-P category while also avoiding identity with SN 1987A. Photometrically it is intrinsically redder than SN 1999em and fainter by about 0.5 mag on the plateau. It rises to maximum brightness much more slowly than a normal SN II-P, yet this rise is faster than that of SN 1987A and proceeds with a distinctively different colour and luminosity evolution. The main spectroscopic peculiarity lies in the exceptionally high velocities of its features at all times, most notably for the hydrogen absorption.
Our modeling, as well as extensive comparisons to other SNe, favour a high-energy explosion of a relatively small-radius star, most probably a BSG. We derive a rate for BSG explosions that is on the order of 2% of the rate of all core-collapse SNe.
SNe II-P are the most abundant SNe in the Universe and originate from the explosion of RSGs, the most abundant evolved massive stars. SN 1987A is the keystone of modern Type II SN theory, despite being the explosion of a BSG. Linking peculiar SNe such as SN 1987A and SN 2000cb to regular SNe II is critical for elucidating the processes that bring a star from formation to obliteration.
Acknowledgments
We thank Eddie Baron, Luc Dessart, Dan Maoz, and the referee (Stephen Smartt) for useful discussions and comments on this manuscript; Mario Hamuy and Andrea Pastorello for sharing their data; and the following for assistance with observations: Zoltan Balog, Perry Berlind, Alison Coil, Douglas Leonard, Maryam Modjaz, and Mark Phillips. D.P. acknowledges support from an Einstein Fellowship and from the US Department of Energy Scientific Discovery through Advanced Computing (SciDAC) program under contract DE-FG02-06ER06-04. A.V.F.’s SN group at UC Berkeley is supported by National Science Foundation (NSF) grant AST–0908886 and by the TABASGO Foundation. Supernova research at the Harvard College Observatory is supported by NSF grant AST–0907903. The construction and ongoing operation of KAIT were made possible by donations from Sun Microsystems, Inc., the Hewlett-Packard Company, AutoScope Corporation, Lick Observatory, the NSF, the University of California, the Sylvia & Jim Katzman Foundation, and the TABASGO Foundation. The Kast spectrograph at Lick Observatory resulted from a generous donation made by Bill and Marina Kast. We are grateful to the dedicated staffs at the Lick and F. L. Whipple Observatories.
References
- Aldering & Conley (2000) Aldering G., Conley A., 2000, IAU Circ., 7410, 3
- Anderson et al. (2010) Anderson, J. P., Covarrubias, R. A., James, P. A., Hamuy, M., & Habergham, S. M. 2010, MNRAS, 407, 2660
- Arcavi et al. (2009) Arcavi I., et al., 2009, BAAS, 214, #604.01
- Arnett (1979) Arnett W. D., 1979, ApJ, 230, L37
- Arnett et al. (1989) Arnett W. D., Bahcall J. N., Kirshner R. P., Woosley S. E., 1989, ARA&A, 27, 629
- Baklanov et al. (2005) Baklanov P. V., Blinnikov S. I., Pavlyuk N. N., 2005, Astronomy Letters, 31, 429
- Barbon et al. (1990) Barbon R., Benetti S., Rosino L., Cappellaro E., Turatto M., 1990, A&A, 237, 79
- Barbon et al. (1979) Barbon R., Ciatti F., Rosino L., 1979, A&A, 72, 287
- Baron et al. (2000) Baron E., et al., 2000, ApJ, 545, 444
- Bessell (1999) Bessell M. S., 1999, PASP, 111, 1426
- Blinnikov et al. (2000) Blinnikov S., Lundqvist P., Bartunov O., Nomoto K., Iwamoto K., 2000, ApJ, 532, 1132
- Cardelli et al. (1989) Cardelli J. A., Clayton G. C., Mathis J. S., 1989, ApJ, 345, 245
- Chieffi et al. (2003) Chieffi, A., Domínguez, I., Höflich, P., Limongi, M., & Straniero, O. 2003, MNRAS, 345, 111
- Dessart et al. (2008) Dessart L., et al., 2008, ApJ, 675, 644
- Dessart & Hillier (2008) Dessart L., Hillier D. J., 2008, MNRAS, 383, 57
- Dessart & Hillier (2010a) Dessart L., Hillier D. J., 2010a, MNRAS, 405, 2141
- Dessart et al. (2010b) Dessart L., Livne E., Waldman R., 2010b, MNRAS, 408, 827
- Eastman et al. (1994) Eastman R. G., Woosley S. E., Weaver T. A., Pinto P. A., 1994, ApJ, 430, 300
- Fabricant et al. (1998) Fabricant D., Cheimets P., Caldwell N., Geary J., 1998, PASP, 110, 79
- Filippenko (1982) Filippenko A. V., 1982, PASP, 94, 715
- Filippenko (1988) Filippenko A. V., 1988, AJ, 96, 1941
- Filippenko (1997) Filippenko A. V., 1997, ARA&A, 35, 309
- Filippenko et al. (2001) Filippenko A. V., Li W. D., Treffers R. R., Modjaz M., 2001, in B. Paczyński, W.-P. Chen, & C. Lemme ed., Small-Telescope Astronomy on Global Scales (San Francisco: ASP, Vol. 246), 121
- Foley et al. (2003) Foley R. J., et al., 2003, PASP, 115, 1220
- Ganeshalingam et al. (2010) Ganeshalingam M., et al., 2010, ApJS, 190, 418
- Hamuy (2003) Hamuy M., 2003, ApJ, 582, 905
- Hamuy (2004) Hamuy M., 2004, in Measuring and Modeling the Universe, ed. W. L. Freedman (Pasadena: Carnegie Observatories)
- Hamuy et al. 2009 ( 2009) Hamuy M., et al., 2009, ApJ, 703, 1612
- Hamuy & Pinto (2002) Hamuy M., Pinto P. A., 2002, ApJ, 566, L63
- Hamuy et al. (1988) Hamuy M., Suntzeff N. B., Gonzalez R., Martin G., 1988, AJ, 95, 63
- Hamuy (2001) Hamuy M. A., 2001, PhD thesis, The University of Arizona
- Hanuschik & Dachs (1987) Hanuschik R. W., Dachs J., 1987, A&A, 182, L29+
- Horne (1986) Horne K., 1986, PASP, 98, 609
- Jha et al. (2000) Jha S., Challis P., Kirshner R., Berlind P., 2000, IAU Circ., 7410, 2
- Jones et al. (2009) Jones M. I., et al., 2009, ApJ, 696, 1176
- Kasen & Woosley (2009) Kasen D., Woosley S. E., 2009, ApJ, 703, 2205
- Kirshner & Kwan (1974) Kirshner R. P., Kwan J., 1974, ApJ, 193, 27
- Kirshner et al. (1973) Kirshner R. P., Oke J. B., Penston M. V., Searle L., 1973, ApJ, 185, 303
- Langer (1991) Langer N. 1991, A&A, 243, 155
- Leonard et al. (2001) Leonard D. C., Filippenko A. V., Ardila D. R., Brotherton M. S., 2001, ApJ, 553, 861
- Leonard et al. (2002) Leonard D. C., et al., 2002a, PASP, 114, 35 [Erratum: 114, 1291]
- Leonard et al. (2002) Leonard D. C., et al., 2002b, AJ, 124, 2490
- Leonard et al. (2003) Leonard D. C., Kanbur S. M., Ngeow C. C., Tanvir N. R., 2003, ApJ, 594, 247
- Li et al. (2003) Li W., Filippenko A. V., Chornock R., Jha S., 2003, ApJ, 586, L9
- Li et al. (2011) Li W., et al., 2011, MNRAS, in press (arXiv:1006.4612)
- Li et al. (2000) Li W. D., et al., 2000, in Cosmic Explosions, ed. S. S. Holt & W. W. Zhang (New York: AIP), 103
- Madison & Li (2005) Madison D. R., Li W., 2005, IAU Circ., 8541, 1
- Matheson et al. (2000) Matheson T., Filippenko A. V., Ho L. C., Barth A. J., Leonard D. C., 2000, AJ, 120, 1499
- Matheson et al. ( 2008) Matheson T., et al., 2008, AJ, 135, 1598
- Miller & Stone (1993) Miller J. S., Stone R. P. S., 1993, Lick Obs. Tech. Rep. 66 (Santa Cruz: Lick Obs.)
- Modjaz et al. (2005) Modjaz M., Kirshner R., Challis P., Calkins M., 2005, IAU Circ., 8542, 2
- Nadyozhin (2003) Nadyozhin D. K., 2003, MNRAS, 346, 97
- Nugent et al. (2006) Nugent P., et al., 2006, ApJ, 645, 841
- Olivares (2010) Olivares F., et al., 2010, ApJ, 715, 833
- Papenkova & Li (2000) Papenkova M., Li W. D., 2000, IAU Circ., 7410, 1
- Pastorello et al. (2005) Pastorello A., et al., 2005, MNRAS, 360, 950
- Popov (1993) Popov D. V., 1993, ApJ, 414, 712
- Poznanski et al. (2009) Poznanski D., et al., 2009, ApJ, 694, 1067
- Poznanski et al. (2010) Poznanski, D., Nugent, P. E., & Filippenko, A. V. 2010, ApJ, 721, 956
- Richmond et al. (1994) Richmond M. W., Treffers R. R., Filippenko A. V., Paik Y., Leibundgut B., Schulman E., Cox C. V., 1994, AJ, 107, 1022
- Schlegel et al. (1998) Schlegel D. J., Finkbeiner D. P., Davis M., 1998, ApJ, 500, 525
- Schmitz & Gaskell (1988) Schmitz M. F., Gaskell C. M., 1988, in Supernova 1987A in the Large Magellanic Cloud, ed. M. Kafatos & A. G. Michalitsianos (Cambridge: Cambridge Univ. Press), 112
- Shigeyama & Nomoto (1990) Shigeyama T., Nomoto K., 1990, ApJ, 360, 242
- Smartt et al. (2009) Smartt S. J., Eldridge J. J., Crockett R. M., Maund J. R., 2009, MNRAS, 395, 1409
- Springob et al. (2009) Springob C. M., Masters K. L., Haynes M. P., Giovanelli R., Marinoni C., 2009, ApJS, 182, 474
- Storm et al. (2004) Storm J., Carney B. W., Gieren W. P., Fouqué P., Latham D. W., Fry A. M., 2004, A&A, 415, 531
- Turatto et al. (2003) Turatto M., Benetti S., Cappellaro E., 2003, in From Twilight to Highlight: The Physics of Supernovae, ed. W. Hillebrandt & B. Leibundgut (Berlin: Springer-Verlag), 200
- Utrobin & Chugai (2009) Utrobin V. P., Chugai N. N., 2009, A&A, 506, 829
- Utrobin et al. (1995) Utrobin V. P., Chugai N. N., Andronova A. A., 1995, A&A, 295, 129
- Utrobin et al. (2007) Utrobin V. P., Chugai N. N., Pastorello A., 2007, A&A, 475, 973
- Wade & Horne (1988) Wade R. A., Horne K., 1988, ApJ, 324, 411
- Woodings et al. (1998) Woodings S. J., Williams A. J., Martin R., Burman R. R., Blair D. G., 1998, MNRAS, 301, L5
- Woosley (1988) Woosley S. E., 1988, ApJ, 330, 218
- Woosley et al. (1987) Woosley S. E., Pinto P. A., Martin P. G., Weaver T. A., 1987, ApJ, 318, 664
- Woosley & Weaver (1995) Woosley S. E., Weaver T. A., 1995, ApJS, 101, 181
- Young (2004) Young T. R., 2004, ApJ, 617, 1233
| JD | PhaseaaRelative to JD . | (mag) | (mag) | (mag) | (mag) |
|---|---|---|---|---|---|
| 2451658.96 | 3 | 18.72(06) | … | … | … |
| 2451661.97 | 6 | 17.74(06) | … | … | … |
| 2451663.92 | 8 | 17.83(06) | 18.78(06) | 18.04(03) | 17.66(06) |
| 2451665.96 | 10 | 17.42(06) | … | … | … |
| 2451667.93 | 12 | … | 18.78(07) | 17.80(04) | 17.30(06) |
| 2451670.96 | 15 | 17.06(06) | … | … | … |
| 2451691.93 | 36 | 16.33(06) | … | … | … |
| 2451692.88 | 37 | … | 17.73(03) | 16.62(02) | 15.87(02) |
| 2451693.93 | 38 | 16.27(06) | … | … | … |
| 2451696.87 | 41 | 16.11(06) | 17.83(05) | 16.61(02) | 15.80(03) |
| 2451699.88 | 44 | 16.11(06) | … | … | … |
| 2451700.85 | 45 | … | 17.87(02) | 16.56(02) | 15.75(02) |
| 2451702.87 | 47 | 16.24(06) | … | … | … |
| 2451706.85 | 51 | 16.14(06) | 17.98(05) | 16.59(02) | 15.67(01) |
| 2451713.82 | 58 | … | 18.05(04) | 16.61(02) | 15.63(02) |
| 2451716.85 | 61 | 16.04(06) | … | … | … |
| 2451717.84 | 62 | … | 18.08(04) | 16.56(02) | 15.59(02) |
| 2451719.81 | 64 | 16.19(06) | … | … | … |
| 2451721.82 | 66 | … | 18.14(04) | 16.56(01) | 15.57(02) |
| 2451722.84 | 67 | 16.18(06) | … | … | … |
| 2451726.79 | 71 | 16.11(06) | … | … | … |
| 2451728.77 | 73 | … | 18.19(05) | 16.57(02) | 15.58(01) |
| 2451731.78 | 76 | 16.10(06) | … | … | … |
| 2451735.72 | 80 | … | 18.20(04) | 16.63(02) | 15.61(02) |
| 2451740.75 | 85 | 16.20(06) | … | … | … |
| 2451742.73 | 87 | … | 18.38(06) | 16.66(02) | 15.66(02) |
| 2451743.78 | 88 | 16.23(13) | … | … | … |
| 2451747.72 | 92 | 16.21(06) | … | … | … |
| 2451749.69 | 94 | … | 18.55(06) | 16.85(02) | 15.74(02) |
| 2451752.72 | 97 | 16.34(06) | … | … | … |
| 2451756.69 | 101 | 16.61(06) | 18.78(09) | 17.18(02) | 15.93(02) |
| 2451760.68 | 105 | 16.90(06) | … | … | … |
| 2451770.69 | 115 | 16.98(06) | … | … | … |
| 2451774.66 | 119 | 16.89(07) | … | … | … |
| 2451781.66 | 126 | … | 19.37(16) | 17.90(05) | 16.52(03) |
| 2451788.66 | 133 | … | 19.37(18) | 18.14(19) | … |
| 2451795.64 | 140 | … | 19.32(20) | 18.20(10) | 16.68(03) |
| 2451802.64 | 147 | … | … | 18.21(15) | 16.80(07) |
Note. — Values in parentheses are 1 measurement uncertainties in hundredths of mag.
| Star | (mag) | (mag) | (mag) | |||
|---|---|---|---|---|---|---|
| 1 | 16:01:24.72 | +1:45:12.95 | 18.454 (005) | 16.948 (007) | 15.039 (004) | 3bbOne calibration fewer in the band. |
| 2 | 16:01:37.57 | +1:45:02.35 | 16.034 (010) | 15.355 (011) | 14.562 (011) | 4 |
| 3 | 16:01:29.31 | +1:44:54.15 | 17.965 (009) | 17.269 (014) | 16.468 (013) | 4bbOne calibration fewer in the band. |
| 4 | 16:01:37.68 | +1:44:01.86 | 16.058 (011) | 15.245 (010) | 14.370 (005) | 4 |
| 5 | 16:01:42.60 | +1:43:54.82 | 15.331 (012) | 14.637 (009) | 13.873 (011) | 4 |
| 6 | 16:01:37.97 | +1:43:15.13 | 16.444 (015) | 15.609 (013) | 14.721 (004) | 4 |
| 7 | 16:01:40.84 | +1:43:09.37 | 16.944 (009) | 16.305 (008) | 15.547 (006) | 4 |
| 8 | 16:01:41.42 | +1:42:49.59 | 17.800 (012) | 17.156 (003) | 16.482 (007) | 4bbOne calibration fewer in the band. |
| 9 | 16:01:25.05 | +1:42:36.87 | 16.987 (013) | 16.394 (012) | 15.638 (004) | 3ccOne calibration fewer in the band. |
| 10 | 16:01:26.98 | +1:42:14.91 | 17.544 (014) | 16.849 (008) | 16.039 (011) | 4 |
| 11 | 16:01:25.51 | +1:42:29.21 | 18.994 (006) | 17.610 (015) | 15.882 (012) | 3bbOne calibration fewer in the band. |
| 12 | 16:01:35.25 | +1:41:02.21 | 16.905 (009) | 16.229 (007) | 15.420 (003) | 4 |
| 13 | 16:01:22.75 | +1:40:58.56 | 18.695 (030) | 17.391 (000) | 15.837 (001) | 2bbOne calibration fewer in the band. |
| 14 | 16:01:34.33 | +1:39:49.91 | 18.143 (016) | 17.348 (017) | 16.321 (013) | 2 |
| 15 | 16:01:34.61 | +1:45:25.55 | 15.842 (012) | 14.952 (003) | 14.006 (012) | 4 |
Note. — 1 uncertainties are in units of mag.
| UT Date | Phase (d) | Range (Å) | Exp (s) | AirmassaaAirmass corresponds to the middle of the exposure. | Observer(s)bbAC = Alison Coil, AF = Alex Filippenko, DL = Douglas Leonard, MM = Maryam Modjaz, MP = Mark Phillips, PB = Perry Berlind, RC = Ryan Chornock, WL = Weidong Li, ZB = Zoltan Balog. | Instrument |
|---|---|---|---|---|---|---|
| 2000 April 28.37 | 6.9 | 3720–7540 | 1.2 | PB | FAST | |
| 2000 April 30.38 | 8.9 | 3720–7540 | 1200 | 1.2 | ZB | FAST |
| 2000 May 31.372 | 39.9 | 4250–6950 | 900 | 1.3 | AF, AC | Kast |
| 2000 Jun. 27.265 | 66.8 | 4240–6950 | 1200 | 1.3 | AF, AC | Kast |
| 2000 Jul. 6.377 | 75.9 | 4250–6960 | 1200 | 2.5 | AF, RC, MM | Kast |
| 2000 Jul. 28.308 | 97.8 | 4250–6940 | 900 | 2.2 | AF, RC | Kast |
| 2000 Aug. 26.198 | 126.7 | 4240–6950 | 1500 | 1.8 | DL, WL | Kast |
| 2000 Sep. 6.216 | 137.7 | 3300–7760 | 1800 | 2.8 | AF, WL, RC | Kast |
| 2000 Sep. 26.136 | 157.6 | 3300–7800 | 1800 | 2.2 | AF, WL, RC, MP | Kast |
Note. — Spectra were obtained using the Kast spectrograph on the 3 m Shane telescope at Lick Observatory and the FAST spectrograph on the 1.5 m Tillinghast telescope at Whipple Observatory.
| JD | PhaseaaRelative to JD . | (mag) |
|---|---|---|
| 2453523.86 | 3 | 20.16(15) |
| 2453531.81 | 11 | 18.78(13) |
| 2453532.85 | 12 | 18.75(13) |
| 2453533.83 | 13 | 18.76(13) |
| 2453534.76 | 14 | 18.86(13) |
| 2453536.80 | 16 | 18.51(16) |
| 2453540.82 | 20 | 18.31(13) |
| 2453545.79 | 25 | 18.18(13) |
| 2453549.78 | 29 | 17.94(13) |
| 2453553.79 | 33 | 17.75(13) |
| 2453557.78 | 37 | 17.63(13) |
| 2453561.76 | 41 | 17.72(15) |
| 2453565.75 | 45 | 17.53(13) |
| 2453567.68 | 47 | 17.68(15) |
Note. — Values in parentheses are 1 measurement uncertainties in hundredths of mag.