The innermost dusty structure in active galactic nuclei as probed by the Keck interferometer
We are now exploring the inner region of Type 1 active galactic nuclei (AGNs) with the Keck interferometer in the near-infrared. Adding to the four targets previously studied, we report measurements of the K-band (2.2 m) visibilities for four more targets, namely AKN120, IC4329A, Mrk6, and the radio-loud QSO 3C273 at =0.158. The observed visibilities are quite high for all the targets, which we interpret as an indication of the partial resolution of the dust sublimation region. The effective ring radii derived from the observed visibilities scale approximately with , where is the AGN luminosity. Comparing the radii with those from independent optical-infrared reverberation measurements, these data support our previous claim that the interferometric ring radius is either roughly equal to or slightly larger than the reverberation radius. We interpret the ratio of these two radii for a given as an approximate probe of the radial distribution of the inner accreting material. We show tentative evidence that this inner radial structure might be closely related to the radio-loudness of the central engine. Finally, we re-observed the brightest Seyfert 1 galaxy NGC4151. Its marginally higher visibility at a shorter projected baseline, compared to our previous measurements obtained one year before, further supports the partial resolution of the inner structure. We did not detect any significant change in the implied emission size when the K-band flux was brightened by a factor of 1.5 over a time interval of one year.
Key Words.:
Galaxies: active, Galaxies: Seyfert, Infrared: galaxies, Techniques: interferometric1 Introduction
With long-baseline interferometry in the mid-IR, the inner dust distribution in active galactic nuclei (AGN) has been studied over the past several years (e.g. early results on Seyfert 2 galaxies by Jaffe et al. 2004, Tristram et al. 2007; radio galaxy, Meisenheimer et al. 2007; Type 1 AGNs, Beckert et al. 2008, Kishimoto et al. 2009b, Burtscher et al. 2009; snapshot survey, Tristram et al. 2009). In the near-IR, after the very early results for the brightest Seyfert 1 galaxy NGC4151 (Swain et al. 2003) and Seyfert 2 galaxy NGC1068 (Wittkowski et al. 2004), long-baseline interferometry has now started to explore the innermost dusty structure extensively at milli-arcsec (mas) resolution (Kishimoto et al. 2009a, hereafter Paper I; Pott et al. 2010). We focus on Type 1 AGNs, which are considered to provide us with a direct view of the region and thus can be used to scrutinize the inner structure. Here we report on new measurements for four more targets, which double the sample size of our previous study in Paper I.
| name | date (UT) | scaleb | c | d | PA | e | radio fluxf | |||||
| corr. | (pc mas-1) | (mag) | (m) | (°) | (mas) | (pc) | (mJy) | (GHz) | (mag) | |||
| AKN120 | 2009-11-07 | 0.0327 | 0.653 | 0.128 | 74.6 | 31.9 | 0.8430.097 | 0.560.19 | 0.360.12 | 9.3g | 1.4 | |
| IC4329A | 2010-05-01 | 0.0170 | 0.345 | 0.059 | 69.8 | 49.6 | 0.8680.084 | 0.540.18 | 0.190.06 | 10.7h | 8.4 | 21n |
| MRK6 | 2010-05-01 | 0.0188 | 0.382 | 0.136 | 71.5 | 1.4 | 0.9090.048 | 0.440.12 | 0.170.05 | 39.5i | 8.4 | |
| 3C273 | 2010-05-02 | 0.159 | 2.75 | 0.021 | 83.5 | 39.9 | 0.9580.034 | 0.250.10 | 0.690.28 | 3.20E4j | 4.8 | |
| NGC4151 | 2010-05-01 | 0.00414 | 0.0855 | 0.028 | 72.4 | 51.0 | 0.9200.017 | 0.400.05 | 0.0340.004 | 125.k | 4.9 | |
| 2010-05-01 | 81.3 | 40.7 | 0.8780.049 | 0.450.10 | 0.0380.008 | |||||||
| 2010-05-02 | 84.9 | 21.7 | 0.8830.048 | 0.420.09 | 0.0360.008 | |||||||
| NGC4051 | 0.00309 | 0.0639 | 6.0k | 4.9 | ||||||||
| MRK231 | 0.0427 | 0.841 | 173.l | 5.0 | ||||||||
| IRAS13349o | 0.109 | 1.98 | 19.9m | 1.4 | ||||||||
a CMB corrected value from NED. b km s-1 Mpc-1, , and . c Galactic reddening from Schlegel et al. (1998). d Projected baseline lengths. e Thin-ring radius. f Radio flux observed at frequency given. For radio-quiet objects, flux from linear (double or triple) structure at 100 pc scale is given, except for AKN120, IC4329A, and IRAS13349+2438, for which flux from a source unresolved at resolution of (3.9kpc), (350pc), and (11kpc), respectively, is given. g Condon et al. (1998). h Nagar et al. (1999). i Schmitt et al. (2001). j Tingay et al. (2003). k Ulvestad & Wilson (1984). l Ulvestad et al. (1999). m White et al. (1997). n Winkler et al. (1992). o IRAS13349+2438.
2 Observations and data reduction
2.1 Keck interferometry
The Keck Interferometer (KI; Colavita & Wizinowich 2003) combines the two beams from the two Keck 10 m telescopes which are separated by 85 m along the direction 38° east of north. We observed Type 1 AGNs listed in Table 1 and associated calibrators with the KI in Nov 2009 and May 2010. The targets were partly chosen based on the bright optical magnitudes measured from the pre-imaging data obtained in Oct 2009 at Tiki Observatory (French Polynesia) by N. Teamo and J. C. Pelle, and at Silver Spring Observatory (USA).
The Adaptive Optics system at each Keck telescope was locked on the nucleus of each target galaxy at visible wavelengths. The fringe tracker was operated in the K-band at the rates of 100Hz and 200Hz in our observing runs in Nov 2009 and May 2010, respectively. The angle-tracking was performed in H-band at the rate of either 40 or 80 Hz. The data were first reduced with Kvis111http://nexsci.caltech.edu/software/KISupport/v2/V2reductionGuide.pdf to produce raw squared visibility () data averaged over blocks of 5sec each.
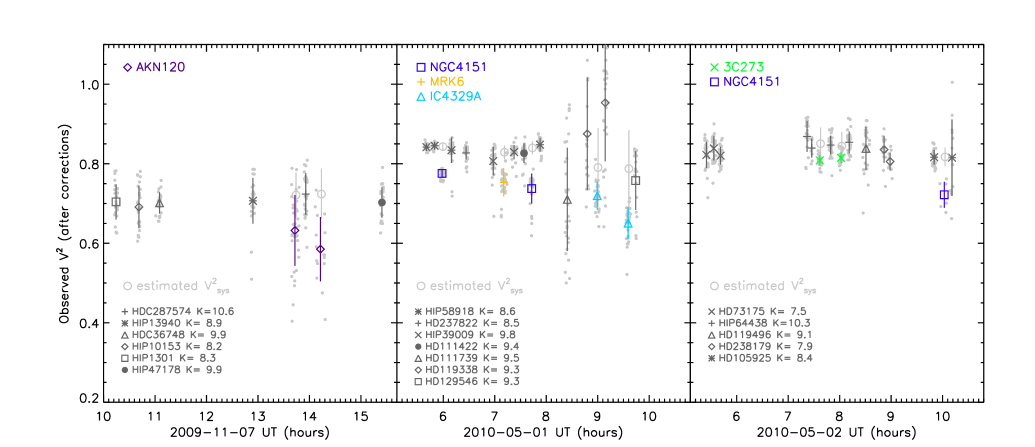
During the observing night in Nov 2009, we often detected a quite uneven level of flux from the two telescopes, resulting in visibility attenuation. In the May 2010 run, this was seen only for the calibrators observed at large air masses. The standard software wbCalib222http://nexsci.caltech.edu/software/V2calib/wbCalib/index.html has been shown to be able to correct for this effect333http://nexsci.caltech.edu/software/KISupport/dataMemos/KI_ratio.pdf, but we also rejected blocks associated with a discrepantly large flux ratio of the two beams (8). The wide-band side of the data were then reduced using wbCalib with the correction for the flux ratio and flux bias. The blocks were averaged into scans over a few to several minutes each, with its error being estimated as a standard deviation within a scan. Figure 1 shows the observed visibilities of all the targets and calibrators (after the corrections above), plotted against the observing time.
All the calibrators used444The star HD240991 was excluded from the calibration, since two observations showed systematically lower visibilities than other calibrators. (Fig. 1) are expected to be unresolved by the KI at K-band (). The calibrators span a relatively wide range of brightness, and some were found to have lower injected flux counts at K-band than the science targets (for the same K-band magnitude, calibrator counts are often higher due partly to their bluer colors which lead to a better AO performance in the optical.) As in Paper I, we assign 0.01 to be the possible systematic uncertainty in the system visibility estimate, based on the difference between the corrected visibilities of brighter calibrators and those of fainter ones, though in many cases the total uncertainty is dominated by much larger statistical errors. For each target measurement, the system visibility was estimated from these calibrator observations with wbCalib using its time and sky proximity weighting scheme (using the default555http://nexsci.caltech.edu/software/V2calib/wbCalib/index.html time constant of 1 hour and distance of 15∘), yielding the measurements indicated by the gray circles in Fig. 1. Averages were taken for those objects with two calibrated measurements adjacent in time that were consistent with each other (Fig. 1; AKN120, IC4329A, 3C273). The final calibrated visibilities with the errors including the systematic uncertainty added in quadrature are shown in Table 1.
2.2 UKIRT imaging
To obtain contemporaneous flux measurements of the variable nuclei, we observed all the KI targets with WFCAM on UKIRT (except for Mrk 6, which was outside the UKIRT pointing limit) about five to six weeks after each KI observing run, which is generally shorter than the variability timescale, at five broad bands from 0.9 to 2.2 m. The observations were done under the UKIRT service program. The data were handled in the same way as described in Paper I. The wide FOV of WFCAM provided simultaneous PSF measurements from stars in the same field. These PSFs were used to decompose each image into the nuclear PSF component and host galaxy, leading to the SED measurement of the nuclear point source in each AGN. The measured fluxes are summarized in Table 2. The SEDs, after correcting for reddening in both our Galaxy and for IC4329A in the host galaxy (Table 2), are shown in Fig. 2, together with the four SEDs from Paper I.

3 Results
3.1 Visibilities and ring radii
For all of our targets, quite high visibilities were observed (Table 1), which was also the case for the previous four targets in Paper I. We interpret these high visibilities as an indication of the partial resolution of the dust sublimation region as we argued in Paper I and discussed in sects. 3.2 and 4 below. The most simplistic, physically-motivated representation of the dust sublimation region seen face-on would be a ring geometry. To measure its effective radius regardless of the structure details (e.g. smooth versus clumpy distribution [Krolik & Begelman 1988], this information probably not being contained in the visibilities at low spatial frequencies well before the first null), we deduce in Table 1 a thin-ring radius that corresponds to the observed visibility at the projected baseline for each target observation.
The fractional uncertainty in the ring radius for the data at the low spatial frequencies well before the first null can be estimated in the same way as in the Gaussian geometry case, given as
where is the total uncertainty in . When we have multiple data at different baselines as in the case of NGC4151, we estimate the overall fractional uncertainty in the same way by replacing and with their mean over the data points.
We note that the exact inclination of the structure is not known, thus the resulting possible elongation of the ring due to inclination is still generally unknown. However, we note that we do not see a significant PA dependence in the effective ring radii in NGC4151 over the PA range from 10 to 50 (Paper I; see also Fig. 3 described below), where the inner system axis is supposed to be at PA 90 (optical polarization, Martel 1998; radio jet, Mundell et al. 2003), despite the object often being thought to be relatively inclined at the narrow-line region scale (e.g. Das et al. 2005 and references therein).
Since the visibility measurements are affected by the host galaxy flux fraction within the FOV of the KI, and also by the flux contribution from the unresolved accretion disk (AD), we estimated these two quantities using our UKIRT imaging data in the same way as described in sect.3 of Paper I. For Mrk6, we used the 2MASS images. In brief, we fitted each SED with a power-law form for the AD (supported by both theory and observations; Kishimoto et al. 2008) and a black-body form for the dust (the best-fit temperatures were 1200-1500K). The results are stated in Table 2 along with the ring radii corrected for these effects. We note that the effects are generally very small, and the two effects also tend to partially cancel each other.
3.2 NGC4151 re-observation
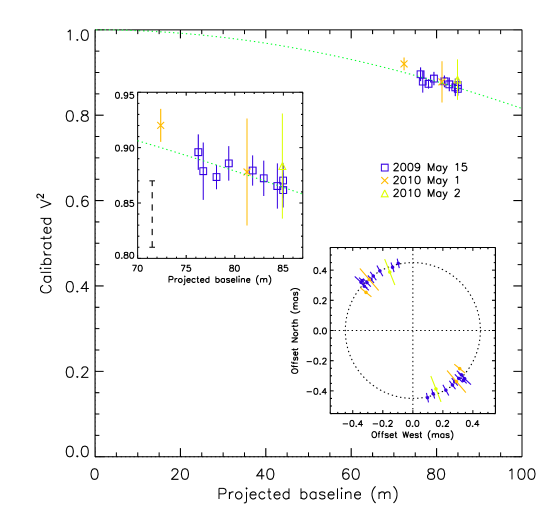
We obtained quite extensive data for NGC4151 in May 2009 (Paper I), but re-observed the target in May 2010 to measure the visibility essentially at the shortest possible projected baseline under the current delay line restriction in the KI, and to check for visibility variability. Pott et al. (2010) compared their data on NGC4151 with that of Swain et al. (2003) and our 2009 data, and reported that the object has not shown any significant variability in the K-band visibility.
Figure 3 shows our re-observations plotted over the May 2009 measurements. The previous data (squares) showed a marginal decrease over increasing baselines. This is now apparently supported by the higher observed at the shorter projected baseline of 72 m. We caution that, when we compare the data from different nights, we should take into account the possible systematic uncertainty in the absolute calibrations, while each data point in Fig. 3 is shown with only a statistical error, which is adequate for comparing data within a given stable night. The systematic uncertainty could be up to 0.03 (footnote 6; indicated as a dashed vertical bar in the left inset of Fig. 3), although this number is probably conservative for the wide-band side data that we use here. This was deduced from the systematic difference in between its observed and predicted values for known-orbit binaries where the difference was comparable to or smaller than statistical errors. (From our data alone, we estimate the systematic uncertainty of 0.01 after the flux-bias correction, and this has been incorporated in the errors shown in Table 1, as described in sect. 2.1.)
Having these in mind, we calculated the Pearson’s linear correlation coefficient between the projected baseline and calibrated , by weighting the May 2010 data conservatively using the uncertainty of 0.03 (when the statistical error is smaller than this value) while keeping the statistical uncertainty for the 2009 data as weights. The coefficient is , meaning in this case of 12 data points that the confidence level for rejecting the null correlation is 99.6%, or 2.9. (Note that weighting the 2009 data using the uncertainty of 0.03 as well would in this case lead to even a larger significance.)
The ring radius implied by the new measurements is consistent with the radius deduced from the data in May 2009 within the errors even when excluding the systematic uncertainty. Thus, we did not detect any significant variability in the interferometric size. This is consistent with the result by Pott et al. (2010). On the basis of our quasi-simultaneous UKIRT SED measurements, the nuclear K-band flux has brightened by a factor of 1.5 over the one year interval. On this timescale, the overall inner radial dust distribution does not seem to have changed significantly. This conclusion remains the same even after the host galaxy and accretion disk flux fractions are taken into account.
| name | date | flux (mJy)a | magnitude | hostb | AD | corrected | corr. | fitd | |||||
|---|---|---|---|---|---|---|---|---|---|---|---|---|---|
| (UT) | Z | Y | J | H | K | J | K | (%) | fractionc | (pc) | (pc) | ||
| AKN120 | 2009-12-13 | 11.7 | 11.8 | 16.4 | 26.6 | 60.7 | 12.4 | 10.1 | 0.60.1 | 0.170.05 | 0.8220.117 | 0.380.14 | 0.15 |
| IC4329A | 2010-06-13 | 15.0 | 16.0 | 23.9 | 41.6 | 75.5 | 12.0 | 9.8 | 0.90.2 | 0.290.09 | 0.8390.119 | 0.210.08 | 0.13 |
| Mrk6e | 1999-02-27 | — | — | 16.3 | 29.1 | 53.6 | 12.4 | 10.2 | 0.20.1 | 0.210.05 | 0.8900.061 | 0.180.05 | 0.097 |
| 3C273 | 2010-06-14 | 29.0 | 29.1 | 33.2 | 45.7 | 81.9 | 11.7 | 9.7 | 0.1 | 0.280.09 | 0.9420.047 | 0.810.34 | 1.1 |
| NGC4151 | 2010-06-14 | 51.1 | 54.0 | 81.8 | 136. | 264. | 10.7 | 8.5 | 0.20.1 | 0.140.05 | 0.9120.021f | 0.0370.007g | 0.037 |
a Flux measurement uncertainty is 5 % (see sect.3 in Paper I). b Host galaxy flux fraction at K-band estimated for the KI’s 50 mas FOV in the AO-corrected images. c AD flux fraction of the point source at K-band. d from UV luminosity using the fit by Suganuma et al. (2006). e From 2MASS images. f Value for the shortest baseline data. g Best-fit value for 2010-05-01 data.
4 Discussions
4.1 Radius vs luminosity
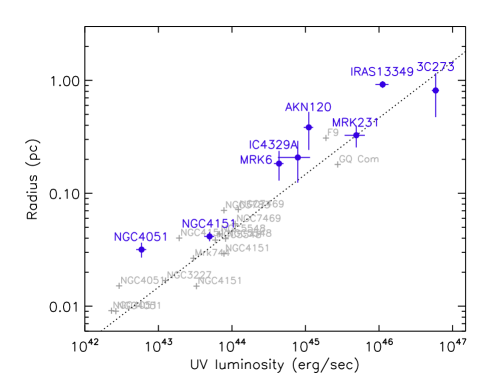
Figure 4 shows the ring radii derived from the visibility, after the correction for the host galaxy and unresolved AD component, as a function of the UV luminosity , defined here as a scaled optical luminosity of 6(5500Å) (Kishimoto et al. 2007). The flux at 5500Å is here extrapolated from the fitted SED at 0.8 m by assuming the AD spectral shape of (based on spectral index studies summarized in Fig. 2 of Kishimoto et al. 2008) and shown in Fig. 2.
We can directly compare the ring radius with the near-IR reverberation radius , which is the light-crossing distance over the time lag of the K-band flux variation relative to the optical flux variation (e.g. Glass 2004; Suganuma et al. 2006). The time-lag radii of a sample of galaxies have been shown to be approximately proportional to (Suganuma et al. 2006; their fit is shown as a dotted line in Fig. 4), and are likely to be probing the dust sublimation radius in each object. Figure 4 shows that the interferometric ring radii also scale approximately with , and they are of the same order as the reverberation radii for a given luminosity. This is what we reported in Paper I, but now we confirm this with a larger sample. This further supports that the KI observations indeed partially resolve the dust sublimation region.
We note that all of our KI targets have similarly high visibilities, thus the inferred angular sizes are relatively similar (Table 1). This is what we expect for the scaling, since the angular sizes of the dust sublimation radius scale only with the apparent magnitudes of the illuminating source (for cases; e.g. Kishimoto et al. 2007), which are within a relatively small range. Conversely, the similarly high visibilities observed for the KI targets imply that the physical size of the corresponding, partially resolved structure scales roughly with .
4.2 Inner radial structure
Furthermore, we confirm the tendency already seen in Paper I for to be either roughly equal to or slightly larger than for a given luminosity. As we described in Paper I, this can be understood in the picture where represents a radius very close to the inner boundary of dust distribution, while corresponds to a brightness-weighted effective radius. The former is based on the fact that the reverberation technique generally places weight on the small responding radii when the lag is determined from the peak in the cross-correlation function (e.g. sect. 3 in Koratkar & Gaskell 1991 and references therein). It is also based on the fact that the fit actually is very close to the dust sublimation radius at the large-grain (black-body) limit, which is the smallest possible sublimation radius for a given sublimation temperature (this temperature being constrained by the observed color temperature; Kishimoto et al. 2007; Fig. 2). In this picture, close to means a steep and compact mass distribution where most dust sits close to the innermost radius. On the other hand, if is observed to be much larger than , the dust distribution is much shallower and more extended.
In this case, we can use the ratio of to the fit as an approximate probe for the radial distribution of the innermost, likely accreting (e.g. Krolik & Begelman 1988), dusty material. In practice, the real inner boundary radius of the dust distribution is probably still slightly smaller than . In addition, the measured individual has on average an uncertainty of the order of the scatter from the fit (Fig. 30 in Suganuma et al. 2006). Taking the ratio with respect to the fit, however, we can take out the relatively robust dependence from the interferometric ring radii, quite insensitively to the uncertainty in the reverberation measurements. The resulting ratio, at least in a relative sense over the sample, has a physically interpretable meaning described above, and can be used to explore any possible relations between the inner radial structure and the property of the central engine in each AGN. In this way, we can exploit the power of the interferometry, which can easily distinguish a size difference of a factor of few, as demonstrated e.g. in Kishimoto et al. (2007).

4.3 Radio connection
Intriguingly, objects with the ratio close to unity, i.e. corresponding to the steepest and most compact distribution, are those that are known to show linear radio jet structures (NGC4151, Mundell et al. 2003; Mrk231, Ulvestad et al. 1998, known as compact symmetric object; 3C273). Mrk6 is also known to exhibit a linear jet structure (e.g. Kukula et al. 1996), but our measurement has a relatively large uncertainty. Figure 5 shows the fit ratio plotted against the radio-to-optical luminosity ratio. Here we might have started to see evidence of a correlation, suggesting that jet-launching objects possess a very steep and compact distribution of inner accreting material. We regard this possible correlation as tentative, since the sample size is small and the statistical significance is still not very high (e.g. the Spearman’s rank correlation analysis gives 91% confidence, or 1.7).
One possible remaining ambiguity concerns the UV luminosity . Here we have adopted the scaled optical luminosity for . It might be better to use an observed UV luminosity, perhaps averaged over a long timescale if sublimation radius is not changing quickly. However, uncertainties from foreground absorption in the UV can be significant. In addition, the observed scaling of seems to imply that the optical luminosity is at least approximately proportional to the (dust-heating) UV luminosity. We will have to see whether further study of the most relevant luminosity strengthens or weakens the correlation.
Another source of ambiguity is the inclination, although we focus intentionally on Type 1 objects, which should largely avoid this problem. In the simplest picture of an inclined circular ring, the projection correction would make the ring radii systematically larger, but would not necessarily weaken the observed tentative relationship. With more measurements, we hope to pursue the PA dependency in each object as we have done for NGC4151 (sect. 3.2; Fig. 3).
Finally we note that the effect of the synchrotron emission contribution to the deduced ring size is considered to be very small, if at all present, as we discuss below.
4.4 Synchrotron contribution and 3C273
For radio-loud objects, the synchrotron contribution at K-band can potentially make the apparent ring size smaller than it actually is, just as the unresolved AD contribution does. Based on the radio to infrared SEDs (Sanders et al. 1989; Elvis et al. 1994; those from NED), the only object for which this issue is relevant in our present sample is 3C273. In a quiescent state, the object is known to have only low polarization through the optical (; e.g. Impey et al. 1989) to near-IR (1%; Smith et al. 1987; Sitko & Zhu 1991), while a flaring state is accompanied by much higher polarization (Courvoisier et al. 1988; Wills 1989; Cross et al. 2001). The additional emerging flux in the K-band in the latter state can be attributed to synchrotron contribution (Courvoisier et al. 1988).
However, the object was in a quiescent state at the time of both the KI and UKIRT runs, judging from the public light curve777http://www.aavso.org and the observed flux. We therefore infer that the K-band synchrotron contribution, if present at all, was small at the time of our observations. Even if all the possible K-band polarized flux in a quiescent state, mJy, originates from synchrotron emission with an intrinsic polarization of 10% (Impey et al. 1989), the contribution is mJy. Our effective radius estimate for the dust distribution would become larger by 10% after the potential correction for the synchrotron component. This is well within the error bar shown in Figs. 4 and 5.
5 Conclusions
We have presented Keck interferometer measurements at 2.2 m for 4 new Type 1 AGNs, as well as re-observations of NGC4151. Putting these together with the results from our previous targets and comparing these with the optical-infrared reverberation measurements, we have interpreted the observed high visibilities as an indication of the partial resolution of the dust sublimation region in each object.
We have argued that we can interpret the ratio of the interferometric effective ring radius of the inner dusty region to the reverberation -fit radius as an approximate probe of the steepness/flatness of the inner radial structure. It has been tentatively shown that this inner structure might possibly be related to the radio-loudness of the central engine.
The possible radio connection at least illustrates the important potential of this new exploration of the inner region. We are still limited in terms of the proximity to the central engine, since we are using the emission from dust grains which cannot survive at distances too close to the central UV source. However, the dust distribution in or around the sublimation region is still a direct probe of the physical structure of the accreting material at the best possible spatial resolution available so far. We plan to further explore the region with more interferometric measurements.
Acknowledgements.
The data presented herein were obtained at the W.M. Keck Observatory, which is operated as a scientific partnership among the California Institute of Technology, the University of California and the National Aeronautics and Space Administration (NASA). The Observatory was made possible by the generous financial support of the W.M. Keck Foundation. The Keck Interferometer is funded by NASA as part of its Exoplanet Exploration program. The United Kingdom Infrared Telescope is operated by the Joint Astronomy Centre on behalf of the Science and Technology Facilities Council of the U.K. We thank N. Teamo and J. C. Pelle for kindly providing the pre-imaging data. This work has made use of services produced by the NASA Exoplanet Science Institute at the California Institute of Technology. This research has also made use of the NASA/IPAC Extragalactic Database (NED) which is operated by the Jet Propulsion Laboratory, California Institute of Technology, under contract with NASA. SH acknowledges support by Deutsche Forschungsgemeinschaft (DFG) in the framework of a research fellowship (“Auslandsstipendium”).References
- Beckert et al. (2008) Beckert, T., Driebe, T., Hönig, S. F., & Weigelt, G. 2008, A&A, 486, L17
- Burtscher et al. (2009) Burtscher, L., Jaffe, W., Raban, D., et al. 2009, ApJ, 705, L53
- Colavita & Wizinowich (2003) Colavita, M. M. & Wizinowich, P. L. 2003, in Presented at the Society of Photo-Optical Instrumentation Engineers (SPIE) Conference, Vol. 4838, Society of Photo-Optical Instrumentation Engineers (SPIE) Conference Series, ed. W. A. Traub, 79–88
- Condon et al. (1998) Condon, J. J., Yin, Q. F., Thuan, T. X., & Boller, T. 1998, AJ, 116, 2682
- Courvoisier et al. (1988) Courvoisier, T., Robson, E. I., Hughes, D. H., et al. 1988, Nature, 335, 330
- Cross et al. (2001) Cross, L. L., Wills, B. J., Hough, J. H., & Bailey, J. A. 2001, in Astronomical Society of the Pacific Conference Series, Vol. 227, Blazar Demographics and Physics, ed. P. Padovani & C. M. Urry, 140–+
- Das et al. (2005) Das, V., Crenshaw, D. M., Hutchings, J. B., et al. 2005, AJ, 130, 945
- Elvis et al. (1994) Elvis, M., Wilkes, B. J., McDowell, J. C., et al. 1994, ApJS, 95, 1
- Glass (2004) Glass, I. S. 2004, MNRAS, 350, 1049
- Impey et al. (1989) Impey, C. D., Malkan, M. A., & Tapia, S. 1989, ApJ, 347, 96
- Jaffe et al. (2004) Jaffe, W., Meisenheimer, K., Röttgering, H. J. A., et al. 2004, Nature, 429, 47
- Kishimoto et al. (2008) Kishimoto, M., Antonucci, R., Blaes, O., et al. 2008, Nature, 454, 492
- Kishimoto et al. (2009a) Kishimoto, M., Hoenig, S. F., Antonucci, R., et al. 2009a, A&A, 507, L57
- Kishimoto et al. (2007) Kishimoto, M., Hönig, S. F., Beckert, T., & Weigelt, G. 2007, A&A, 476, 713
- Kishimoto et al. (2009b) Kishimoto, M., Hönig, S. F., Tristram, K. R. W., & Weigelt, G. 2009b, A&A, 493, L57
- Koratkar & Gaskell (1991) Koratkar, A. P. & Gaskell, C. M. 1991, ApJS, 75, 719
- Krolik & Begelman (1988) Krolik, J. H. & Begelman, M. C. 1988, ApJ, 329, 702
- Kukula et al. (1996) Kukula, M. J., Holloway, A. J., Pedlar, A., et al. 1996, MNRAS, 280, 1283
- Martel (1998) Martel, A. R. 1998, ApJ, 508, 657
- Meisenheimer et al. (2007) Meisenheimer, K., Tristram, K. R. W., Jaffe, W., et al. 2007, A&A, 471, 453
- Mundell et al. (2003) Mundell, C. G., Wrobel, J. M., Pedlar, A., & Gallimore, J. F. 2003, ApJ, 583, 192
- Nagar et al. (1999) Nagar, N. M., Wilson, A. S., Mulchaey, J. S., & Gallimore, J. F. 1999, ApJS, 120, 209
- Pott et al. (2010) Pott, J., Malkan, M. A., Elitzur, M., et al. 2010, ApJ, 715, 736
- Sanders et al. (1989) Sanders, D. B., Phinney, E. S., Neugebauer, G., Soifer, B. T., & Matthews, K. 1989, ApJ, 347, 29
- Schlegel et al. (1998) Schlegel, D. J., Finkbeiner, D. P., & Davis, M. 1998, ApJ, 500, 525
- Schmitt et al. (2001) Schmitt, H. R., Ulvestad, J. S., Antonucci, R. R. J., & Kinney, A. L. 2001, ApJS, 132, 199
- Sitko & Zhu (1991) Sitko, M. L. & Zhu, Y. 1991, ApJ, 369, 106
- Smith et al. (1987) Smith, P. S., Balonek, T. J., Elston, R., & Heckert, P. A. 1987, ApJS, 64, 459
- Suganuma et al. (2006) Suganuma, M., Yoshii, Y., Kobayashi, Y., et al. 2006, ApJ, 639, 46
- Swain et al. (2003) Swain, M., Vasisht, G., Akeson, R., et al. 2003, ApJ, 596, L163
- Tingay et al. (2003) Tingay, S. J., Jauncey, D. L., King, E. A., et al. 2003, PASJ, 55, 351
- Tristram et al. (2007) Tristram, K. R. W., Meisenheimer, K., Jaffe, W., et al. 2007, A&A, 474, 837
- Tristram et al. (2009) Tristram, K. R. W., Raban, D., Meisenheimer, K., et al. 2009, A&A, 502, 67
- Ulvestad & Wilson (1984) Ulvestad, J. S. & Wilson, A. S. 1984, ApJ, 285, 439
- Ulvestad et al. (1998) Ulvestad, J. S., Wrobel, J. M., & Carilli, C. L. 1998, in Astronomical Society of the Pacific Conference Series, Vol. 144, IAU Colloq. 164: Radio Emission from Galactic and Extragalactic Compact Sources, ed. J. A. Zensus, G. B. Taylor, & J. M. Wrobel, 199–+
- Ulvestad et al. (1999) Ulvestad, J. S., Wrobel, J. M., & Carilli, C. L. 1999, ApJ, 516, 127
- White et al. (1997) White, R. L., Becker, R. H., Helfand, D. J., & Gregg, M. D. 1997, ApJ, 475, 479
- Wills (1989) Wills, B. J. 1989, in Lecture Notes in Physics, Berlin Springer Verlag, Vol. 334, BL Lac Objects, ed. L. Maraschi, T. Maccacaro, & M.-H. Ulrich, 109–+
- Winkler et al. (1992) Winkler, H., Glass, I. S., van Wyk, F., et al. 1992, MNRAS, 257, 659
- Wittkowski et al. (2004) Wittkowski, M., Kervella, P., Arsenault, R., et al. 2004, A&A, 418, L39