Dense Clumps in Giant Molecular Clouds in the Large Magellanic Cloud:
Density and Temperature Derived from 13CO() Observations
Abstract
In order to precisely determine temperature and density of molecular gas in the Large Magellanic Cloud, we made observations of optically thin 13CO() transition by using the ASTE 10m telescope toward 9 peaks where 12CO() clumps were previously detected with the same telescope. The molecular clumps include those in giant molecular cloud (GMC) Types I (with no signs of massive star formation), II (with HII regions only), and III (with HII regions and young star clusters). We detected 13CO() emission toward all the peaks and found that their intensities are 3 – 12 times lower than those of 12CO(). We determined the intensity ratios of 12CO() to 13CO(), , and 13CO() to 13CO(), , at 45 resolution. These ratios were used for radiative transfer calculations in order to estimate temperature and density of the clumps. The parameters of these clumps range kinetic temperature = 15 – 200 K, and molecular hydrogen gas density = 8 – 7 cm-3. We confirmed that the higher density clumps show higher kinetic temperature and that the lower density clumps lower kinetic temperature at a better accuracy than in the previous work. The kinetic temperature and density increase generally from a Type I GMC to a Type III GMC. We interpret that this difference reflects an evolutionary trend of star formation in molecular clumps. The and kinetic temperature of the clumps are well correlated with H flux, suggesting that the heating of molecular gas = – cm-3 can be explained by stellar FUV photons.
1 Introduction
Star formation is of fundamental importance in understanding the evolution of galaxies. Stars are formed in dense clumps of giant molecular clouds (GMCs), and kinetic energy and heavy elements are ejected from stars back into the interstellar medium (ISM) through stellar winds and supernova explosions. This cycle enriches metal abundance in the ISM and drives the evolution of galaxies both physically and chemically. It is therefore important to better understand the evolution of GMCs, the principle sites of the star formation in galaxies.
The Large Magellanic Cloud (LMC) is the most suitable galaxy to study star formation and natal GMCs because of its ideal location. The LMC offers a unique opportunity to achieve the highest resolution due to its proximity, 50kpc (Keller & Wood, 2006; Feast, 1999), and nearly face-on position with an inclination angle of 35°(van der Marel & Cioni, 2001). This also provides an advantage of less contamination along the line of sight. The LMC shows active on-going star formation and many massive young clusters are being formed (Hodge, 1961). In the LMC, the metallicity is a factor of 3 – 4 lower (Dufour, 1984; Rolleston et al., 2002) and the gas-to-dust ratio is a factor of 4 higher (Koornneef, 1984) than values for the solar neighborhood. The far-ultraviolet (FUV) radiation field is more intense in the LMC than in the Milky Way (Israel et al., 1986) and the visual extinction is a few times lower than in the Milky Way. These influence the physical properties of GMCs, and may affect the initial condition of star and cluster formation.
The first spatially resolved surveys of GMCs in the whole LMC were made by the NANTEN 4m telescope in the 12CO() transition (Fukui et al., 1999, 2001, 2008; Mizuno et al., 2001). These surveys revealed the distribution of the GMCs within a single galaxy at a 40 pc resolution. Fukui et al. (2008) derived the physical properties, such as size, line width, and virial mass, of the GMCs, and found that the 12CO() luminosity and virial mass of the clouds show a good correlation. Assuming that the clouds are in virial equilibrium, Fukui et al. (2008) derived the factor, conversion factor of the 12CO() intensity to total molecular column density. The derived factor was similar to that of other Local Group galaxies, such as Small Magellanic Cloud, M31, M33, IC10, and Milky Way, and the GMC mass distribution, dN/dM, was also similar to that of M31, M33, and IC10, suggesting that GMCs in the Local Group galaxies have similar properties (Fukui & Kawamura, 2010; Blitz et al., 2007). Comparisons between the GMCs and signs of star formation such as HII regions and young stellar clusters were used to classify GMCs into three types in terms of star formation activities (Fukui et al., 1999; Kawamura et al., 2009); Type I shows no signs of massive star formation, Type II associated with only small HII regions, and Type III associated with both HII regions and young stellar clusters, and these Types are interpreted as an evolutionary sequence (Kawamura et al., 2009). Comparative studies of the 12CO() to HI ratio are also a key to understand the evolution of GMCs and the GMC formation via conversion of HI into H2. Wong et al. (2009) made two dimensional, i.e., spatial, comparisons of the second NANTEN 12CO() survey (Fukui et al., 2008) with HI data set combined ATCA and Parkes Telescope surveys (Kim et al., 2003). They found that significant HI column densities ( 1021 cm-2) and peak brightness temperatures ( 20K) are necessary but not sufficient conditions for CO detection. Fukui et al. (2009) compared the three dimensional data cubes, including a velocity axis in addition to the two spatial axes. They found that GMCs are associated with HI envelopes on scales of 50 – 100pc, and the HI envelopes may be in dynamical equilibrium or may be accreting onto GMCs to increase the mass via HI – H2 conversion. Subsequently a higher resolution (45 10 pc at 50kpc) survey of 12CO() molecular cloud with the Mopra 22m telescope, the Magellanic Mopra Assessment (MAGMA), revealed a more detailed distribution of the 12CO() emission in the individual GMCs (Hughes et al., 2010). Hughes et al. (2010) presented that the physical properties of star-forming GMCs are very similar to the properties of GMCs without signs of massive star formation.
The physical properties such as kinetic temperature and density of the molecular gas in the LMC have been investigated in the higher- transitions (, , , ) of CO (e.g., Sorai et al., 2001; Johansson et al., 1998; Heikkilä et al., 1999; Israel et al., 2003; Bolatto et al., 2005; Kim et al., 2004; Kim, 2006; Nikolić et al., 2007; Pineda et al., 2008; Mizuno et al., 2010). Some authors (e.g., Bolatto et al., 2005; Nikolić et al., 2007) suggest two-component model especially for molecular clouds closely associated with HII regions. Most of these studies targeted extraordinary HII regions so the sample is limited. Minamidani et al. (2008) have carried out 12CO() observations of 6 GMCs, including one Type I, two Type II, and three Type III GMCs, in the LMC with the ASTE 10m telescope at a spatial resolution of 5 pc, and identified 32 molecular clumps. These data were combined with available 12CO() and 13CO() data and compared with LVG calculations for 13 clumps. The results show that these clumps range from cool ( 10 – 30K) to warm ( 30 – 200K) in kinetic temperature, and warm clumps range from less dense ( 103 cm-3) to dense ( 103.5 – 105 cm-3) in density, whereas only lower limits in kinetic temperature were obtained in the warm clumps. Most recently, Mizuno et al. (2010) have made 12CO() observations of the N159 region with the NANTEN2 4m sub-millimeter telescope. These data were used in LVG analysis combined with 12CO(), (), (), and () as well as the isotope transitions of 13CO(), (), (), and (). The kinetic temperatures and densities were found to be 70 – 80K and 3 cm-3 in N159W and N159E, and 30K and 1.6 cm-3 in N159S, indicating that an analysis including higher- transitions of both 12CO and 13CO can better constrain kinetic temperature and density.
In the present study, we aim to determine temperature and density of molecular hydrogen ,H2, gas in all three GMC types, Type I, II, and III, with higher accuracy by combining the 13CO() data newly obtained by using the ASTE telescope and 12CO() and 13CO() data obtained with the ASTE and the SEST telescopes, respectively. All our data sets were convolved to the same resolution of 45, corresponding to 10pc at a distance of the LMC, 50kpc (Feast, 1999), and the large velocity gradient (LVG) calculations are performed to estimate the line intensities.
Section 2 describes observations of 13CO() transition. Section 3 shows the observational results and describes ancillary data sets. Section 4 shows data analysis, and in Section 5, we discuss the physical properties of clumps and evolutionary sequence of GMCs. In Section 6, we present the summary.
2 13CO() observations
2.1 Selection of molecular clumps
The present targets are chosen from the 32 molecular clumps identified by the 12CO() observations of the six GMCs in the LMC with the ASTE 10m telescope at a spatial resolution of 5pc (Minamidani et al., 2008). The six GMCs were chosen from the NANTEN catalog of 12CO() GMCs compiled by Fukui et al. (2008), and they were three Type III GMCs, two Type II GMCs, and one Type I GMC.
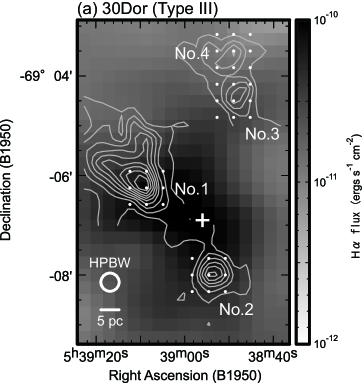
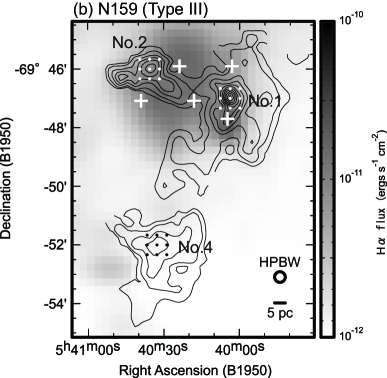
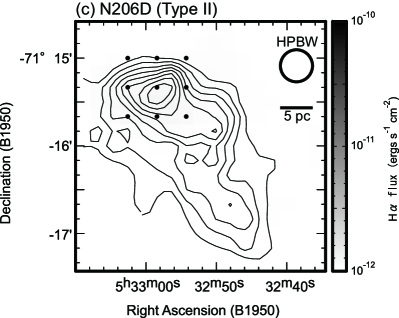
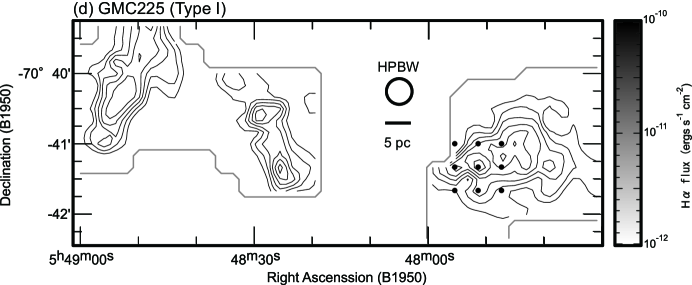
In the present study, we selected 9 molecular clumps in the Type III GMCs, LMC N J0538-6904 (the 30 Doradus region; 4 clumps), and LMC N J0540-7008 (the N159 region; 3clumps), Type II GMC, LMC N J0532-7114 (the N206D region; 1 clump), and Type I GMC, LMC N J0547-7041 (the GMC225 region; 1 clump). The observed clumps and their coordinates are listed in Table 1. Hereafter, the region names, which are parentheses above or column (4) in Table 1, and the numbers of clumps are used to identify clumps, as same as that in Minamidani et al. (2008). Among 9 molecular clumps, four clumps are in the 30 Doradus region, 30 Doradus No. 1, No. 2, No. 3, and No. 4, three clumps are in the N159 region, N159 No. 1, No. 2, and No. 4, one clump is in the N206D region, N206D No. 1, and one clump is in the GMC225 region, GMC225 No. 1.
2.2 13CO() observations
The observations of 13CO() transition at 330.587960GHz were made with the ASTE 10-m telescope at Pampa la Bola in Chile in September, 2006. In this term, a single cartridge type double-side-band (DSB) SIS receiver, SC345 (Kohno, 2005), was installed and the XF-type digital autocorrelator (Sorai et al., 2000) was operated in the wideband mode, providing a bandwidth of 512 MHz with 1024 channels. These correspond to a velocity coverage of 450 km s-1 and the resolution of 0.45 km s-1 at 330GHz. The half power beam width was 23 at 330GHz, and this corresponds to 5.6pc at 50kpc. We made 33 points mapping observations with position switching method with a 20 grid spacing toward the peaks of 12CO() clumps detected by Minamidani et al. (2008). Figure 1 shows the observed positions of the peaks of the 12CO() clumps named 30 Doradus No. 1, No. 2, No. 3, No. 4, N159 No. 1, No. 2, No. 4, N206D No. 1, and GMC225 No. 1. The typical system temperature including the atmosphere was 260K in DSB. The pointing accuracy was measured to be better than 5 in peak to peak by periodically observing a CO point source R Dor in the 12CO() transition every 2 hours. The spectral intensities were calibrated by employing the standard room-temperature chopper-wheel method. We observed Ori-KL and M17SW in the 13CO() transition to check the stability of the intensity calibration, and the intensity variation during these observations was less than 12%.
The observed antenna temperature varies with the side-band ratio () or the image rejection ratio ():
where is the antenna temperature in the single side-band (SSB). We measured the antenna temperature, , and image rejection ratio (), simulteneously, with the newly installed 2SB receiver, CATS345 (Ezawa et al., 2008; Inoue et al., 2008), to the ASTE telescope in 2008, and derived the SSB antenna temperatures, , of IRC+10216 [R.A.(1950) = , Dec.(1950) = +13°30′40″] and N159W [R.A. (B1950) = , Dec. (B1950) = -69°47′00.0″]. From the observation of IRC+10216, the observed velocity integrated intensity, (), was 564 K km s-1, and the image rejection ratio, , was 62 (8 dB). This was consistent with the results of the laboratory evaluation (Inoue et al., 2008). The () was estimated to be 656 K km s-1. This value was compared with the data taken by CSO (Wang et al., 1994), and main beam efficiency at that moment was derived to be 0.700.06. From the observation of N159W, the observed antenna temperature, , was 1.830.04 K, and the image rejection ratio, , was 4.70.4 (7 dB). This was consistent with the results of the laboratory evaluation (Inoue et al. 2008). The SSB antenna temperature, , was estimated to be 2.220.06 K. We derive the main beam temperature of N159W to be 3.20.3 K. We scaled the observational data in 2006 to be consistent with this value. The achieved noise level ranges from 0.04 K to 0.18 K in the main beam temperature scale. These observations were made remotely from NAOJ and NRO in Japan, by using the network observation system N-COSMOS3 developed by NAOJ (Kamazaki et al., 2005).
3 Results & Data sets
3.1 13CO()
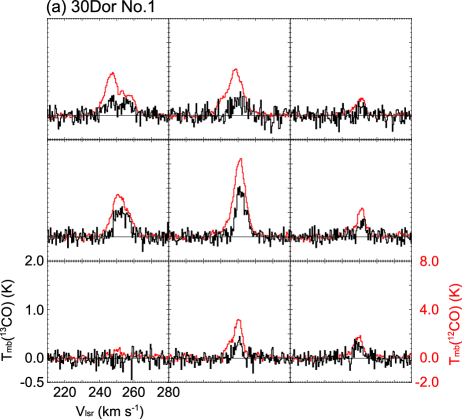
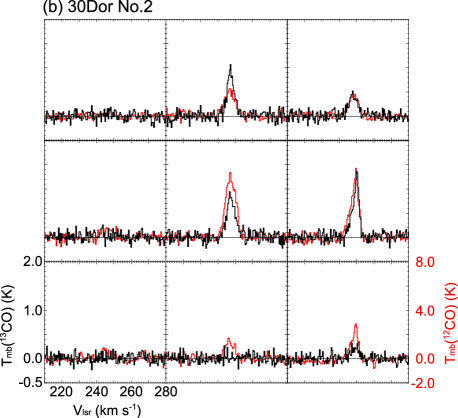
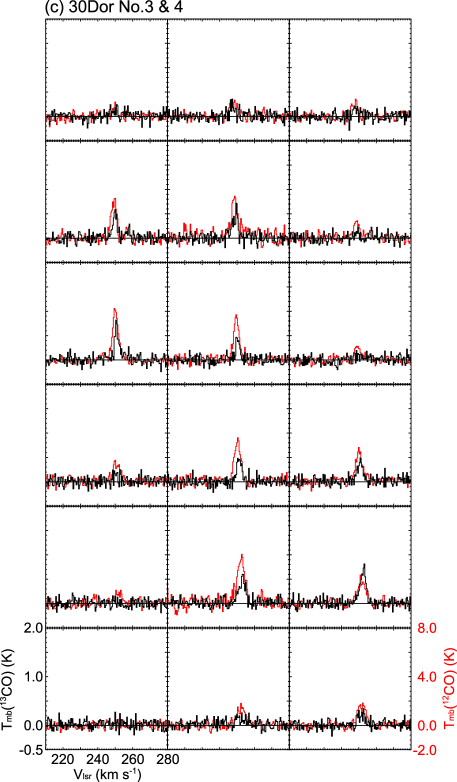
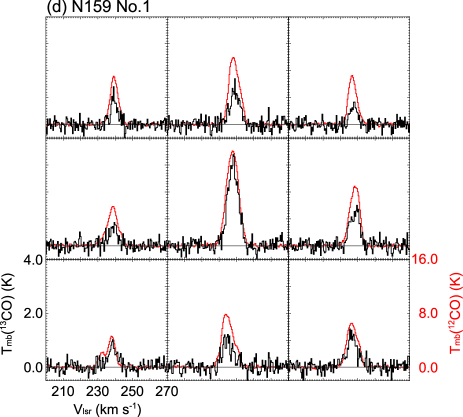
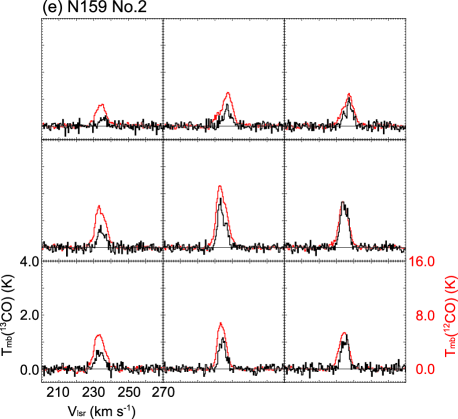
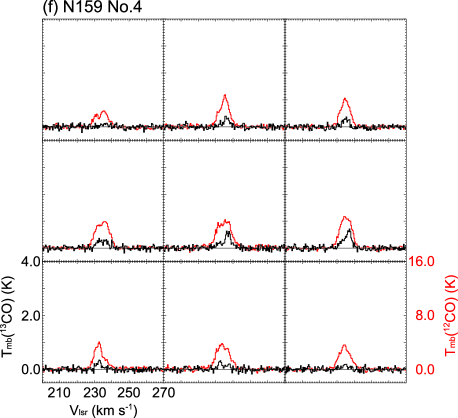
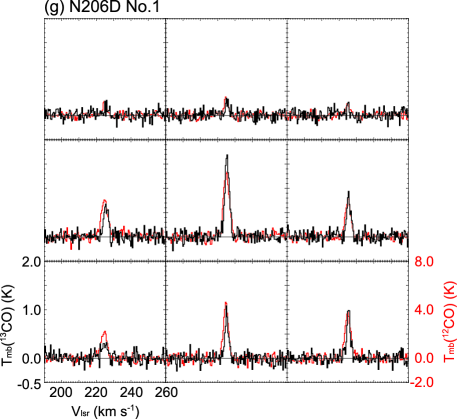
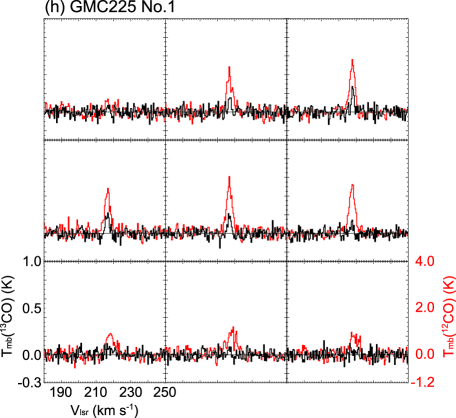
In Figure 2, 13CO() profile maps of each observed peak are presented with 12CO() spectra (Minamidani et al., 2008). The 13CO() intensities are 3 – 12 times lower than those of 12CO(). The peak velocities are consistent with those of 12CO(), and the line widths are factor of 0.7 – 1.0 smaller than those of 12CO(). Their line parameters at the peak positions of 12CO() are summarized in Table 1. Detailed descriptions explaining the characteristics of each observed 12CO() peak are given in Appendix.
3.2 12CO()
We use the 12CO() data published by Minamidani et al. (2008), which were taken by the ASTE telescope with an angular resolution of 22 . We measured the antenna temperature, , and image rejection ratio (), simulteneously, with the newly installed 2SB receiver, CATS345 (Ezawa et al., 2008; Inoue et al., 2008), to the ASTE telescope in 2008, and derive the SSB antenna temperatures, , of IRC+10216 [R.A.(1950) = , Dec.(1950) = +13°30′40″] and N159W [R.A. (B1950) = , Dec. (B1950) = -69°47′00.0″]. From the observation of IRC+10216, the observed antenna temperature, , was 18.80.7 K, and the image rejection ratio, , was 223 (13 dB). This was consistent with the results of the laboratory evaluation (Inoue et al., 2008). The SSB antenna temperature, , was estimated to be 19.60.8 K. This value was compared with the data taken by CSO (Wang et al., 1994), and main beam efficiency at that moment was derived to be 0.600.02. From the observation of N159W, observed antenna temperature, , was 7.60.2 K, and image rejection ratio, , was 92 (10 dB). This was consistent with the results of the laboratory evaluation (Inoue et al. 2008). The SSB antenna temperature, , was estimated to be 8.40.2 K. We derive the main beam temperature of N159W to be 13.90.7 K. We scaled the observational data taken in 2004 (Minamidani et al., 2008) to be consistent with this value.
3.3 13CO()
4 Data analysis
4.1 Derivation of line intensity ratios
The spatial resolutions of the present CO data vary depending on the telescope and frequency. The angular resolutions of 12CO() and 13CO() data observed by the ASTE telescope are 22 and 23, respectively, while that of 13CO() data observed by the SEST telescope are 45. These correspond to 5 pc and 10 pc, respectively, at 50kpc. We have convolved the 12CO() and 13CO() data into the 45 beam with a Gaussian smoothing function in order to derive physical properties of clumps whose sizes are around 10 pc.
We fitted Gaussians to each of the 12CO(), 13CO(), and 13CO() spectra with a single spectral peak. We derived the temperature peaks of the Gaussian curves, and the results are summarized in Table 2. The ratios of 12CO() to 13CO() (hereafter, ) and 13CO() to 13CO() (hereafter, ) are derived as the ratios of the peak values on a main beam temperature scale. The errors of and are estimated to be 20 – 27% and 25 – 30%, respectively. A summary of these main beam temperature ratios and their accuracies are also presented in Table 2. These ratios will be compared with numerical calculations of radiative transfer in the LVG approximation to derive constraints on density and temperature .
4.2 LVG analysis
4.2.1 Calculations of a LVG model
In order to estimate physical properties of molecular gas, we have performed an LVG analysis (Goldreich & Kwan, 1974) of the CO rotational transitions in the same way as described in Minamidani et al. (2008). The LVG radiative transfer code simulates a spherically symmetric cloud of uniform density and temperature with a spherically symmetric velocity gradient proportional to the radius, and employs a Castor’s escape probability formalism (Castor, 1970). It solves the equations of statistical equilibrium for the fractional population of CO rotational levels at each density and temperature, because the level populations of CO are determined by both density and kinetic temperature of molecular hydrogen. It includes the lowest 40 rotational levels of the ground vibrational level and use the Einstein A coefficient and H2 collisional impact rate coefficients obtained from the Leiden Atomic and Molecular Database (LAMDA; Schöier et al., 2005).
We performed calculations of the fractional populations of the lowest 40 rotational levels of 12CO and 13CO in the ground vibrational state over a kinetic temperature range of = 5 – 200K and a density range of (H2) = 10 – 106 cm-3. We assumed that the fractional abundance of CO to H2 and the abundance ratio of 12CO to 13CO are 1.6 and 50, respectively (Mizuno et al., 2010; Blake et al., 1987).
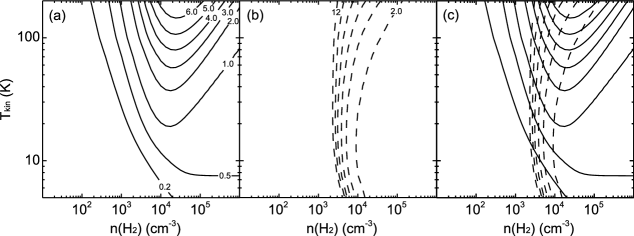
Figure 3 shows the general behavior of the loci of constant and constant in the density-temperature plane. The is the ratio of transitions which have different critical densities, and traces excitation of molecular gas. The is the ratio of transitions which have same critical densities and trace different column densities, and thus this ratio is a good tracer of column density and consequently volume density in wide temperature range. The combination of the two line ratios is nearly ”orthogonal” , so the density and kinetic temperature are well constrained. This is different from the case of Minamidani et al. (2008). Minamidani et al. (2008) used the combination of the ratios of 12CO() to 12CO() (here after, ) and 12CO() to 13CO() (here after, ), which does not constrain well the physical parameters for densities higher than 104 cm-3 (Minamidani et al., 2008).
4.2.2 Results of the LVG analysis
We summarize the input parameters for the 8 clumps in columns (3) – (5) of Table 3. The higher transition data have been convolved into the 45 beam with a Gaussian kernel as described in section 4.1. The velocity gradient, , of each clump is derived from 12CO() data (Minamidani et al., 2008).
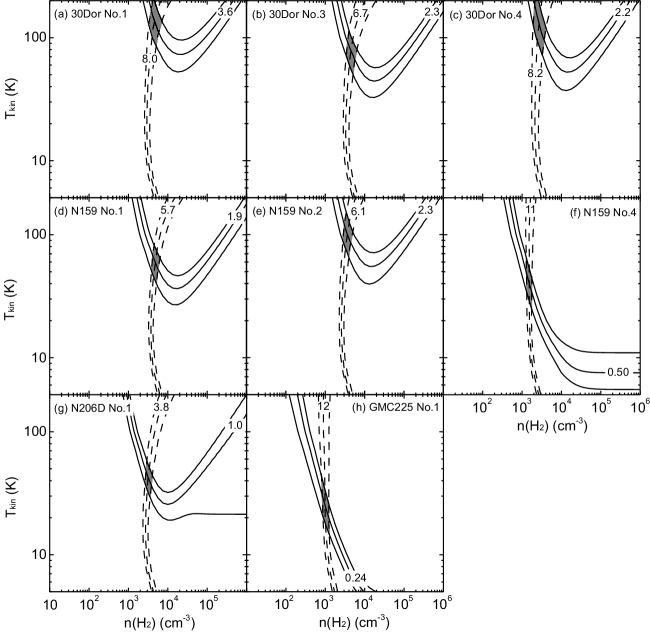
Figure 4 shows the results of the LVG analysis for the 8 clumps. The horizontal axis is molecular hydrogen density, (H2), and the vertical axis is the gas kinetic temperature, . Solid lines represent and dashed lines represent . The hatched areas indicate the overlap regions of these two ratios within the errors. In Table 3, we present the estimated densities and kinetic temperatures of the clumps.
The derived density and kinetic temperature are well determined compared to the previous work based on the combination of and (Minamidani et al., 2008), especially for the clumps in the warm Type III GMCs. The results for the three clumps in the N159 region show a good agreement with the results of Mizuno et al. (2010) who employed the calculations using high- transitions of .
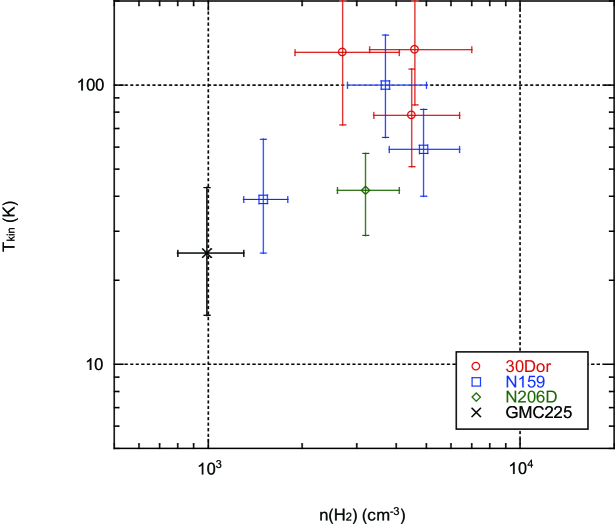
Figure 5 summarizes the derived kinetic temperatures () and densities ((H2)) of all 8 clumps. These range from 15 to 200 K in kinetic temperature and from 8 to 7 cm-3 in density. We found clumps in the 30 Doradus and N159 regions are warm and dense, except for N159 No. 4 (N159S), which is less dense and has an intermediate kinetic temperature. The clump in N206D, N206D No. 1, is dense and has an intermediate kinetic temperature. The clump in GMC225, GMC225 No. 1, is less dense and cold. The derived kinetic temperature and density denote the same tendency as indicated by Minamidani et al. (2008) with improved accuracies. For example, the kinetic temperature and density of the N159 No. 1 (N159W) clump are determined with the accuracies of 39% and 31%, respectively, in the present work, although, in the previous study (Minamidani et al., 2008), only lower limit of the kinetic temperature (30K) and the two orders of magnitude uncertainty of density (3 – 8 cm-3) were suggested for this clump.
4.2.3 Discussion on the LVG results
There are two distinctive aspects in the present work. One is the continuous coverage of molecular clump samples in the all types of GMCs, Type I, II, and III, which are interpreted as an evolutionary sequence of GMCs (Kawamura et al. 2009). The other is the combinations of line ratios used in the LVG analysis. The 13CO(), 12CO(), and 13CO() transitions are used for the analysis and the 12CO() transition is not included in this work. This improves the accuracies of kinetic temperature and density of molecular clumps as described by Mizuno et al. (2010).
We also performed LVG calculations with the parameters used by Minamidani et al. (2008), which are (CO) = 3.0 and abundance ratio of 12CO to 13CO of 20, 25, and 30. The kinetic temperatures and densities of clumps estimated from and with these parameters were well determined. This indicates that the combinations of line intensity ratios used in this paper, and , are suitable to determine physical properties of molecular clumps in wide ranges.
The N159 region is the most active site of high mass star formation in the Large Magellanic Cloud. This has been observed in various molecular transitions by various telescopes located in the southern hemisphere, and many authors paid their efforts to determine the physical properties and chemical compositions via LVG analyses (e.g., Mizuno et al., 2010; Pineda et al., 2008; Minamidani et al., 2008). In Table 4, some of the recent LVG results of the N159 region are summarized. The kinetic temperature and density derived in this work are consistent within errors with that derived by Mizuno et al. (2010) and Pineda et al. (2008), which are determined with high accuracies based on data of higher transitions of and .
4.3 Comparison of line intensity ratios and physical properties with H flux
We use the H data (Kim et al., 1999) toward the present clouds using the method given in Appendix B in Minamidani et al. (2008). The typical background level of H flux is 10-12 ergs s-1 cm-2 at the 40 scale, which is a pixel scale of the H data. These data were regridded into the 13CO() data grids. The fluxes toward each 13CO() peak are listed in Tables 2 and 3.
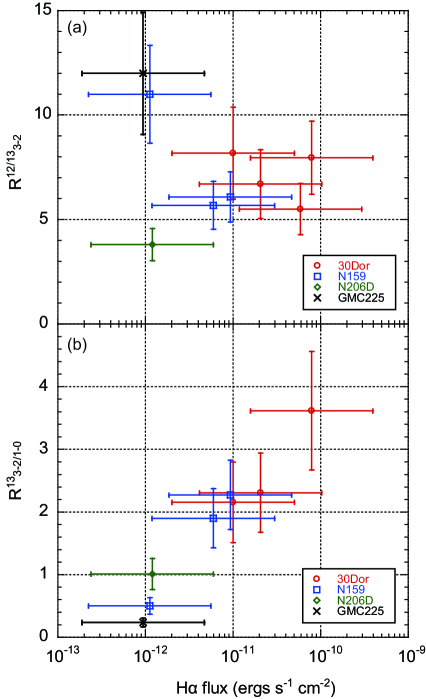
Figure 6 shows plots of and as functions of H flux. It is clear that is well correlated with the H flux with a correlation coefficient of 0.98, and there is no clear correlation between and H flux.
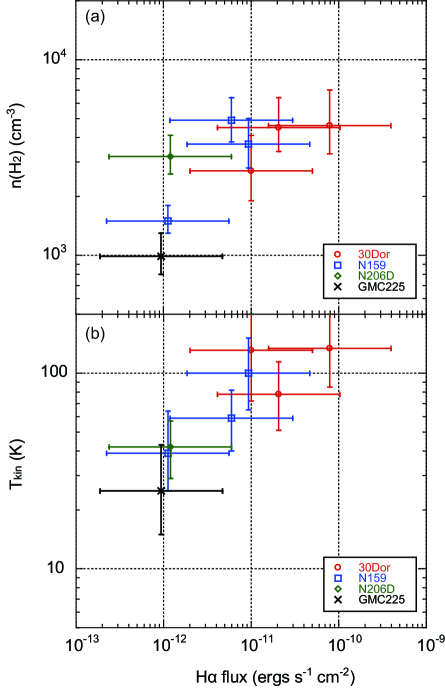
Figure 7 shows plots of molecular hydrogen densities, (H2), and kinetic temperatures, , as functions of H flux. For dense clumps these are distributed over a wide range of H flux (10-12 – 10-10 ergs s-1 cm-2), although lower density clumps are located only where H flux is weak ( 10-12 ergs s-1 cm-2). The of clumps are well correlated with the H flux with a correlation coefficient of 0.81. We note that the size scale here is 10pc and the good correlation may not hold at smaller scales where local extinction of H becomes important (e.g., Mizuno et al., 2010). These results suggest that far-ultraviolet (FUV) photons heat molecular gas whose density is 103 – 104 cm-3. This will be discussed in the following section.
5 Discussions
5.1 Evolutions of GMC and clump
The results of our LVG analysis show that the clump kinetic temperatures, , range from cool ( 15K) to warm ( 200K) and the densities, (H2), from less dense ( 8 cm-3) to dense ( 7 cm-3). These large variations in the physical properties reflect the different characteristics of the GMCs according to their Types I, II, and III, where Type I shows no signs of massive star formation, Type II associated with only small HII regions, and Type III associated with both HII regions and young stellar clusters, and these Types are interpreted as an evolutionary sequence (Kawamura et al., 2009). A clump in a Type I GMC, GMC225 No. 1, has the lowest density ((H2) 0.99 cm-3 ) and lowest temperature ( 25K). A clump in Type II GMC, N206D No. 1, is a dense ((H2) 3.2 cm-3) clump and has intermediate temperature ( 42K). Clumps in Type III GMCs, except for N159 No. 4 (N159S) clump, are dense ((H2) 4 cm-3) and warm ( 50K) clumps. The physical properties are generally correlated with the star formation activity of GMCs. The and (H2) increase with the evolution of GMCs from Type I to III. This trend becomes clearer with the present determination of and (H2) than that of the previous study (Minamidani et al., 2008), although the number of clump samples is smaller than that.
The N159 No. 4 (N159S) clump is a part of a Type III GMC, LMC N J0540-7008 (Kawamura et al., 2009). This GMC is quite large and elongated from north to south (275pc 53pc, P.A. = 87°; Fukui et al., 2008). Young clusters and large HII regions are associated with the northern part of this GMC, and in the southern part, where N159 No. 4 (N159S) is located, young clusters and large HII regions are not associated with. The N159 No. 4 (N159S) clump is less dense ((H2) 1.5 cm-3) and has intermediate temperature ( 39K). These properties are quite similar to that of the clumps in Type I or II GMCs, as discussed by Minamidani et al. (2008) and Mizuno et al. (2010). Comparison of the properties of molecular clumps with signs of star formation activities, such as young star clusters and H emission, at high spatial resolution will establish the classification of molecular clumps, whose sizes are 7 pc (Minamidani et al., 2008). Because the size of clusters in the LMC are distributed in a range from 0.1 – 10 pc (Hunter et al., 2003), which is smaller/similar size than the typical size of molecular clumps ( 7 pc), it is important to compare molecular clumps with signs of star/clustar formation to understand the evolution of molecular clumps leading to the star/cluster formation.
5.2 Heating of the molecular gas in the LMC
As shown in the previous sections, the is well correlated with H flux at a 10 pc scale, and the molecular gas kinetic temperatures () are also well correlated with Hα flux. These present findings suggest that the heating of molecular gas whose densities are 103 – 104 cm-3 may be dominated by far-ultraviolet (FUV) photons. The intense FUV field controls the physical and chemical processes in the ISM such as formation and destruction of molecules as well as ionization. These regions have been modeled as photo-dissociation regions (PDRs) or photon-dominated regions (PDRs) (e.g., Tielens & Hollenbach, 1985; Kaufman et al., 1999; Röllig et al., 2007, and references their in).
The FUV flux () is estimated as 3500 in the 30 Doradus region (Bolatto et al., 1999; Poglitsch et al., 1995; Werner et al., 1978; Israel & Koornneef, 1979) and 300 for the N159 region (Bolatto et al., 1999; Israel et al., 1996; Israel & Koornneef, 1979). The gas density is estimated to be (1 – 5) cm-3 for these regions. The PDR surface temperature is 400 K for the 30 Doradus region and 200 K for the N159 region from Figure 1 of Kaufman et al. (1999). The PDR gas temperature is relatively constant from the cloud surface to a depth where either heating or cooling changes significantly. The heating is generally dominated by the grain photoelectric heating (Kaufman et al., 1999), and then dust attenuation of FUV flux controls the thermal structure, where the typical size scale is 0.1 – 2 pc. These suggest that the effect of FUV heating of molecular gas seems to be local and direct phenomena.
The warm region can become larger under low-metallicity or high gas-to-dust ratio environments. These temperatures are basically consistent with the kinetic temperatures () of the warm clumps in the present sample if beam dilution by the present resolution, 10 pc, is taken into account.
5.3 Substructures inferred by the 13CO() observations
The 13CO() intensities are 3 – 12 times lower than those of 12CO() transition, and the line intensity ratios of 12CO() to 13CO(), . These vary not only from clump to clump but also inside of each clump. In the some clumps, clear two velocity components are detected in the 13CO() transition. These suggest some internal structures.
Mizuno et al. (2010) showed that the molecular distribution of the N159 No. 1 (N159W) clump in the 12CO() transition is similar to that of the Carinae northern cloud in the 12CO() emission line smoothed to 5 pc resolution. The original data of Carinae northern cloud has a 2 pc resolution and several substructures are identified (Yonekura et al., 2005). This supports the existence of internal structures inside of 5 pc scale molecular clumps, and indicates that these internal structures can be resolved in the CO transitions with high spatial resolution observations.
Subsequent observations of Carinae northern cloud using a high density tracer such as H13CO+() at a high spatial resolution, resulted in the detection of high density molecular cores whose sizes are less than 1 pc (Yonekura et al., 2005). In the LMC, some initial interferometric observations of high density tracers, such as HCO+ and NH3, were made with ATCA, using resolutions of 6 – 19 corresponding to 1.4 – 5 pc at 50 kpc (e.g., Wong et al., 2006; Ott et al., 2008, 2010). Ott et al. (2008) detected two peaks in the HCO+() transition in the N159W region. Further systematic detailed observations using high density tracers at higher resolution, with ALMA for instance, should be important for probing the initial conditions of star/cluster formation.
6 Summary
We have made 3 3 points mapping observations in the 13CO() transition at 330 GHz using the ASTE 10m telescope toward 9 peaks of 12CO() clumps, which cover all types of GMCs, Type I, II, and III, which are interpreted as an evolutionary sequences of GMCs. We have detected 13CO() emission from all peaks and their intensities are 3 – 12 times lower than those of 12CO(). From this, : We have derived the intensity ratios of 12CO() to 13CO(), , and 13CO() to 13CO(), , at 45 resolution, and have compared these results with the LVG radiative transfer calculations in order to estimate kinetic temperatures, , and densities, (H2), of the 8 clumps. The clumps show = 15 – 200 K and (H2) = 8 – 7 cm-3. The H flux toward these clumps is well correlated with the 13CO()/13CO() ratio, , and with the kinetic temperatures, , of the clumps. Dense clumps are distributed in a wide range of H flux (10-12 – 10-10 ergs s-1 cm-2), although lower density clumps are located only where H flux is weak ( 10-12 ergs s-1 cm-2). We found that clumps in the 30 Doradus and N159 regions (Type III GMCs) are warm and dense, except for N159 No. 4 (N159S), which is less dense and has intermediate kinetic temperature. The clump in N206D (Type II GMC), N206D No. 1, is dense and has also intermediate kinetic temperature. The clump in GMC225 (Type I GMC), GMC225 No. 1, is less dense and cold. We suggest that differences of these clump properties largely reflect an evolutionary sequence of GMCs and molecular clumps. The kinetic temperatures () and densities ((H2)) of molecular clumps increase generally with the evolution of GMCs and molecular clumps. The and kinetic temperatures () are well correlated with H flux, suggesting that the heating of molecular gas whose densities ((H2)) = 103 – 104 cm-3 is dominated by FUV photons. The calculations of PDR models are consistent with this suggestion.
Appendix A Detailed descriptions of each clump
Detailed descriptions of characteristics of each clump are presented in the following.
30 Doradus No. 1 (30Dor-10) (Figure 2a)
The measured noise level of 13CO() spectra in this region is 0.10 K rms at 0.45 km s-1 velocity resolution. The spatial extent and the velocity range of the 13CO() emission are well correlated to those of the 12CO() emission. The ratios of integrated intensities of 12CO() to 13CO() (hereafter ) are relatively small ( 6) at the western position and relatively large ( 19) at the northern position.
30 Doradus No. 2 (30Dor-12) (Fig. 2b)
The measured noise level of 13CO() spectra in this region is 0.09 K rms at 0.45 km s-1 velocity resolution. The spatial extent and the velocity range of 13CO() emission are well correlated to those of the 12CO() emission. at the northern position is 3, the smallest value among this clump, and is larger than 15 at the southern position.
30 Doradus No. 3 & No. 4 (30Dor-06) (Fig. 2c)
The southern part corresponds to No.3 clump and the northern part corresponds to No.4 clump. The measured noise level of 13CO() spectra in this region is 0.08 K rms at 0.45 km s-1 velocity resolution. The spatial extent and the velocity range of the 13CO() emission are well correlated to those of the 12CO() emission.
N159 No. 1 (N159W) (Fig. 2d)
The measured noise level in this region is 0.18 K r.m.s. at 0.45 km s-1 velocity resolution. The spatial extent and the velocity range of the 13CO() emission are well correlated to those of the 12CO() emission. shows the smallest value of 5 in this clump at the centeral position. At the south-west position, the is also small ( 6). At the north-west position, the ratio is large of 15.
N159 No. 2 (N159E) (Fig. 2e)
The measured noise level in this region is 0.11 K r.m.s. at 0.45 km s-1 velocity resolution. The spatial extent and the velocity range of the 13CO() emission are well correlated to those of the 12CO() emission. shows the smallest value of 5 in this clump at the western position and shows large value of 15 at the north-east position.
N159 No. 4 (N159S) (Fig. 2f)
The measured noise level in this region is 0.07 K r.m.s. at 0.45 km s-1 velocity resolution. The spatial extent and the velocity range of the 13CO() emission are well correlated to those of the 12CO() emission. Intensities of the 13CO() emission are fairly weak compared to those of the 12CO() emission. shows the smallest value of 12 in this clump at the center position. Two velocity components are detected in the 13CO() transition, although only one component is detected in the 12CO() transition.
N206D No. 1 (Fig. 2g)
The measured noise level in this region is 0.09 K r.m.s. at 0.45 km s-1 velocity resolution. The spatial extent and the velocity range of 13CO() emission are well correlated to those of 12CO() emission.
GMC225 No. 1 (Fig. 2h)
The measured noise level in this region is 0.04 K r.m.s. at 0.45 km s-1 velocity resolution. The spatial extent and the velocity range of 13CO() emission are well correlated to those of the 12CO() emission. Intensities of the 13CO() emission are 12 times weaker than those of the 12CO() emission.
References
- Blake et al. (1987) Blake, G. A., Sutton, E. C., Masson, C. R. , & Phillips, T. G. 1987, ApJ, 315, 621
- Blitz et al. (2007) Blitz, L., Fukui, Y., Kawamura, A., Leroy, A., Mizuno, N., & Rosolowsky, E. 2007, in Protostarts and Planets V, ed. B. Reipurth, D. Jewitt, & K. Keil, 81
- Bolatto et al. (1999) Bolatto, A. D., Jackson, J. M., & Ingalls, J. G. 1999, ApJ, 513, 275
- Bolatto et al. (2005) Bolatto, A. D., Israel, F. P., & Martin, C. L. 2005, ApJ, 633, 210
- Castor (1970) Castor, J. I. 1970, MNRAS, 149, 111
- Dufour (1984) Dufour, R. J. 1984, in IAU Symp. 108, Structure and Evolution of the Magellanic Clouds, eds. S. van den Bergh & K. S. de Boer, 353
- Ezawa et al. (2008) Ezawa, H. et al. 2008, Proc. SPIE, 7012, 701208
- Feast (1999) Feast, M. 1999, in IAU Symp. 190, New Views of the Magellanic Clouds, eds. Y.-H. Chu, N. B. Suntzeff, J. E. Hesser,& D. A. Bohlender, 542
- Fukui et al. (1999) Fukui, Y. et al. 1999, PASJ, 51, 745
- Fukui et al. (2001) Fukui, Y. et al. 2001, PASJ, 53, L41
- Fukui et al. (2008) Fukui, Y., Kawamura, A., Minamidani, T., Mizuno, Y., Kanai, Y., Mizuno, N., Onishi, T., Yonekura, Y., Mizuno, A., & Ogawa, H. 2008, ApJS, 178, 56
- Fukui et al. (2009) Fukui, Y. et al. 2009, ApJ, 705, 144
- Fukui & Kawamura (2010) Fukui, Y., & Kawamura, A. 2010, ARA&A, 48, 547
- Goldreich & Kwan (1974) Goldreich, P. & Kwan, J. 1974, ApJ, 189, 441
- Heikkilä et al. (1999) Heikkilä, A., Johansson, L. E. B., & Olofsson, H. 1999, A&A, 344, 817
- Hodge (1961) Hodge, P. W. 1961, ApJ, 133, 413
- Hughes et al. (2010) Hughes, A., et al. 2010, MNRAS, 406, 2065
- Hunter et al. (2003) Hunter, D. A., Elmegreen, B. G., Dupuy, T. J., & Mortonson, M. 2003, AJ, 126, 1836
- Inoue et al. (2008) Inoue, H., Muraoka, K., Sakai, T., Endo, A., Kohno, K., Asayama, S., Noguchi, T., and Ogawa, H., 2008, Proc. of 19th Intern. Symp. Space THz Technolgy, ed. W. Wild, 281
- Israel & Koornneef (1979) Israel, F. P. & Koornneef, J. 1979, ApJ, 230, 390
- Israel et al. (1986) Israel, F. P., de Graauw, Th., van de Stadt, H., & de Vries, C. P. 1986, ApJ, 303, 186
- Israel et al. (1996) Israel, F. P., Maloney, P. R., Geis, N., Herrmann, F., Madden, S. C., Poglitsch, A., & Stacey, G. J. 1996, ApJ, 465, 738
- Israel et al. (2003) Israel, F. P., de Graauw, Th., Johansson, L. E. B., Booth, R. S., Boulanger, F., Garay, G., Kutner, M.L., Lequeux, J., Nyman, L.-Å., & Rubio, M. 2003, A&A, 401, 99
- Johansson et al. (1998) Johansson, L. E. B., Greve, A., Booth, R. S., Boulanger, F., Garay, G., de Graauw, Th., Israel, F. P., Kutner, M. L., Lequeux, J., Murphy, D. C., Nyman, L.-Å., & Rubio, M. 1998, A&A, 331, 857
- Kamazaki et al. (2005) Kamazaki, T., et al. 2005, Astronomical Society of the Pacific Conference Series, 347, 533
- Kaufman et al. (1999) Kaufman, M. J., Wolfire, M. G., Hollenbach, D. J., & Luhman, M. L. 1999 ApJ, 527, 795
- Kawamura et al. (2009) Kawamura, A. et al. 2009, ApJS, 184, 1
- Keller & Wood (2006) Keller, & Wood 2006, ApJ, 642, 834
- Kim et al. (1999) Kim, S., Dopita, M. A., Stavely-Smith, L., & Bessell, M. S. 1999, AJ, 118, 2797
- Kim et al. (2003) Kim, S., Staveley-Smith, L., Dopita, M. A., Sault, R. J., Freeman, K. C., Lee, Y., & Chu, Y.-H. 2003, ApJS, 148, 473
- Kim et al. (2004) Kim, S., Walsh, W., & Xiao, K. 2004, ApJ, 616, 865
- Kim (2006) Kim, S. 2006, PASP, 118, 94
- Kohno (2005) Kohno, K. 2005, ASP Conference series, 344, 242
- Koornneef (1984) Koornneef, J. 1984, in IAU Symp. 108, Structure and Evolution of the Magellanic Clouds, eds. S. van den Bergh & K. S. de Boer (Dordrecht: Reidel), 333
- Minamidani et al. (2008) Minamidani, T. et al. 2008, ApJS, 175,485
- Minamidani et al. (2009) Minamidani, T. et al. 2009, in IAU Symp. 256, The Magellanic Clouds: Stars, Gas, and Galaxies, eds. Jacco Th. van Loon & Joana M. Oliveira, 256
- Mizuno et al. (2001) Mizuno, N., Yamaguchi, R., Mizuno, A., Rubio, M., Abe, R., Saito, H., Onishi, T., Yonekura, Y., Yamaguchi, N., Ogawa, H., & Fukui, Y. 2001, PASJ, 53, 971
- Mizuno et al. (2010) Mizuno, Y. et al. 2010, PASJ, 62, 51
- Nikolić et al. (2007) Nikolić, S. et al. 2007, A&A, 471, 561
- Ott et al. (2008) Ott, J. et al. 2008, PASA, 25, 129
- Ott et al. (2010) Ott, J. et al. 2010, ApJ, 710, 105
- Pineda et al. (2008) Pineda, J. L. et al. 2008, A&A, 482, 197
- Poglitsch et al. (1995) Poglitsch, A., Krabbe, A., Madden, S. C., Nikola, T., Geis, N., Johansson, L. E. B., Stacey, G. J., & Sternberg, A. 1995, ApJ, 454, 293
- Rolleston et al. (2002) Rolleston, W. R. J., Trundle, C., & Dufton, P. L. 2002, A&A, 396, 53
- Röllig et al. (2007) Röllig, M. et al. 2007, A&A, 467, 187
- Sorai et al. (2000) Sorai, K. et al. 2000, Proc. SPIE, 4015, 86
- Sorai et al. (2001) Sorai, K. et al. 2001, ApJ, 551, 794
- Schöier et al. (2005) Schöier, F. L., van der Tak, F. F. S., van Dichoeck, E. F., & Black, J. H. 2005, A&A, 432, 369
- Tielens & Hollenbach (1985) Tielens, A. G. G. M. & Hollenbach, D. 1985, ApJ, 291, 722
- van der Marel & Cioni (2001) van der Marel, R. & Cioni, M.-R. L. 2001, AJ, 122, 1807
- Wang et al. (1994) Wang, Y., Jaffe, D. T., Graf, U. U., & Evans II, N. J. 1994, ApJS, 95, 503
- Werner et al. (1978) Werner, M. W., Becklin, E. E., Gatley, I., Ellis, M. J., Hyland, A. R., Robinson, G., & Thomas, J. A. 1978, MNRAS, 184, 365
- Wong et al. (2006) Wong, T., Whiteoak, J. B., Ott, J., Chin, Y., & Cunningham, M. R. 2006, ApJ, 649, 224
- Wong et al. (2009) Wong, T. et al. 2009, ApJ, 696, 370
- Yonekura et al. (2005) Yonekura, Y., Asayama, S., Kimura, K., Ogawa, H., Kanai, Y., Yamaguchi, N., Barnes, P. J., & Fukui, Y. 2005, ApJ, 634, 476
| GMC | ClumpccMinamidani et al. (2008). | Peak Properties of 13CO() Line | ||||||||||||
|---|---|---|---|---|---|---|---|---|---|---|---|---|---|---|
| No.aaFukui et al. (2008). | NameaaFukui et al. (2008). | TypebbKawamura et al. (2009). | Position | Integrated Intensity | rms | Other IDddJohansson et al. (1998). | ||||||||
| Region | No. | (1950) | (1950) | (K) | (km s-1) | (km s-1) | (K km s-1) | (K) | ||||||
| (1) | (2) | (3) | (4) | (5) | (6) | (7) | (8) | (9) | (10) | (11) | (12) | (13) | ||
| 186 | LMC N J0538-6904 | III | 30 Dor | 1 | 5 39 08.6 | -69 06 15 | 0.99 | 251.3 | 5.5 | 7.1 | 0.10 | 30Dor-10 | ||
| 2 | 5 38 54.6 | -69 08 00 | 0.86 | 247.4 | 5.2 | 5.2 | 0.09 | 30Dor-12 | ||||||
| 3 | 5 38 49.0 | -69 04 30 | 0.54 | 253.3 | 3.8 | 2.9 | 0.08 | 30Dor-06 | ||||||
| 4 | 5 38 49.0 | -69 03 30 | 0.47 | 249.0 | 3.8 | 2.2 | 0.08 | |||||||
| 197 | LMC N J0540-7008 | III | N159 | 1 | 5 40 03.7 | -69 47 00 | 3.2 | 237.9 | 5.8 | 23 | 0.18 | N159W | ||
| 2 | 5 40 35.5 | -69 46 00 | 1.7 | 233.1 | 3.7 | 8.4 | 0.11 | N159E | ||||||
| 4 | 5 40 32.7 | -69 52 00 | 0.60 | 237.0 | 3.5 | 3.2 | 0.07 | N159S | ||||||
| 156 | LMC N J0532-7114 | II | N206D | 1 | 5 32 58.4 | -71 15 20 | 1.6 | 225.4 | 3.0 | 5.7 | 0.09 | |||
| 225 | LMC N J0547-7041 | I | GMC225 | 1 | 5 47 51.3 | -70 41 20 | 0.19 | 216.9 | 2.2 | 0.33 | 0.04 | |||
Note. — Units of right ascension are hours, minutes, seconds, and units of declination are degrees, arcminites, arcseconds. Col. (1): Running number of GMC used in Table 1 in Fukui et al. (2008). Col. (2): Name of GMC. Col. (3): Type of GMC. Col. (4): Region name used in this paper. Col. (5): Running number of 12CO() clump in each region used in Table 2 in Minamidani et al. (2008). Cols. (6)–(7): Coordinates of the position of 12CO() clump. Cols. (8)–(12): Observed properties of the 13CO() spectra obtained at the peak positions of the 12CO() clumps. The peak main-beam temperature , , and the FWHM line width are derived from a single Gaussian curve fitting and are given in cols. (8), (9), and (10), respectively. The 13CO() integrated inteisities and r.m.s. noise level at the peak positions of the 12CO() clumps are shown in cols. (11) and (12), respectively. Col. (13): Another identification based on 12CO() observations with SEST.
| Convolved (K) | (K) | Line Ratio | H flux | |||||||
|---|---|---|---|---|---|---|---|---|---|---|
| Region | No. | 13CO() | 12CO() | 13CO() | Ref. | ( ergs s cm-2) | ||||
| (1) | (2) | (3) | (4) | (5) | (6) | (7) | (8) | (9) | ||
| 30 Dor | 1 | 0.470.08 | 3.70.5 | 0.13 | J98 | 8.01.7 | 3.60.9 | 79 | ||
| 2 | 0.460.08 | 2.50.4 | - | J98 | 5.51.2 | - | 59 | |||
| 3 | 0.300.06 | 2.00.3 | 0.13 | J98 | 6.71.6 | 2.30.6 | 21 | |||
| 4 | 0.280.06 | 2.30.4 | 0.13 | J98 | 8.22.2 | 2.20.6 | 10 | |||
| N159 | 1 | 1.50.2 | 8.61.2 | 0.80 | J98 | 5.71.1 | 1.90.5 | 6.0 | ||
| 2 | 1.00.1 | 6.10.8 | 0.44 | J98 | 6.11.2 | 2.30.6 | 9.3 | |||
| 4 | 0.360.06 | 3.80.5 | 0.72 | J98 | 112 | 0.500.13 | 1.1 | |||
| N206D | 1 | 0.860.12 | 3.30.5 | 0.85 | M08 | 3.80.8 | 1.00.2 | 1.2 | ||
| GMC225 | 1 | 0.130.03 | 1.50.2 | 0.55 | M08 | 123 | 0.240.07 | 0.94 | ||
Note. — Col. (1): Region. Col. (2): Running number in each region. Cols. (3)-(4): The peak main-beam temperature, , of the 13CO() and 12CO(), respectively, derived by using a single Gaussian curve fitting for a spectrum obtaind by convolved spectra into the 45″beam with a Gaussian kernel. Cols. (5)-(6): The peak main-beam temperature, , of the 13CO() (col. (5)) and their references (col. (6)). Cols. (7)-(8): Ratios of the peak main-beam temperatures. Ratios of 12CO() to 13CO() are shown in col. (7), and ratios of 13CO() to 13CO() are shown in col. (8). Col. (9): H flux toward the peak positions.
References. — (J98) Johansson et al. 1998; (M08) Minamidani et al. 2008.
| Region | No. | (H2) | H flux | ||||
|---|---|---|---|---|---|---|---|
| (km s-1 pc-1) | ( cm-3) | (K) | ( ergs s-1 cm-2) | ||||
| (1) | (2) | (3) | (4) | (5) | (6) | (7) | (8) |
| 30 Dor | 1 | 0.9 | 8.01.7 | 3.60.9 | 79 | ||
| 3 | 0.9 | 6.71.6 | 2.30.6 | 21 | |||
| 4 | 0.5 | 8.22.2 | 2.20.6 | 10 | |||
| N159 | 1 | 0.9 | 5.71.1 | 1.90.5 | 6.0 | ||
| 2 | 0.5 | 6.11.2 | 2.30.6 | 9.3 | |||
| 4 | 0.4 | 112 | 0.500.13 | 1.1 | |||
| N206D | 1 | 0.3 | 3.80.8 | 1.00.2 | 1.2 | ||
| GMC225 | 1 | 0.2 | 123 | 0.240.07 | 0.94 |
Note. — Col. (3): Velocity gradient of clumps (Minamidani et al. 2008). Cols. (6) and (7): Results of LVG analysis.
| No.1 (N159W) | No.2 (N159E) | No.4 (N159S) | |||||||
|---|---|---|---|---|---|---|---|---|---|
| Paper | Reference | (H2) | (H2) | (H2) | |||||
| (K) | (103 cm-3) | (K) | (103 cm-3) | (K) | (103 cm-3) | ||||
| (1) | (2) | (3) | (4) | (5) | (6) | (7) | (8) | ||
| This work | – | ||||||||
| Mizuno10 | M10 | ||||||||
| Pineda08 | P08 | – | – | – | – | ||||
| Minamidani08 | M08 | ||||||||
References. — (M10) Mizuno et al. 2010; (P08) Pineda et al. 2008; (M08) Minamidani et al. 2008