Finite-size scaling of the stochastic susceptible-infected-recovered model
Abstract
The critical behavior of the stochastic susceptible-infected-recovered model on a square lattice is obtained by numerical simulations and finite-size scaling. The order parameter as well as the distribution in the number of recovered individuals is determined as a function of the infection rate for several values of the system size. The analysis around criticality is obtained by exploring the close relationship between the present model and standard percolation theory. The quantity , equal to the ratio between the second moment and the squared first moment of the size distribution multiplied by the order parameter , is shown to have, for a square system, a universal value that is the same as for site and bond percolation, confirming further that the SIR model is also in the percolation class.
pacs:
05.70.Ln, 05.50.+q, 05.65.+b1 Introduction
The spread of an epidemic among a community of individuals has been described by several types of models, either deterministic or stochastic [1, 2, 3, 4, 5, 6, 7]. Among the latter we find models in which the space structure is explicitly taken into account [8, 9, 10, 11, 12, 13, 14, 15, 16, 17, 18, 19, 20]. These models are defined on a lattice which represents the space where the community lives, and in which each site is occupied by just one individual. In the susceptible-infected-recovered (SIR) stochastic lattice model [8, 9, 12, 13, 14, 15, 16, 17, 18, 19, 20], each individual can be either susceptible (S), infected (I) or recovered (R). A susceptible individual becomes infected (SI) through an autocatalytic reaction, and an infected individual recovers (IR) spontaneously. This model describes an epidemic in which the immunization is permanent; in other words, once an individual recovers, it becomes immune forever.
The main features of the SIR model are as follows. When the rate of infection of a susceptible individual by an infected individual is small compared to the immunization rate, there is no spreading of the disease. Increasing the infection rate, one reaches a critical value above which the infection spreads over the whole lattice. The transition from one regime to the other is regarded a continuous phase transition whose critical behavior places the model into the dynamic percolation universality class, which corresponds to the standard percolation class with the addition of dynamical growth exponents [8, 9]. As shown below, the SIR model can be described by just one parameter, either the reduced infection rate or the reduced immunization rate . The phase transition occurs at a critical value , which has been estimated as on a square lattice by means of time-dependent numerical simulations [18]. A more accurate result was later determined by extensive numerical simulation through the use of a technique borrowed from standard percolation theory [19].
A close relationship exists between the SIR model and dynamic (isotropic) percolation [4, 8, 19, 20, 22, 23]. Starting from a single infected individual in a lattice full of susceptibles, a cluster composed of infected and recovered individuals grows, the infected individuals staying at the border of the cluster and the recovered individuals inside it. Eventually the cluster becomes composed of recovered individuals only due to the spontaneous immunization. For (the spreading regime), an infinite cluster of recovered individuals percolates the whole lattice. For (the non-spreading regime), only finite clusters are present. It has been shown [19] that the cluster probability distribution obeys the same scaling laws as apply to standard percolation models.
Here we report numerical simulations and finite-size scaling analysis to obtain the critical behavior of the stochastic SIR model on a square lattice. To this end we determine the order parameter (defined below), the mean number of recovered sites , and the mean value of the squared number of recovered sites . These quantities are determined as a function of and the linear system size . We show that the ratio between the second moment and the square of the first moment is not independent of the system size , at criticality, as occurs, e. g., in the contact model [24, 25]. Instead, we show here that the quantity that is independent of the system size at criticality, and therefore universal, is the product between this ratio and the order parameter, consistent with the dynamical percolation universality class.
This paper is organized as follows. The stochastic SIR model on a regular lattice is defined in section 2 together with numerical simulations. In section 3 we explain how the model is related to percolation around criticality. The finite-size analysis is introduced in section 4. A conclusion is drawn in the last section.
2 Definition and simulations
The stochastic SIR model is defined on a regular lattice of sites as follows. At each time step a site is chosen at random and the time is incremented by an amount equal to . If the chosen site is in state S then it becomes I with probability multiplied by the fraction of nearest-neighbor sites in state I. If the chosen site is in state I then it becomes R with probability . If it is in state R it remains in this state. The number of individuals of type S, I and R are denoted by , and . The total number of individuals equals the total number of sites of the lattice, .
The quantities that we have measured in the Monte Carlo simulation are the following: the mean number of recovered individuals
| (1) |
the mean value of the square of the number of recovered individuals
| (2) |
and the order parameter , defined below. We also considered the ratio between the second moment and the square of the first moment of the probability distribution of recovered individuals, that is,
| (3) |
The simulations were performed on a square lattice of sites and periodic boundary conditions. We begin with an infected individual placed at the center of the lattice full of susceptible individuals. To speed up the simulations we keep a list of the I sites. At each step of the simulation we choose randomly an I site among the list of the I sites. (If we were interested in the time, which is not the case here, we would increment it by an amount equal to .) With probability the chosen I site becomes an R site. With the complementary probability we choose one of its four nearest-neighbor sites; if the nearest-neighbor site is an S site, it becomes an I site, otherwise it remains unchanged. These rules are equivalent to the definition of the model given in the beginning of this section.
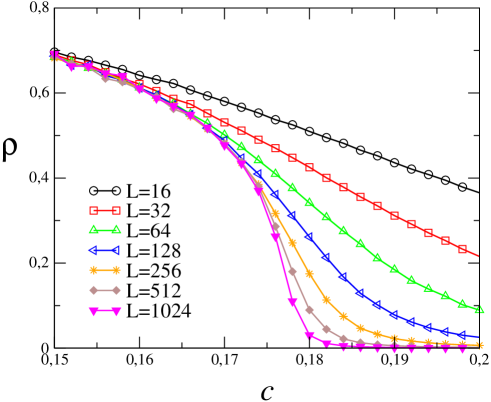
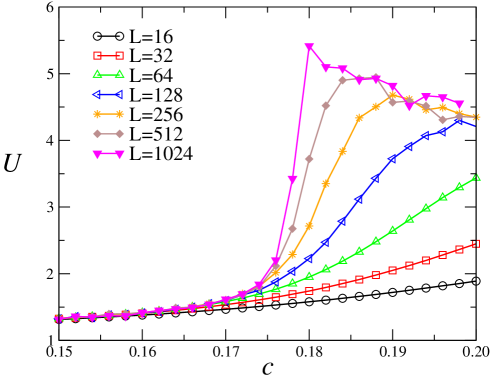
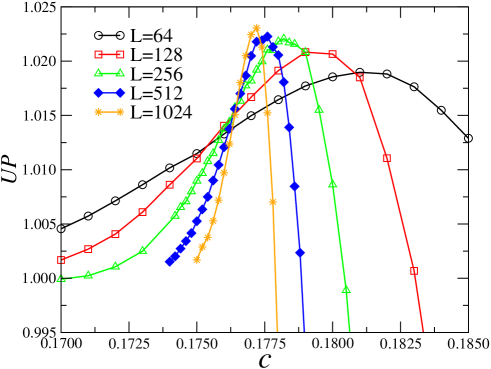
Here we are interested only in the stationary states, which are characterized by the absence of infected sites. Starting from a single infected site, the number of infected sites may increase but eventually decreases and vanishes. Without infected sites there is no activity and the dynamics stops. The stationary state is then an absorbing state constituted of S and R sites only. For each value of the parameter and linear size we performed a set of independent runs, ranging from to , and measured the quantities , and related to the final clusters of R sites. In figure 1 we show the density of recovered individuals as a function of for several values of the system size . In figure 2 we show the ratio as a function of for several values of the system size .
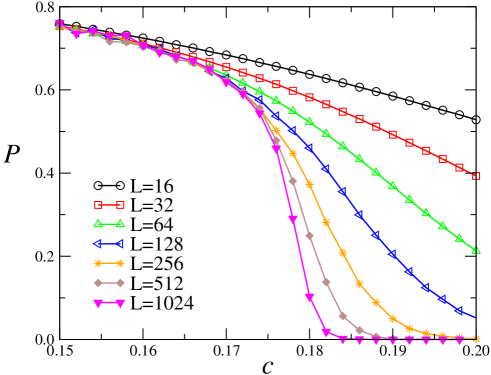
To find the order parameter , we checked whether the growing cluster of infected individuals reached the border of the lattice, and the fraction of runs for which this happens is defined as . In the thermodynamic limit, it becomes the probability that the central site belongs to the infinite cluster in accordance with the definition of order parameter in standard percolation theory. In figure 3 we show versus for several values of the linear size .
We note that in percolation one often uses the fraction of sites belonging to the largest cluster in a lattice fully occupied with clusters as the order parameter. However, this method cannot be used here because by definition there is only one cluster in each epidemic sample. Note also that in our definition of , one can think of the system as having open boundary conditions and we are finding if the cluster hits that boundary; this is related of the idea of midpoint percolation considered recently [26]. An equivalent interpretation is that we have an infinite lattice, and we are seeing if the epidemic starting from the origin crosses the boundary.
3 Relation to percolation
Here we summarize some results of the percolation theory [27, 28, 29, 30, 31] that will be useful for showing the relation to the SIR model. In standard percolation theory the probability that a site belongs to a cluster of size is
| (4) |
where is the mean number of clusters of size per lattice site. (For site percolation, one should also technically multiply this by , the probability that the site is occupied, but we will suppress this factor.) From this quantity one obtains the mean epidemic size ,
| (5) |
and the mean-square epidemic cluster size ,
| (6) |
The order parameter is the probability that a site belongs to the infinite percolating cluster.
Around the critical point for an infinite system, these quantities behave as
| (7) |
| (8) |
and
| (9) |
where and and are critical exponents associated to the order parameter and to the mean cluster size, respectively. The quantity is the parameter associated with percolation problem and is its critical value. In site (bond) percolation the parameter is the probability that a site (bond) is occupied.
It has been argued that the clusters of recovered individuals generated by the dynamics of the stochastic SIR model follow the statistics of the cluster size distribution of the standard percolation theory summarized here [8]. The mean cluster size in percolation theory is then identified as the mean number of recovered individuals. This leads us to identify the quantities , and defined in the previous section for the SIR model with the quantities , and defined in this section. As a consequence, their critical behavior is given equations (7), (8) and (9) with
| (10) |
An implication of the critical behavior (8) and (9) of and is that the ratio should behave as
| (11) |

4 Finite-size scaling
We start from the assumption that a standard finite-size scaling analysis can be performed to obtain the critical behavior of this model. We assume that the phase transition in the SIR model is characterized by a correlation length which diverges in the limit where the system is infinite as
| (12) |
Here we use rather than the usual of standard percolation because we consider the SIR cluster growth as a dynamical process. The linear size of the system scales as and a finite-system quantity will behave according to the finite-size scaling as
| (13) |
where is a universal function. The exponent describes the behavior of in the limit of the infinite system, that is,
| (14) |
Using the finite-size scaling, we may write the following relations for the quantities , , and ,
| (15) |
| (16) |
| (17) |
| (18) |
and at the critical point , we have
| (19) |
| (20) |
| (21) |
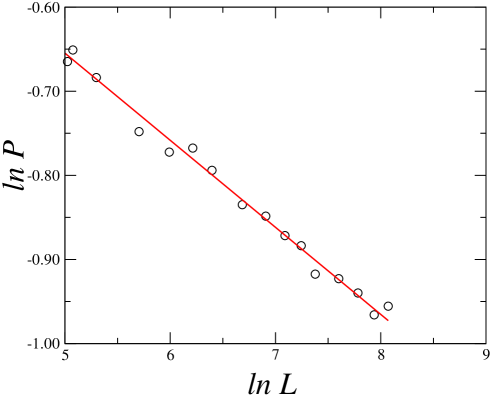
The quantities and are plotted as a function of in figures 4, and 5. Each curve was obtained by performing a number of runs of the order of . From the log-log plots we may estimate the critical exponents. From the slope of a straight line fitted to the data points of figure 4 we get the value and from figure 5 we get the exponent . These results should be compared with the exact results and coming from the exact values , and of percolation in two dimensions.
If we multiply equations (15) and (21) for the order parameter and the ratio we get
| (22) |
At the critical point the product is then a quantity independent of and may be used to located the critical point. Figure 6 shows a plot of the quantity versus for several values of the system size . We see that the curves indeed cross each other, for sufficiently large values of , at a point identified as the critical point. From the plot we get the value in agreement with the result [19], and the value for at the critical point.
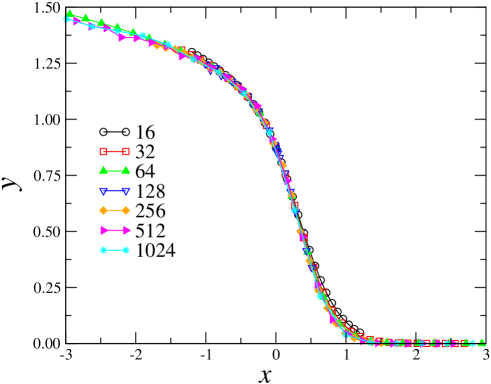
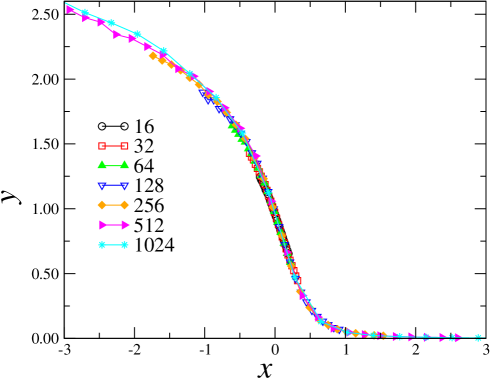
Using the critical points and the critical exponents we have done a data collapse for the quantities , and , shown in figures 7, 8 and 9, respectively. These plots confirm that the critical behavior of the stochastic SIR model obeys the finite-size scaling defined above.

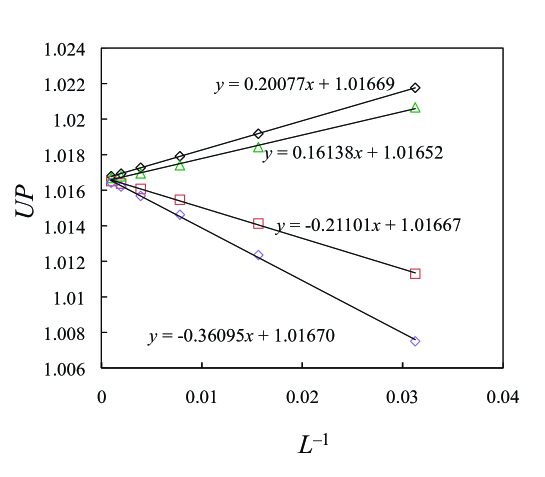
In figure 10 we plot at the critical point for systems of sizes , , , , and . Here we did at least samples for each size. As seen in that figure, we find a very good fit assuming the finite-size corrections are proportional to . The data extrapolate to a value of for an infinite system.
We also ran similar simulations of standard site and bond percolation at their critical points and respectively, using an epidemic growth algorithm to generate the percolation clusters, and also show those results in figure 10. For bond percolation, we characterized the cluster by the number of sites that are visited or “wetted.” For site percolation, we consider two definitions of the cluster mass: the first is the number of occupied sites of the cluster, which conforms to the standard definition in percolation, while for the second we used both the number of occupied sites and the number of vacant sites surrounding the clusters (the so-called perimeter sites) to characterize the cluster size. The latter definition corresponds to the site-percolation limit of the SIR model, in which an I site simultaneously infects all its S neighbors with probability , and then recovers, so that the R sites correspond to both occupied and vacant sites of the percolation cluster. These systems show similar correction-to-scaling , but with different coefficients—positive for bond and regular site percolation, negative for the SIR model and the occupied+vacant form of site percolation. The extrapolation of all three systems to is a common value , showing that the SIR model is equivalent to percolation not just for the critical exponents but for this amplitude ratio as well.
Note that a correction-to-scaling behavior of is often seen in percolation problems when there are boundaries or lattice effects present [32, 33], but the precise source of the corrections to scaling is not clear here. Also, it is not clear that the exponent is exactly ; the data in figure 10 is well fit for exponents in the range of to (ignoring higher-order corrections), depending upon the curve . While the universality of amplitude ratios in percolation has been studied for many combinations of quantities (e.g., [34, 36, 37, 35, 38, 39]), it seems that the quantity has not been examined previously for percolation, either away from, or exactly at, the critical point (finite-size scaling). For scaling away from , corresponds to the critical amplitude or , which has been studied for the Ising model [40, 41, 42] but evidently not for percolation. For finite-size scaling at the critical point in percolation, studies have been carried out on other universal amplitude ratios [38, 39], but not for .
The value of is very close to . This can be understood easily for standard percolation as follows: at the critical point, the largest cluster will be of the order of the size of the system and much bigger than the other clusters, implying , , and (by definition) , thus yielding . By universality, this also applies to the SIR model. As can be seen in figure 9, for (which corresponds to for regular percolation), goes to the value exactly 1, as would be expected by these arguments.
5 Conclusion
We have used numerical simulations to investigate the critical behavior of the stochastic SIR model on finite square lattices. We have determined the order parameter , the mean number of recovered individuals and the mean squared number of recovered individuals . These quantities obey the same scaling laws used in percolation theory. The cluster size distribution of percolation theory is identified with the cluster distribution of recovered individuals generated by the SIR dynamics. By studying lattices of different sizes we obtain the critical behavior by means of a finite-size scaling borrowed from the stardard percolation theory. The value of the critical exponents are in agreement with those of the isotropic percolation as one would expect. We have shown that the ratio is not universal at the critical point, as is the case of the models belonging to the directed percolation universality class, and diverges as . Instead, we have shown that the quantity that is universal is the product . The value of the critical point found from the fact that is independent of the system size is found to be in excellent agreement with previous calculations. The value of at the critical point, is shown to be consistent with measurements of standard site and bond percolation, thus confirming that the amplitude ratios of the two models are the same, and showing a deeper level of agreement between the SIR and percolation models than just having common critical exponents.
Acknowledgment
We wish to acknowledge the financial support of the Brazilian agency CNPq, and RMZ acknowledges partial support from the U. S. National Science Foundation Grants No. DMS-0553487.
References
References
- [1] W. O. Kermack and A. G. McKendrick, Proc. Royal Soc. London A 115, 700 (1927).
- [2] N. T. J. Bailey, Biometrika 40, 177 (1953).
- [3] N. T. J. Bailey, The Mathematical Theory of Epidemic (Hafner, New York, 1957).
- [4] D. Mollison, J. Roy. Stat. Soc. B 39, 283 (1977).
- [5] E. Renshaw, Modelling Biological Populations in Space and Time (Cambridge University Press, Cambridge, 1991).
- [6] A. Hastings, Population Biology: Concepts and Models (Springer, New York, 1996).
- [7] M. J. Keeling and P. Rohani, Modeling Infectious Diseases in Human and Animals (Princeton University Press, Princeton, 2008).
- [8] P. Grassberger, Math. Biosc. 63, 157 (1983).
- [9] J. Cardy and P. Grassberger, J. Phys. A 18, L267 (1985).
- [10] J. Satulovsky and T. Tomé, Phys. Rev. E 49, 5073 (1994).
- [11] J. Satulovsky and T. Tomé, J. Math. Biol. 35, 344 (1997).
- [12] T. Antal, M. Droz, A. Lipowski, and G. Ódor, Phys. Rev. E 64, 036118 (2001).
- [13] S. M. Dammer and H. Hinrichsen, Phys. Rev. E 68, 016114 (2003).
- [14] S. M. Dammer and H. Hinrichsen, J. Stat. Mech.: Theor. Exp. P07011 (2004).
- [15] E. Arashiro and T. Tomé, J. Phys. A 40, 887 (2007).
- [16] G. M. Schütz, M. Brandau and S. Trimper, Phys. Rev. E 78, 061132 (2008)
- [17] V. R. V. Assis and M. Copelli, Phys. Rev. E 80, 061105 (2009).
- [18] D. de Souza and T. Tomé, Physica A 389, 1142 (2010).
- [19] T. Tomé and R. M. Ziff, Phys. Rev. E 82, xxx (2010); arXiv:1006.2129v2.
- [20] T. Tomé and M. J. de Oliveira, to be published.
- [21] F. M. Neri, F. J. Pèrez-Reche, S. N. Taraskin, and C. A. Gilligan, J. Roy. Soc. Inteface (online first, July 14, 2010)
- [22] K. Kuulasmaa, J. Appl. Probab. 19, 745 (1982).
- [23] M. E. J. Newman, Phys. Rev. E 66, 016128 (2002).
- [24] M. M. de Oliveira and R. Dickman, Phys. Rev. E 71, 016129 (2005).
- [25] T. Tomé and M. J. de Oliveira, Phys. Rev. E 72, 026130 (2005).
- [26] S. K. Baek, P. Minnhagen, and B. J. Kim, Phys. Rev. E 81, 041108 (2010).
- [27] D. Stauffer and A. Aharony, Introduction to Percolation Theory, Taylor and Francis, 1994.
- [28] C. D. Lorenz and R. M. Ziff, Phys. Rev. E 57, 230 (1998).
- [29] M. E. J. Newman and R. M. Ziff, Phys. Rev. E 64, 016706 (2001).
- [30] M. J. Lee, Phys. Rev. E 78, 031131 (2008).
- [31] X. Feng, Y. Deng, and H. W. J. Blöte, Phys. Rev. E 78, 031136 (2008).
- [32] R. M. Ziff, Phys. Rev. Lett. 69, 2670 (1992).
- [33] J.-P. Hovi and A. Aharony, Phys. Rev. E 53, 235 (1996).
- [34] A. Aharony, Phys. Rev. B 22, 400 (1980).
- [35] V. Privman, P. C. Hohenberg, and A. Aharony in Phase Transitions and Critical Phenomena, Vol. 14, eds. C. Domb and J. L. Lebowitz (Academic, New York, 1991).
- [36] H. Saleur and B. Derrida, J. Physique 46, 1043 (1985).
- [37] J. Adler, A. Aharony, Y. Meir, and A. B. Harris, J. Phys. A. 19, 3631 (1987).
- [38] A. Aharony and D. Stauffer, J. Phys. A 30, L301 (1997).
- [39] D. Daboul, A. Aharony, and D. Stauffer 33, 1113 (2000).
- [40] P. G. Watson, J. Phys. C 2 1883 (1969).
- [41] S.-Y. Zinn, S.-N. Lai, and M. E. Fisher, Phys. Rev. E 54, 1176 (1996).
- [42] A. Pelissetto and E. Vicari, Phys. Rep. 368, 549 (2002).