First-principles study of phase stability of Gd-doped EuO and EuS
Abstract
Phase diagrams of isoelectronic Eu1-xGdxO and Eu1-xGdxS quasi-binary alloy systems are constructed using first-principles calculations combined with the standard cluster expansion approach and Monte-Carlo simulations. The oxide system has a wide miscibility gap on the Gd-rich side but forms ordered compounds on the Eu-rich side, exhibiting a deep asymmetric convex hull in the formation enthalpy diagram. The sulfide system has no stable compounds. The large difference in the formation enthalpies of the oxide and sulfide compounds is due to the contribution of local lattice relaxation, which is sensitive to the anion size. The solubility of Gd in both EuO and EuS is in the range of 10-20% at room temperature and quickly increases at higher temperatures, indicating that highly doped disordered solid solutions can be produced without the precipitation of secondary phases. We also predict that rocksalt GdO can be stabilized under appropriate experimental conditions.
I Introduction
The unique properties of gadolinium-doped europium chalcogenides make them attractive for spintronic and neutron detection applications. Doped EuO undergoes a spectacular metal-insulator transition near its Curie temperature , which is accompanied by huge magnetoresistance. In some samples, the resistivity changes by up to 13 orders of magnitude upon changing the temperature, Samokhvalov et al. (1988); Shapira et al. ; Steeneken et al. (2002) or by up to 6 orders of magnitude upon the application of an external magnetic field. Schmehl et al. (2007); Shapira et al. Doped EuO can be epitaxially grown on Si and GaN substrates, and it demonstrates a very high spin polarization of the conducting electrons in the ferromagnetic (FM) state. Schmehl et al. (2007) This half-metallic behavior suggests applications of doped EuO as a spin injector material in spintronic heterostructures. On the other hand, Gd-doped semiconductors are appealing as neutron-absorbing materials for solid-state neutron detection technology due to a very high neutron absorption cross-section of the 157Gd isotope. Aoyama et al. (1992); Mireshghi et al. (1994); Ketsman et al. (2007); Schultz et al. (2010)
The potential applications of Gd-doped Eu chalcogenides depend on their phase stability. No phase diagrams are available for Eu-Gd oxides; the data for Eu-Gd sulfides is limited to the EuS-Gd2S3 isoplethal section.Eliseev et al. (1989) The experimental studies of pure and Gd-doped EuO and EuS give only indirect information about the phase stability while focusing on other properties, which we briefly review here. Pure EuO is a rare FM insulator with a rocksalt structure, whose optical absorption gap increases monotonically from 0.95 eV at 0 K to 1.12 eV at 300 K Dimmock (1970). A divalent Eu ion in EuO has the ground state configuration and the magnetic moment of 7 due to the half-filled 4 shell. The Curie temperature rises sharply with Gd doping from K in pure EuO up to K at optimal doping of about 4%. Matsumoto et al. (2004); Ott et al. (2006); Shafer and McGuire (1968); Mauger (1977) The miscibility of Gd in EuO is unknown but is expected to be finite, particularly because GdO has not been observed in the rocksalt structure. In fact, the common Gd oxide has Gd2O3 stoichiometry (crystallizing in three different phases Adachi and Imanaka (1998)), but a tentative observation of zincblende GdO has also been reported. Bist and Srivastava (1971) On the other hand, both EuS and GdS are stable in the rocksalt structure, and they can form a continuous range of rocksalt solid solutions at all concentrations.McGuire and Holtzberg (1972) EuS is an insulator with the absorption gap of 1.64 eV, which is FM below K;Dimmock (1970) GdS is an AFM metal with a Néel temperature of 58 K. McGuire and Holtzberg (1972)
Several recent first-principles studies Kunes et al. (2005); Larson and Lambrecht (2006); Ghosh et al. (2004); Ingle and Elfimov (2008); Bousquet et al. (2010) have focused on the electronic structure, magnetic interaction, and other properties of pure Eu monochalcogenides. The interplay between the magnetic ordering, spectral, and transport properties of doped EuO was also studied using model Hamiltonians. Sinjukow and Nolting (2003, 2004); Arnold and Kroha (2008) The structural phase stability of the (Eu,Gd)O and (Eu,Gd)S quasi-binary alloys thus remains unexplored.
The purpose of the present study is to give a theoretical perspective of the phase identity, stability, miscibility and other properties of Gd-doped EuO and EuS along the EuO-GdO and EuS-GdS isoplethal sections. Based on the comparison with the self-consistent quasiparticle GW calculations and with available experimental data, we adopt the generalized gradient approximation (GGA) with the Hubbard corrections applied only to the rare-earth orbitals. We then apply the first-principles cluster expansion technique and subsequent Monte Carlo simulations to construct the phase diagrams of (Eu,Gd)O and (Eu,Gd)S quasi-binary alloys. We find that, despite the isovalency of the two alloy systems, the resulting phase diagrams are quite different. In particular, we predict that the oxide system has two yet-unobserved ordered phases with 1:1 and 1:2 Gd-to-Eu ratios, which become thermodynamically stable below and K; moreover, we predict that rocksalt GdO can be stabilized in a narrow range of oxygen pressures. On the other hand, such 1:1 and 1:2 phases do not appear in the (Eu,Gd)S system, and moreover a different ordered phase with a 2:1 Gd:Eu ratio is very near the tie-line of the end compounds EuS and GdS. We further analyze the role of the chemical and deformation-mediated interactions and find that the qualitative difference between the oxide and sulfide systems is mainly due to the contribution of local anion relaxations.
The paper is organized as follows. The methodological and computational details are described in Section II. Section III presents the calculations of band structure and elastic properties of end compounds. Comparison with experiment and with calculations serves to justify the adopted GGA approach. Section IV discusses the magnetic ordering energies and their relevance to phase stability. The configurational Hamiltonians are described in Section V, followed by the calculations of phase diagrams in Section VI. The anion-mediated deformational interaction mechanism is discussed in Section VII, and finally we summarize in Section VIII. Some technical details, including the extraction of paramagnetic formation enthalpies and the structural information for the predicted compounds, are included in the Appendices.
II Computational approach
II.1 Total energy calculations
Total energy calculations for all ordered compounds in this study were performed using the projected augmented wave (PAW) method Blöchl (1994); Kresse and Joubert (1999) and generalized gradient approximation (GGA) of Perdew-Burke-Ernzerhof, Perdew et al. (1996) with the Hubbard correction Liechtenstein et al. (1995) for the orbitals, as implemented in the VASP package. VAS An energy cutoff of 500 eV was used for the plane-wave expansion of wave functions, and total energies were converged to within a few meV per atom with the density of the k-point mesh no lower than 0.01 Å-3 including the point for Brillouin-zone sampling.
From the energetics of the individual atomic levels, it is clear that in both oxides and sulfides, the bands are half-filled, whether originating from Eu or Gd, whereas the binding energy of the Gd states is much larger compared to divalent Eu. Electron doping through the addition of Gd fills the conduction-band states, which are spin-split by the exchange interaction with the shell. The shallow core and states on both Eu and Gd are included in the valence basis set. The half-filled and strongly-localized orbitals in both Eu and Gd were treated within the GGA approach. Liechtenstein et al. (1995) To calculate the value of eV, we used the constrained occupation method Dederichs et al. (1984); Solovyev (2008) by considering the states as an open-core shell and finding the total energy difference between the 4 4 and 4 4 states. This calculation was performed using the full-potential linear augmented plane wave (FLAPW) method implemented in the FLEUR package. FLE The value eV calculated in a similar way, when used in the GGA calculation, leads to the states being too shallow with respect to the conduction band of EuO. This discrepancy is due to the underestimation by GGA of the intrinsic insulating gap between the O- and Eu- states. This underestimation (which is not sensitive to ) brings the O- states too close to the Eu states; their hybridization-induced repulsion pushes the states up and reduces the band gap. Therefore, we adjusted the value of empirically and found that eV results in good agreement with optical absorption Busch and Wachter (1966, 1968) and photoemission Eastman et al. (1969) measurements, as illustrated in section III. The Hubbard corrections are not used for the orbitals on Eu and Gd, as justified below in sections II.2 and III.
The proper treatment of the chemical disorder in many and electron systems is notoriously difficult, because of the dependence of the structural energy on the (or ) orbital orientation, and due to the large spurious self-interacion present in the popular GGA+U versions for (or non-time-reversible ) orbitals. Zhou and V.Ozolins (2009) Fortunately, this is not an issue in (Eu,Gd)O and (Eu,Gd)S, since the half-filled shells do not exhibit such an orientational energy dependence. Indeed, for all considered cases, we found the lowest energy electronic configurations to correspond to exactly seven co-aligned electrons on each cation atom, forming a rotationally-invariant shell. At the same time, it was not unusual for our early test calculations to lead to electronic states with different -electron occupation, with energies higher by 0.15…3.0 eV/cation. Some of such higher-energy states were clearly identifiable as having a Gd electronic configuration of instead of . We found that the appearance of such states was either a failure of the residual minimization method (RMM), Wood and Zunger (1985) or an artifact of an insufficient initial -electron spin polarization. By using the Davidson minimization algorithmDavidson (1983) and by assigning the initial on-site spin polarization of 10 per cation (which is partially assigned to the and electrons, resulting in the desired occupation of 7 co-aligned electrons), we could avoid such high-energy electronic configurations. The only remaining degree of freedom for the final electronic state corresponds to the magnetic ordering of the fully polarized cations, which is well controlled by the signs of the initial on-site spin polarizations and is further discussed in Section IV.
The spin-orbit corrections are often appreciable for the band energies of heavy-element compounds at high-symmetry k-points, but are typically minor for the formation energies, which include contributions averaged over different bands in the entire Brillouin zone. Indeed, we checked the effects of the spin-orbit coupling on the formation enthalpies for the key ordered structures that we identify below in Sec.VI as the stable ground state compounds. We found that the change by at most 2 meV/cation (see Table 3 below). We therefore performed all our routine calculations in the scalar-relativistic approximation, without including the spin-orbit coupling.
II.2 Benchmark calculations
It has been suggested by some authors Ghosh et al. (2004); Larson and Lambrecht (2006) that the addition of Hubbard corrections for the empty states may be necessary for the correct description of the conduction band, and in particular for the determination of the character of the band gap (direct or indirect) of europium chalcogenides. However, these corrections are arbitrary unless a reliable benchmark is used to select the Hubbard parameters. We resolve this issue by calculating the band structure of EuO using the quasiparticle self-consistent (QSGW) approximation. Here, we discuss the QSGWmethodology, and later in Section III we use QSGW to show that the conduction band structure comes out almost exactly right in the GGA calculation with applied only to the orbitals.
QSGW has been shown to be a reliable predictor of materials properties for a wide range of compounds composed of elements throughout the periodic table. Kotani et al. (2007); Faleev et al. (2004); van Schilfgaarde et al. (2006); Chantis et al. (2006, 2007) Nevertheless, prior experience has revealed certain kinds of systematic errors. The correction of these errors makes minor adjustments to weakly correlated materials systems, and somewhat stronger adjustments for more correlated materials. There are two highly systematic errors that affect the band structure of EuO.
First, bandgaps in semiconductors such as GaAs, and insulators such as SrTiO3 are systematically overestimated a little. The same effect is seen in the subsystem of EuO. Second, shallow core-like levels, such as the highest occupied levels in Zn,Cd,Cu,Ag,Au, and so on, are systematically predicted to be too close to the Fermi level, typically by eV. This error is seen in the subsystem of EuO, as we will discuss.
Both types of errors are highly systematic in and systems, and discrepancies with experiment in compounds are consistent with these errors.Chantis et al. (2007) To a large extent, the first error can be simply explained through the random phase approximation (RPA) to the screened interaction , which can be understood as follows. The RPA bubble diagrams do not include electron-hole interactions in intermediate states in the calculation of the irreducible polarizability and thus the dielectric function . Short-range attractive (electron-hole) interactions induce the red shifts in at energies well above the fundamental bandgap; see e. g. Fig. 6 in Ref. Kotani et al., 2007. Ladder diagrams are sufficient to remedy most of the important errors in , as was demonstrated rather convincingly in Cu2O.Bruneval et al. (2006)
Inclusion of these contributions increases the static dielectric constant , as can be readily seen through the Kramers-Kronig formula relating the real and imaginary parts of . Remarkably, calculated by the RPA in QSGW is underestimated by a nearly universal factor of 0.8, for many kinds of insulators and semiconductors,van Schilfgaarde et al. (2006) including transition metal oxides such as Cu2O, Kotani et al. (2007), SrTiO3 Chambers et al. (2004), CeO2, and sp semiconductors.Shishkin et al. (2007) Because is systematically underestimated, (where is the Coulomb interaction), the self-energy , and the quasiparticle excitation energies are systematically overestimated.
The second kind of error cannot be explained in this way. QSGW pushes down the semicore level in Zn (or level in Eu) rather strongly relative to the LDA; however, the shift is slightly too small to agree with experiment. As we have noted, calculated by QSGW is already too large: reducing reduces this correction. This implies that the error should be attributed to the other approximation in theory, namely the omission of the vertex in the formally exact self-energy, .
Both kinds of corrections to the approximation are difficult to carry out in practice. As for the correction to , we have noted that simply scaling by 0.8 largely undoes this error, in a wide range of systems. We make such a scaling here, to correct the subsystem.
Whether or not is scaled, the Eu - gap is too small: when is scaled it comes out approximately zero, in contrast to the observed gap of about 1 eV. It is expected that the vertex in will largely just induce a shift in the Eu state. Anticipating this, we included an ad hoc addition to the QSGW potential for EuO, essentially doing a QSGW+ calculation with eV. The value of is adjusted to make the - gap coincide with the experimental number. With these corrections, we anticipate the QSGW method to yield highly accurate band structures, discussed below in Sec. III.
II.3 Cluster expansion and Monte Carlo simulations
To identify the thermodynamically stable phases and their range of stability, the standard cluster expansion (CE) formalismSanchez et al. (1984); Zunger (1994) coupled with the ground state search and Monte Carlo simulations were employed, using the routines implemented in the Alloy-Theoretic Automated Toolkit (ATAT) package. van de Walle and Ceder (2002); van de Walle and Asta (2002) We consider quasi-binary substitutional alloys, assuming that the anion sublattice is fully occupied by the chalcogenide atoms of one kind (either O or S). Throughout the paper, we use the terms “structure” and “ordering” to refer specifically to the ordering of Eu and Gd cations within their own (fcc) sublattice, unless indicated otherwise. Our CEs cover FM compounds, with other cases considered separately, as detailed in Sec. IV. The cell size and shape, as well as all the atomic positions, were fully relaxed for all structures using the conjugate gradient algorithm, starting from the ideal rocksalt lattice. In view of prohibitive computational cost, we did not consider the phonon contribution to the formation enthalpies, which can somewhat modify the phase diagrams at elevated temperatures.
The relaxed formation enthalpies are parameterized by a configurational cluster-expansion Hamiltonian :
| (1) |
where the occupational degrees of freedom are described by a configurational vector (a particular decoration of the cation sites of the rocksalt lattice by Gd and Eu atoms), is called the effective cluster interaction (ECI) for a cluster figure with as the figure’s symmetry degeneracy per site, and is the configuration-dependent correlation function in the interaction cluster. In practice, a finite number of terms is kept in the expansion (1), and the expansion becomes exactSanchez et al. (1984) as .
The ECI values are determined by fitting to a set of “input” formation enthalpies . was iteratively increased by performing GGA calculations for new structures based on the CE predictions, until a desired CE accuracy was reached, in particular establishing an agreement between the ground state predictions of the final CE and GGA. (For the oxide system such full consistency was established only within a target concentration range discussed in Sec.VI.1.) In order to evaluate the predictive power of the cluster expansion, the “leave-one-out” cross-validation (CV) score was calculated using the procedure implemented in ATAT:van de Walle and Ceder (2002) for each out of the input structures, a separate fitting of the values was performed with that one structure excluded from the fitted set. The actual energy of the excluded structure was then compared with the prediction of this “leave-one-out” fitting, and the difference was averaged over all the choices of . Unlike the conventional mean-squares fit error, which monotonously decreases upon increasing , the CV score is designed to measure the predictive power of the cluster expansion and has a minimum for a finite value, diverging if becomes too large.
Once the ground states for a range of concentrations have been identified, the ones that are stable at K are determined by the convexity condition; the given structure at concentration is stable if it lies below any straight line connecting other compounds at concentrations and . (The convex hull of the set of points in the vs plot represents the full range of enthalpies that may be achieved by the system. Stable compounds are those that form the vertices on the lower boundary of this convex hull.) For each stable compound one can define its “energetic depth” , i. e. the amount by which its energy would increase if it were decomposed into two stable compounds that are closest to it in concentration.
The phase diagrams were computed using semi-grand canonical Monte Carlo (MC) simulations (i. e. with the varying number of Eu and Gd cations) and the Metropolis algorithm implemented in ATAT. For the final phase diagram construction, we used an supercell based on primitive fcc translations (5832 cations in the simulation box). In the case of (Eu,Gd)O, we estimated the effects of the finite size and the commensurability with other ground state structures by also using and simulation boxes. We found that the box was commensurate with all the ground-state structures that have ordering temperature above 400 K, although this did not hold for some structures stable at lower (either identified by the CE ground state search or directly observed in MC simulations). All such low- structures in the oxides are limited to the Eu-rich composition range indicated below in the phase diagram. A series of simulations was performed at fixed chemical potentials with temperatures varying in 2–5 K increments. The equilibration and sampling passes were done with 1000–5000 Monte Carlo steps (flip attempts per site); longer runs of 10000 steps were performed for particularly difficult regions. The phase boundaries were then found by identifying the discontinuities (or cusps) in the dependence of the average concentration and enthalpy on temperature.
III Binary Chalcogenides: properties and electronic structure
Figure 1 shows the electronic band structures of EuO and GdO calculated using both GGA+U and QSGW approaches. The densities of states of all four end compounds calculated in GGA are shown in Fig. 2.
When Hubbard U is applied only to the rare-earth states, the conduction band structure of both EuO and GdO is in very good agreement between GGA and QSGW, the band gap being indirect. On the other hand, the addition of the Hubbard correction to the Eu orbitals proposed in Ref. Larson and Lambrecht, 2006 pushes the bands up at the point but not at , resulting in a direct band gap in disagreement with QSGW. Therefore, as mentioned above, we use GGA with applied only to the rare-earth states. Physically, this is reasonable because the states of either Gd or Eu are rather delocalized and have a sizable bandwidth, being thus amenable to treatment within GGA.
The main difference between the GGA and QSGW band structures is the position of the oxygen states in EuO. In GGA, they lie approximately 2.5 eV too high, resulting in a stronger hybridization of the majority-spin O states with the occupied states. This hybridization leads to a repulsion of these states from each other, and to a large spin splitting of the oxygen states. The QSGW results are in very good agreement with photoemission measurements.Eastman et al. (1969) By contrast, for GdO the oxygen states come out only a little too shallow. This is reasonable, because the gap between the oxygen and rare earth states in GdO is not accompanied by a discontinuity of occupation numbers; the latter is responsible for the band gap problem in semiconductors. We also note that QSGW significantly overestimates the energy of the unoccupied states, which appears to be its universal feature Chantis et al. (2007). This error is immaterial for our purposes.
The choice of eV and eV simultaneously produces the splitting between the occupied and unoccupied states of eV in good agreement with photoemission and inverse photoemission measurements for the Eu metal,Lang et al. (1981) the optical band gap at the X point of 0.94 eV in EuO consistent with the value of 0.95 eV measured at zero temperature, Busch and Wachter (1966, 1968) and the equilibrium lattice constant Å in good agreement with the experimental value of Å. The application of the same and values to EuS leads to the optical gap at the X point of 1.52 eV consistent with the zero-temperature value of 1.51 eV. Dimmock (1970) Due to the similar nature of the half-filled orbitals, these semiempirical and values were applied to both Eu and Gd states in the oxide and sulfide systems. Both GdO and GdS are metallic, as expected.
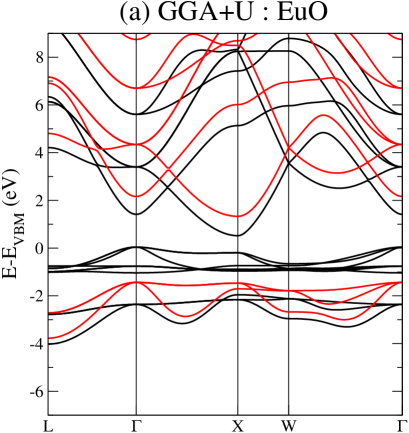
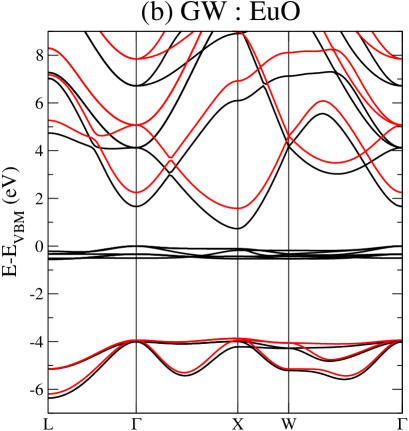

Table 1 includes the lattice parameters and elastic constants calculated in the FM state, along with the available experimental data for EuO, EuS, and GdS. The lattice constants are slightly underestimated by approximately 1%. The bulk moduli agree within the uncertainty of the experimental data. The elastic constants obtained by ultrasonic measurements have only been reported by one group. Shapira and Reed (1969) The calculated constant agrees well with this measurement for both EuO and EuS. The constant is overestimated by approximately 45%. The constant is also overestimated, but comparison is hindered by a very large experimental uncertainty. Note, however, that the bulk moduli obtained from these measured elastic constants are among the lowest ones reported in the literature; it is possible that these measurements are affected by off-stoichiometry. Therefore, it is unclear whether the disagreement in and is due to the inaccuracy of the GGA+U method or to experimental artifacts.
| Compound | , Å | |||||
| EuO | theory | 5.18 | 1.89 | 0.62 | 0.78 | 1.04 |
| exper. | 5.14 | 1.9111Ref. Shapira and Reed, 1969 | 0.42(8)111Ref. Shapira and Reed, 1969 | 0.54111Ref. Shapira and Reed, 1969 | 0.92(6);111Ref. Shapira and Reed, 1969 1.10222Ref. Jayaraman et al., 1974 | |
| GdO | theory | 4.92 | 3.54 | 0.63 | 0.72 | 1.60 |
| EuS | theory | 6.02 | 1.47 | 0.24 | 0.39 | 0.65 |
| exper. | 5.97 | 1.3111Ref. Shapira and Reed, 1969 | 0.11(8)111Ref. Shapira and Reed, 1969 | 0.27111Ref. Shapira and Reed, 1969 | 0.51;111Ref. Shapira and Reed, 1969 0.61;222Ref. Jayaraman et al., 1974 0.72333Ref. Goncharenko and Mirebeau, 1998 | |
| GdS | theory | 5.62 | 3.06 | 0.33 | 0.36 | 1.24 |
| exper. | 5.56 | 1.20 | ||||
IV Magnetic ordering
The magnetic ordering temperatures of pure EuO, EuS and GdS (69, 19, and 58 K, respectively), as well as for the entire range of solid solutions, are well below room temperature. Therefore, all structural phase equilibria involve paramagnetic (PM) phases with randomly oriented local moments on the Eu and Gd atoms. In principle, the PM enthalpies for the input structures can be estimated by fitting a number of magnetic configurations to a Heisenberg Hamiltonian and taking the constant term as the PM energy. However, doing this for more than a few simple ordered compounds is computationally prohibitive. Fortunately, relatively low magnetic ordering temperatures suggest that the use of ground state formation enthalpies to study configurational thermodynamics should not lead to large errors. Nevertheless, in this section we perform a few checks and discuss the possible modifications introduced in the cluster expansion by the replacement of FM formation enthalpies by the PM ones.
We considered several collinear magnetic configurations in seven simple (Eu,Gd)O and four (Eu,Gd)S compounds;not (a) these results are summarized in Table 2. Like in the rest of our study, the scalar-relativistic approximation was used here. Where a comparison can be made, we found good agreement with other published data.Kunes et al. (2005); Larson and Lambrecht (2006) For the (Eu,Gd)O system the FM state always has the lowest energy, except in pure GdO where the AFM phase with the ordering vector along [111] is slightly lower (by 0.6 meV/cation) than the FM phase. This indicates that restricting our CE study to the FM compounds is sufficient to yield an accurate description of the thermodynamic phase stability at K.
One can argue that FM enthalpies can also be used to predict the phase stability of oxides at higher temperatures. As mentioned in the introduction, the of Gd-doped EuO rises sharply to about 170 K at and then slowly decreases (see e.g. Ref. Ott et al., 2006). However, the magnetization curves for these higher- alloys have a distinctive double-dome shape. Specifically, the magnetization drops to a fairly small value at temperatures close to of pure Eu (“main dome”), and extends a relatively weak tail up to the actual elevated . While the mechanisms of this behavior are not completely understood, it is fair to assume that the dominant part of the PM-FM enthalpy difference is released in the temperature range of the “main dome.” Since the characteristic temperature of this feature does not strongly depend on the doping level, we expect that the PM-FM enthalpy difference is a featureless function of the concentration, and that it likely does not exceed 10 meV.not (b) This conclusion is generally consistent with the data in Table 2. Such correction is not likely to lead to significant changes in the phase diagram, and we therefore use FM enthalpies for oxides in the following.
In the sulfide system the situation is different for two reasons. First, as we discuss in Section VI.2, the FM CE predicts an ordered EuGd2S3 structure with a high ordering temperature, which is only marginally stable with respect to the pure FM EuS and GdS. Second, the magnetic order changes from FM in EuO to AFM in GdS, and the latter has a relatively high FM-AFM energy difference of meV/cation (see Table 2). Therefore, for EuS, EuGd2S3, and GdS we have estimated the PM-FM enthalpy differences, which are , , and meV/cation, respectively (see Appendix A). These differences are sufficient to make the EuGd2S3 structure marginally unstable. The effect on the phase diagram is considered in Section VI.2.
| Compound | FM | AFM | ferrimagnetic (111) | ||
|---|---|---|---|---|---|
| (111) | (001) | A A B | A A B | ||
| EuO | 0 | 12.2 | 15.8 | 8.2 | |
| GdO | 0 | -0.6 | 15.1 | 1.6 | |
| EuS | 0 | 0.1 | 3.4 | — | |
| GdS | 0 | -13.5 | 3.8 | — | |
| L10 EuGdO2 | 60.6 | — | 78.1 | — | |
| L11 EuGdO2 | -59.3 | -47.9 | — | — | |
| L11 EuGdS2 | 8.9 | 7.5 | — | — | |
| C6 Eu2GdO3 | -41.5 | — | — | -36.6 | -33.5 |
| C6 EuGd2O3 | -32.9 | — | — | -21.4 | -17.0 |
| C6 EuGd2S3 | -0.4 | — | — | -3.6 | -4.6 |
| FM | ferrimagnetic (001) | ||||
| AAAB | AAAB | AAAB | |||
| Z1 Eu3GdO4 | 5.8 | 17.1 | 29.9 | 22.4 | |
V cluster expansions
In this section, we characterize the CEs obtained at the end of the iterative CE construction procedure. These CEs are used in Sec.VI to evaluate the phase stability of Eu1-xGdxO and Eu1-xGdxS rocksalt alloys.
V.1 Eu1-xGdxO
The initial input set for the self-consistent CE construction included structures including all the atoms up to 4 cations per cell, except two such structures at EuGd3O4 composition. The final CE for Eu1-xGdxO has an input set of structures (identified throughout the CE iterations as potential ground states or otherwise as structures important for the CE accuracy), and uses an ECI set of 8 pairs, 12 triplets and 16 quadruplets. The predictive power of this CE is estimated by the CV score as 5.8 meV/cation, whereas the root-mean-square fit error for the input structures is only 2.8 meV/cation. The ground state search was performed among all the structures up to 30 atoms per cell ( configurations).
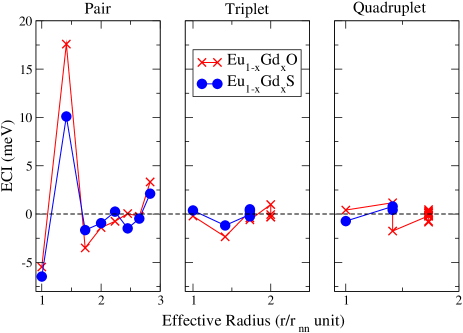
The ECIs values for Eu1-xGdxO as a function of the effective radius (the longest intersite distance in the cluster ) are shown in Figure 3 as the crosses connected by the red line. The leftmost panel in Fig. 3 displays the pairwise ECIs up to the eighth nearest-neighbor in the cation sublattice, and the right two panels correspond to triplet and quadruplet ECIs, respectively. By far the largest ECI is due to the second nearest-neighbor pair. It is positive, and its magnitude (17.6 meV) is more than three times greater than that of the negative first nearest-neighbor ECI ( meV). Overall, the pair interactions are stronger than all other cluster ECIs. As explained in Section VII below, the large positive ECI for second-nearest neighbors is due to the significant energy gain from displacing O atoms towards Gd in the Eu-O-Gd double-bond patterns along any of the [001] directions. This ECI is the main driving force for the stabilization of the L11 cation ordering that we find below in Sec.VI.1, as indeed could be expectedDucastelle (1991) from a simple CE involving only pair interactions and between nearest-nighbor and second-nearest neighbor atoms of the same magnitude as in our actual CE.
V.2 Eu1-xGdxS
The cluster expansion has been constructed with a CV score of 4.0 meV/cation using input structures and an ECI set of 8 pairs, 7 triplets, and 3 quadruplets. The set of structures used for ground state search contained configurations, and the root-mean-square fit error for the input structures is only 2.2 meV/cation.
The pair and many-body ECIs for the oxide and sulfide systems are qualitatively similar (see Fig. 3). However, we shall see in Sec.VI that there is a striking difference in the ground-state energetics, convex hull structures, and the phase diagrams of the oxides and the sulfides. This difference stems from the quantitative change in the ECIs: while the positive second nearest-neighbor pair ECI is still the strongest one in the sulfide system, it is reduced by about 40% compared to the oxides. This reduction results in the destabilization of the L11 cation ordering, as we discuss in Section VII.
VI phase stability
VI.1 Eu1-xGdxO
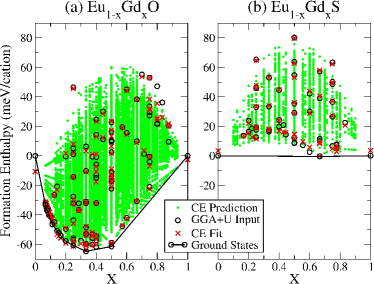
Figure 4a shows the calculated formation enthalpy diagram for the entire range of in Eu1-xGdxO. Each green dot represents the composition and the CE formation enthalpy of one of the structures used in the ground state search. The fitted values for the 148 input structures are shown by the red crosses, and the input are shown by open black circles. The input set contains eight stable compounds, serving as the breaking points on the GGA+U convex hull. (This convex hull is shown by the black solid line in Fig. 4.) These compounds represent tentative ground state predictions, in a sense that they all were predicted as ground states throughout the CE iterations and confirmed by direct GGA+U calculations. Most of them have small energetic depths (see Table 3); the phase diagram calculations show that only two of these, with and , can appear at reasonably high temperatures. Therefore, it is not necessary to insist on the precise prediction of the ground state sequence at . Indeed, we found that the convex hull corresponding to our final CE fitted Hamiltonian was not the same as that for the input set (i.e., it changes even throughout the final CE iterations). However, full self-consistency was achieved for , allowing us to identify the compounds with and 0.5 as unambiguously established ground states. The structural information for these two compounds is given in Appendix B. Despite the slight disagreement regarding the identity of the low-temperature ground states at , the overall convex hull shape and the values agreed well between the input (GGA+U) and the final predicted (CE) convex hulls, and the identity, formation enthalpies and energetic depths of the and 0.5 ground states are accurately reproduced. Note also that the resulting CE fitting does not have an exact meaning of a formation enthalpy, because the vanishing of the fitted quantity for the end members is not enforced. In particular, pure EuO has a spurious “formation enthalpy” of meV/cation in the CE fitting. However, the shape of the ground-state convex hull suggests that the fit error for pure EuO should not affect the phase diagram significantly at where the fitting is quite accurate.
| Formula unit | () | |||||
| Eu1-xGdxO: | ||||||
| EuO (B1) | 0 | 0.0 | 0.0 | -10.6 | ||
| Eu14GdO15 (C2/m) | 1/15 | -33.0 | -32.8 | -31.2 | 1.1 | 0.5 |
| Eu12GdO13 (P) | 1/13 | -36.8 | -36.5 | -33.9 | 0.7 | 0.0 |
| Eu8GdO9 (P1m) | 1/9 | -46.5 | -46.4 | -42.6 | 3.2 | 0.4 |
| Eu10Gd2O12 (C2/c) | 1/6 | -54.0 | -53.8 | -55.7 | 0.5 | 2.7 |
| Eu8Gd2O10 (P) | 1/5 | -57.8 | -56.8 | -59.2 | 1.0 | 1.3 |
| Eu6Gd2O8 (C2/c) | 1/4 | -60.7 | -58.3 | -61.3 | 0.4 | 0.4 |
| Eu8Gd4O12 (C2/m) | 1/3 | -64.7 (-62.8) | -61.3 | -63.7 | 3.8 | 2.9 |
| EuGdO2 (L11) | 1/2 | -61.5 (-59.9) | -60.6 | -60.1 | 12.9 | 11.6 |
| GdO (B1) | 1 | 0.0 | 0.0 | -2.6 | ||
| Eu1-xGdxS: | ||||||
| EuS (B1) | 0 | 0.0 | 0.0 | 3.4 | ||
| EuGd2S3 (C6) | 2/3 | -0.4 (-2.0) | 26.8 | -0.3 | 0.4 | 3.8 |
| GdS (B1) | 0 | 0.0 | 0.0 | 3.6 | ||
The calculated formation enthalpies for both the unambiguously established and tentatively predicted ground-state Eu1-xGdxO compounds identified throughout the CE iterations and confirmed by direct GGA+U calculations are listed in Table 3 along with their CE-fitted values, as well as the energetic depths found from both calculated and fitted formation enthalpies. The fit error for all these compounds is less than 4 meV/cation. The ground state with the largest has L11 structure, which is an A1B1 (111) superlattice, i.e. it is formed by alternating (111) layers of pure Eu and Gd. Among the six compounds with there are three other pure Eu/Gd superlattices: A14B (134), A12B (124), and A8B2 (123), where the numbers in brackets denote the orientation of the pure cation layers, A stands for Eu, and B for Gd. It is clear that no particular superlattice direction is preferred.
For the region above , our phase diagram predicts phase separation into the L11 phase and pure GdO. Since GdO, as has been mentioned above, has not been observed in the rocksalt structure considered here, we have further investigated its stability. In the zincblende structure its energy is found to be 56 meV/cation higher compared to rocksalt, but the equilibrium lattice parameter 5.31 Å is close to that ( Å) reported Bist and Srivastava (1971) for zincblende GdO. The fact that experimental data suggest zincblende structure, while our calculation predicts it to be significantly less stable than rocksalt, may be due to the likely off-stoichiometry in experiment. Further, we considered the stability of GdO with respect to decomposition into Gd2O3 and metallic Gd. Gd2O3 occurs in three different structures Adachi and Imanaka (1998), cubic (80-atom unit cell) under 777 K, monoclinic (30-atom unit cell) from 777 to 1727 K, and hexagonal above 1727 K. We used fully relaxed lattice constants of Gd2O3, Gd and GdO. Among the three phases of Gd2O3, the cubic phase is the most stable, its energy per formula unit being lower by approximately 90 meV/cation compared to the monoclinic phase. Rocksalt GdO energy was found to be 21 meV/cation (per Gd atom) lower compared to the mixture of Gd2O3 and Gd. From this we can deduce that if the system is in equilibrium with an oxygen reservoir, GdO can only form in a narrow range of the oxygen chemical potential . Indeed, using the following relations:
| (2) |
where the inequalities follow from the stability of GdO with respect to both reduction to Gd and oxidation to Gd2O3, we find that the double inequality is satisfied only in the 63 meV-wide range of . In reality this range depends on temperature and is subject to the uncertainty in the calculated reaction enthalpy, but nevertheless this feature is consistent with the difficulty in stabilizing GdO experimentally.
The calculated phase diagram for the oxide system is shown in Fig. 5a. It is seen from Table 3 that most of the ground states with have rather small energetic depths , suggesting that these orderings would only occur at very low temperatures. Indeed, our simulations show that many of these phases only appear well below room temperature, so that the corresponding phase transformations are kinetically inaccessible. In fact, phase transformations occurring above K involve only the phases with and . Therefore, for we have only determined the approximate boundary (i. e. the solubility limit) of the disordered (Gd,Eu)O phase, which is shown by a dot-dashed line in Fig. 5a.
There are several interesting features in this phase diagram. (1) A broad miscibility gap exists in the Gd-rich region with the critical point close to 1200 K and . (2) A continuous order-disorder transition occurs for the L11 phase, whose line terminates at a tricritical point ( K, ) on the Eu-rich end and at a critical endpoint at the Gd-rich end ( K, ). Thermodynamics mandates that the slope of the solubility line at the tricritical point should be different from the slope of the ordering line, but this difference is too small to be revealed in Monte Carlo simulations. On the other hand, the slopes of the binodals do not change at the critical endpoint, but their curvatures do. (3) There is a eutectoid triple point at K at which the disordered phase decomposes in a mixture of C2/m and L11 phases. (4) A point of equal concentrations caps the single-phase C2/m region; this point is close to the eutectoid point.
Apart from the variations due to different phase transitions, the solubility of GdO in EuO grows approximately linear with temperature up to the critical point near 1200 K, with a slope of about 0.06%/K.
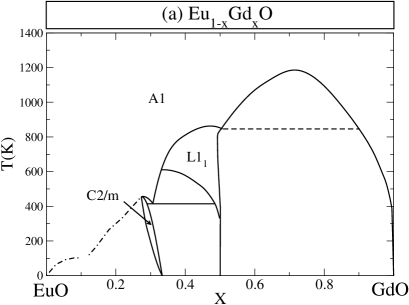
As discussed in Appendix C, the ordering transition for the prominent L11 ground state occurs at K and is second order around the stoichiometric EuGdO2 composition. The physics behind this ordering transition can be further illustrated by considering the CE Hamiltonian [Eq. (1)] as a generalized Ising model, in which Eu atoms are represented by pseudo-spin and Gd’s by , and the pseudo-spins form an fcc lattice. In the L11 structure, the nearest neighbor interaction is fully frustrated, while the second nearest neighbor interaction is not frustrated (the second-nearest cation neighbors are always of dislike type). Thus, we can regard this structure as being formed by four interpenetrating simple cubic lattices, all of which have AFM ordered pseudo-spins, and which are coupled only through longer-range interactions and through the order-from-disorder mechanism. Indeed, the transition temperature in our MC simulations (about K) is close to that of the simple cubic lattice under the assumption that its first nearest-neighbor interaction is equal to the second nearest neighbor interaction of the original fcc lattice (920 K using the best known estimate of in the AFM Ising model from Ref. Häggkvist et al., 2007).
VI.2 Eu1-xGdxS
The formation enthalpy diagram for the sulfide system (all compounds including GdS are assumed to be FM) is shown in Fig. 4b. This sulfide system has a very different ground-state convex hull, compared to the oxide system. There is only one marginally stable compound at with the formation enthalpy of only meV/cation (see Table 3); this number is, in fact, smaller than the precision of our GGA+U calculations. This compound has the hexagonal C6 structure (sometimes referenced as “” in CE investigations); its structural parameters are given in Appendix B. This structure is a superlattice composed of pure GdO and EuO (111) layers alternating in a 2:1 pattern (similar in this respect to the L11 structure which has a 1:1 pattern).
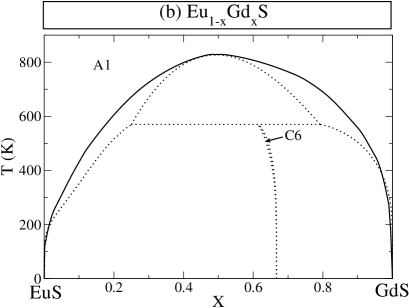
The computed phase diagram is depicted in Fig. 5b. Dotted lines correspond to the FM CE, and solid lines to the corrected CE, designed to represent the PM phase equilibrium. This corrected CE was obtained by changing the nearest-neighbor pair ECI in our FM CE from meV to meV, which results in the correct paramagnetic formation enthalpy of C6 EuGd2S3 (see Section IV and Appendix A).
In the FM phase diagram, there are two major features: a wide miscibility gap with a critical point at K and , and a peritectoid triple point at K, at which the two disordered phases are in equilibrium with a new predicted C6 phase. The C6 phase forms a very narrow single-phase region with concentration slightly decreasing at elevated temperatures. The very small energetic depth of the C6 phase is significantly overestimated by the CE fit (see Table 3); we therefore expect that the temperature of the peritectoid point is also overestimated. In fact, in the paramagnetic phase diagram (solid lines) the C6 phase is unstable (). Note, however, that the GGA+U value of (positive in the FM case and negative in the paramagnetic case) is comparable to the precision of our GGA+U calculations; we thus conclude that our accuracy is not sufficient to confidently select among the two scenarios shown in Fig 5b by the solid and dotted lines.
We have also calculated the enthalpy of the reaction similar to the second line of Eq. 2 with the -phase of Gd2S3 and rocksalt GdS, which comes out at 2.8 eV. Thus, in equilibrium with a sulfur reservoir the rocksalt GdS is stable against both reduction and oxidation in the 2.8 eV-wide range of the S chemical potential. This is consistent with the fact that this phase is readily obtained experimentally.
The overall shape of the sulfide phase diagram is much more symmetric compared to the oxide system, which is consistent with weaker triplet ECI’s (see Fig. 3). However, the solubility limit of GdS in EuS is still greater than that of EuS in GdS, similar to the oxide system. The solubility limit of GdS in EuS is about 7% at 300 K and increases almost linearly at a rate of about 0.07%/K.
VII Anion-mediated deformational interaction
The ground states with L11 or a closely related D4 cation ordering (the latter having the same number of like and dislike neighbors as the L11 for any given neighbor distance), appear quite common for rocksalt chalcogenides: in addition to EuGdO2, such ground states were recently predicted for a number of rocksalt tellurides.Barabash et al. (2008a); Barabash and Ozolins (2010) In the case of tellurides, D4 appears a more typical ground state, although L11 typically differs by only a few meV/cation in energy. Conversely, in EuGdO2, D4 is only 2.6 meV/cation higher in energy than L11 (which is sufficient for L11 to prevail up to K, due to the near identity of the entropic contributions to the free energy of both structures.) The appearance of L11 and D4 ground states has been related to the elastic softness to a deformation along the [111] direction,Barabash et al. (2008b) which is indeed typical for rocksalt compounds, generally hardest along the [100] cation-anion bond direction. Further, it appears that the other high- phase that we have discussed, namely the tentatively predicted C6 EuGd2S3 phase, follows the same elastic trend, since it is a (111) superlattice just like L11.
It may not be immediately clear, however, why L11 EuGdS2 is not stable. More generally, while similar electronic structures for both oxides and sulfides are expected from the isovalent electronic configurations (and confirmed by first-principles calculations), their ground-state formation enthalpy diagrams are very different: the oxides exhibit a convex hull with large and negative formation enthalpies, but the sulfides have positive formation enthalpies for all ordered compounds except one at which is close to zero (Fig. 4 and Table 3). We shall now demonstrate that it is possible to understand the origin of this difference, as well as to get a deeper understanding of the elastic mechanism leading to the predominance of L11 and D4 in rocksalt chalcogenide alloys, by examining the mechanism of atomic relaxation in these alloys.
Let us decompose the formation enthalpy in two parts: the “unrelaxed chemical” part which is calculated for the undistorted (cubic) lattice at the lattice parameter given by the Vegard law, and due to the additional full relaxation from these ideal Vegard positions (thus, ). This decomposition is shown in Table 4 for the L10 and L11 structures, which straddle almost the entire range of formation enthalpies at for both oxide and sulfide systems. The difference between the enthalpies of the L10 and L11 structures gives the characteristic ordering enthalpy; its decomposition in the unrelaxed chemical and relaxation parts is also included in Table 4.
| Composition | Structure | ||||
|---|---|---|---|---|---|
| EuGdO2 | L10 | 63.1 | -2.4 | 26.0 | 94.1 |
| L11 | 37.1 | -96.5 | |||
| EuGdS2 | L10 | 88.1 | -8.0 | 25.5 | 45.0 |
| L11 | 62.6 | -53.0 |
First, we see that the “chemical” part of the ordering energy is almost identical for both oxide and sulfide compounds, reflecting the fact that they are isoelectronic and their bonding properties are therefore very similar. Second, the values of are significantly larger for both sulfide compounds compared to the oxide ones. This feature can be explained by a notably larger lattice mismatch in the sulfide system (see Table 1), which forces the Gd-S and Eu-S bonds to deviate further away from their equilibrium lengths.
For the tetragonal L10 cation ordering, symmetry forbids the relaxation of all internal coordinates; only the lattice parameters are allowed to relax. It is seen from Table 4 that this relaxation yields only a relatively small energy gain. However, in the rhombohedral L11 structure, the coordinates of the oxygen atoms are not fixed by symmetry. The relaxation of these coordinates makes the dominant contribution to , which is almost twice as large in the oxide system as it is in the sulfide system. Moreover, for L11 GdEuO2 this internal relaxation overcomes the positive contribution and makes the formation enthalpy large and negative. In the sulfide system is about two times smaller and does not fully overcome the term.
Thus, we conclude that the L11 structure is strongly favored with respect to L10 because it allows the anion atoms to relax. Specifically, consider the octahedral cage occupied by an anion atom. In the L10 structure the Gd and Eu layers are stacked along the [001] direction; both inequivalent anion sites (in the Gd and Eu layers) are located at inversion centers. Thus, the opposite vertices of the octahedral cage are occupied by like cations (either both Eu or both Gd). On the other hand, in the L11 phase (or in the closely competing D4 phase) this inversion symmetry is fully broken in the sense that all the opposing vertices of all octahedral cages are occupied by unlike cations. Since Gd and Eu ions have notably different radii, the anion atoms shift towards Gd. The structure with the largest possible degree of inversion symmetry breaking maximizes the ability of the system to gain energy from anion relaxations. The opposite vertices of the octahedral cage are separated by the next-nearest neighbor distance in the cation sublattice. Thus, the relaxation of the anion atom connecting the next-nearest neighbor pair is the mechanism generating the dominant positive ECI for this pair (see Fig. 3). The fact that this ECI is smaller for sulfides is fully consistent with the data in Table 4, and is not surprising because this anion-mediated interaction mechanism is sensitive to the anion size. Indeed, one can argue that the problem of finding the ground state with such interaction is largely equivalent to finding the most favorable packing of atoms to minimize the deviations from the optimal bond lengths.
In order to understand the relative importance of the anion and cation relaxations, we have recalculated the formation enthalpies of all compounds by restricting the atomic relaxations to anions only and fixing the cations to the sites of an ideal fcc lattice with the volume given by the Vegard law. These values are listed in Table 3 as . For all oxide compounds the formation enthalpies obtained in this way agree very well with the fully relaxed formation enthalpies (), indicating that anion relaxation in these structures are unrestricted by symmetry whereas the cation relaxations are insignificant. For the EuGd2S3 compound in the sulfide system, however, the corresponding error is large. The reason is that this compound is a 2:1 layered superlattice, which makes it possible to adjust the interlayer Gd-S and Eu-S bond lengths by changing the cation layer separations. This is not possible in the L11 structure, which is a 1:1 layered superlattice, because all the cation layer separations are equal there.
VIII Summary
We have computed the temperature-phase diagram of two isovalent alloy systems Eu1-xGdxO, Eu1-xGdxS by using first-principles calculations combined with the standard cluster expansion and Monte-Carlo simulations. Very different ground-state convex hulls are obtained for the two systems: the oxides form ordered compounds with large and negative formation enthalpies, but sulfides have only one marginally stable compound. The dominant configurational cation interaction comes from the second-nearest neighbor pair and is mediated by the relaxation of the O atom lying in between. The difference between oxides and sulfides is attributed to the difference in the anion size. Gd has a high equilibrium solubility in EuO and EuS even at room temperature, which indicates that rather heavy doping is possible without the precipitation of secondary phases.
Acknowledgements.
K.D.B. is grateful to Peter Dowben for numerous stimulating discussions. The work at UNL was supported by the Defence Threat Reduction Agency (Grant No. HDTRA1-07-1-0008) and the Nebraska Research Initiative. K.D.B. is a Cottrell Scholar of Research Corporation. The work at UCLA was supported by the U.S. Department of Energy, Nuclear Energy Research Initiative Consortium NERI-C under Grant No. DE-FG07-07ID14893. The calculations performed at Oak Ridge National Laboratory Center for Nanophase Materials Sciences were sponsored by the Scientific User Facilities Division, Office of Basic Energy Sciences, U.S. Department of Energy. The calculations have also been supported by the National Science Foundation through TeraGrid resourcesCatlett and et al. (2007) provided by SDSC, NCSA, and Purdue University.Appendix A Paramagnetic energies of sulfide compounds
For pure EuS, GdS, and C6 EuGd2S3 structures predicted to be stable by the FM CE, we investigated the paramagnetic phase regime by fitting magnetic configurational energies to the classical Heisenberg model. For the pure GdS, up to the third-nearest-neigbor exchange interactions were fitted using four magnetic configurations: (i) FM, (ii) AFM type I (AFMI) along the [001] direction with alternating spins, (iii) AFM type II (AFMII) along [111] with alternating spins, and (iv) AFM type III (AFMIII) along [001] with two layers of alternating spins. As expected, we found that AFMII is the ground state for GdS with the mean-field transition temperature of 63 K slightly above the experimental value 58 K. The fitting produces the paramagnetic formation enthalpy of meV relative to the FM configuration.
The paramagnetic formation enthalpy of the pure EuS was also obtained using the same magnetic configurations as for the pure GdS. The paramagnetic formation enthalpy turns out to be 1.3 meV above the FM phase with the mean-field value of the FM ordering temperature 10.2 K, somewhat less than the experimental value of 19 K.
For the C6 EuGd2S3 structure, only the nearest-neigbor interactions were considered but decomposed into four distinct types of Heisenberg exchange parameters due to the layered structure and two cation species. In the [111] direction, the C6 structure establishes an A2B1 type superlattice, where each plane normal to the direction is composed of only one cation species. This superlattice structure allows two types of intra-layer exchange interactions, Gd-Gd and Eu-Eu, and two types of inter-layer interactions, Gd-Gd and Gd-Eu. A total of nine magnetic configurations were constructed in the 6-cation (112) supercell doubled along the [111] direction of the 3-cation unit cell, and also in the 6-cation (211) supercell doubled in the normal direction to [111]. The magnetic configurations included, in the 112 supercell, AABAAB, AABAAB, AABAAB, AABAAB, AABAAB, AABAAB, AABAAB, and in the 211 supercell, one of the two cations in either A or B layer has its spin flipped, while all other cation spins are kept opposite in directions. Its paramagnetic energy determined by the fitting with the four exchange interaction parameters is slightly lower by 0.6 meV than the FM configuration.
Appendix B Predicted stable compounds
The predicted ground-state structures with reasonably high ordering temperature are described below with their atomic positions fully relaxed using VASP. Additionally, for each structure, its crystallographic space group is identified for clarification.
B.1 Eu8Gd4O12
Space group #12 : C2/m, base-centered monoclinic
Primitive unit-cell: a=12.507 Å, b=7.187 Å, c=8.766 Å,
=90.00∘, =90.24∘, =90.00∘
Wyckoff positions: Eu(2i)=(0.084,1/2,0.339),
Eu(2i)=(0.7503,1/2,0.995), Eu(4j)=(0.832,0.750,0.330),
Gd(2g)=(0,0.251,0), Gd(2i)=(0.417,1/2,0.667),
O(2i)=(0.075,1/2,0.851), O(4j)=(0.153,0.237.0.168),
O(2h)=(0,0.224,1/2), O(2i)=(0.260,1/2,0.512),
O(2i)=(0.432,1/2,0.159).
B.2 EuGdO2
Space group #166: Rm, trigonal (rhombohedral)
strukturbericht designation of cation order: L11
Primitive unit-cell: a=3.536 Å, b=3.536 Å, c=17.741 Å,
=90.00∘, =90.00∘, =120.00∘
Wyckoff positions: Eu(1b)=(0,0,1/2),
Gd(1a)=(0,0,0), O(2c)=(0,0,0.260).
B.3 EuGd2S3
Space group #164: Pm1, hexagonal
strukturbericht designation of cation order: C6
Primitive unit-cell: a=4.041 Å, b=4.041 Å, c=9.959 Å,
=90.00∘, =90.00∘, =120.00∘
Wyckoff positions: Eu(1b)=(0,0,1/2),
Gd(2d)=(1/3,2/3,0.155), S(1a)=(0,0,0),
S(2d)=(1/3,2/3,0.681).
Appendix C Order-disorder transition in L11
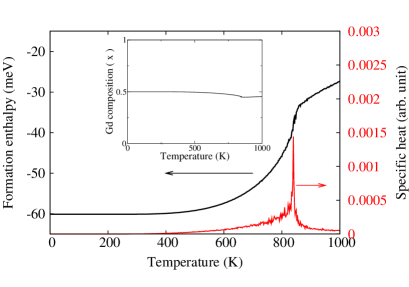
In finite-size MC simulations there is no formal distinction between a first- and second-order transition, and the nature of the transition can be unambiguously determined only from a finite-size scaling analysis. Although we did not perform such an analysis, strong evidence in favor of the second-order character of the ordering transition in L11 EuGdO2 is revealed by the behavior of the enthalpy and the heat capacity. A MC heating simulation was performed starting with the L11 structure at K. Figure 6 shows the temperature dependence of the heat capacity, as well as the total enthalpy, along the composition line corresponding to a constant chemical potential meV (the concentration is shown in the inset). The L11 phase persists up to 840 K, where a continuous order-disorder transition is indicated by the characteristic peak of the heat capacity, as well as the continuous change of the enthalpy. Away from the Eu0.5Gd0.5O composition, the L11 ordered and the disordered phases maintain the same features, although the heat capacity peak is reduced.
References
- Samokhvalov et al. (1988) A. A. Samokhvalov, N. A. Viglin, B. A. Gizhevskii, T. I. Arbuzova, and N. M. Chebotaev, Phys. Status Solidi B 148, 361 (1988).
- (2) Y. Shapira, S. Foner, and T. B. Reed, phys. Rev. B 8, 2299 (1973); 8, 2316 (1973).
- Steeneken et al. (2002) P. G. Steeneken, L. H. Tjeng, I. Elfimov, G. A. Sawatzky, G. Ghiringhelli, N. B. Brookes, and D.-J. Huang, Phys. Rev. Lett. 88, 047201 (2002).
- Schmehl et al. (2007) A. Schmehl, V. Vaithyanathan, A. Herrnberger, S. Thiel, C. Richter, M. Liberati, T. Heeg, M. Röckerath, L. F. Kourkoutis, S. Mühlbauer, et al., Nature Mater. 6, 882 (2007).
- Aoyama et al. (1992) T. Aoyama, Y. Oka, K. Honda, and C. Mori, Nucl. Instr. Meth. Phys. Res. A 314, 590 (1992).
- Mireshghi et al. (1994) A. Mireshghi, G. Cho, J. S. Drewery, W. S. Hong, T. Jing, H. Lee, S. N. Kaplan, and V. Perez-Mendez, IEEE Transactions on Nuclear Science 41, 915 (1994).
- Ketsman et al. (2007) I. Ketsman, Y. B. Losovyj, A. Sokolov, J. Tang, Z. Wang, K. D. Belashchenko, and P. A. Dowben, Appl. Phys. A 89, 489 (2007).
- Schultz et al. (2010) D. Schultz, B. Blasy, J. C. Santana, C. Young, J. C. Petrosky, J. W. McClory, D. LaGraffe, J. I. Brand, J. Tang, W. Wang, et al., J. Phys. D: Appl. Phys. 43, 075502 (2010).
- Eliseev et al. (1989) A. A. Eliseev, O. A. Sadovskaya, and A. V. Pavlov, Inorg.Mater. 25, 10 (1989).
- Dimmock (1970) J. O. Dimmock, IBM J. Res. Dev. 314, 301 (1970).
- Matsumoto et al. (2004) T. Matsumoto, K. Yamaguchi, M. Yuri, K. Kawaguchi, N. Koshizaki, and K. Yamada, J. Phys.: Condens. Matter 16, 6017–6028 (2004).
- Ott et al. (2006) H. Ott, S. J. Heise, R. Sutarto, Z. Hu, C. F. Chang, H. H. Hsieh, H.-J. Lin, C. T. Chen, and L. H. Tjeng, Phys. Rev. B 73, 094407 (2006).
- Shafer and McGuire (1968) M. W. Shafer and T. R. McGuire, J. Appl. Phys. 39, 588 (1968).
- Mauger (1977) A. Mauger, Phys. Stat. Sol. (b) 84, 761 (1977).
- Adachi and Imanaka (1998) G. Adachi and N. Imanaka, Chem. Rev. 98, 1479 (1998).
- Bist and Srivastava (1971) B. M. S. Bist and O. N. Srivastava, Phys. Stat. Sol. (a) 7, K9 (1971).
- McGuire and Holtzberg (1972) T. R. McGuire and F. Holtzberg, AIP Conf. Proc. 5, 855 (1972).
- Kunes et al. (2005) J. Kunes, W. Ku, and W. P. Pickett, J. Phys. Soc. Japan 74, 1408 (2005).
- Larson and Lambrecht (2006) P. Larson and W. R. L. Lambrecht, J. Phys.: Condens. Matter 18, 11333 (2006).
- Ghosh et al. (2004) D. B. Ghosh, M. De, and S. K. De, Phys. Rev. B 70, 115211 (2004).
- Ingle and Elfimov (2008) N. J. C. Ingle and I. S. Elfimov, Phys. Rev. B 77, 121202(R) (2008).
- Bousquet et al. (2010) E. Bousquet, N. A. Spaldin, and P. Ghosez, Phys. Rev. Lett. 104, 037601 (2010).
- Sinjukow and Nolting (2003) P. Sinjukow and W. Nolting, Phys. Rev. B 68, 125107 (2003).
- Sinjukow and Nolting (2004) P. Sinjukow and W. Nolting, Phys. Rev. B 69, 214432 (2004).
- Arnold and Kroha (2008) M. Arnold and J. Kroha, Phys. Rev. Lett. 100, 046404 (2008).
- Blöchl (1994) P. E. Blöchl, Phys. Rev. B 50, 17953 (1994).
- Kresse and Joubert (1999) G. Kresse and D. Joubert, Phys. Rev. B 59, 1758 (1999).
- Perdew et al. (1996) J. P. Perdew, K. Burke, and M. Ernzerhof, Phys. Rev. Lett. 77, 3865 (1996).
- Liechtenstein et al. (1995) A. I. Liechtenstein, V. I. Anisimov, and J. Zaanen, Phys. Rev. B 52, R5467 (1995).
- (30) G. Kresse and J. Hafner, Phys. Rev. B 48, 13115 (1993); G. Kresse and J. Furthmüller, Comput. Mater. Sci. 6, 15 (1996); Phys. Rev. B 54, 11169 (1996).
- Dederichs et al. (1984) P. H. Dederichs, S. Blügel, R. Zeller, and H. Akai, Phys. Rev. Lett. 53, 2512 (1984).
- Solovyev (2008) I. V. Solovyev, J. Phys.: Condens. Matter 20, 293201 (2008).
- (33) www.flapw.de.
- Busch and Wachter (1966) G. Busch and P. Wachter, Phys. Kondens. Materie 5, 232 (1966).
- Busch and Wachter (1968) G. Busch and P. Wachter, Z. Angew. Phys. 26, 2 (1968).
- Eastman et al. (1969) D. E. Eastman, F. Holtzberg, and S. Methfessel, Phys. Rev. Lett. 23, 226 (1969).
- Zhou and V.Ozolins (2009) F. Zhou and V.Ozolins, Phys. Rev. B 80, 125127 (2009).
- Wood and Zunger (1985) D. M. Wood and A. Zunger, J. Phys. A 18, 1343 (1985).
- Davidson (1983) E. Davidson, Methods in Computational Molecular Physics, ed. by G.H.F. Diercksen and S. Wilson (Plenum, New York, 1983), vol. 113 of NATO Advanced Study Institute, Series C, p. 95.
- Kotani et al. (2007) T. Kotani, M. van Schilfgaarde, and S. V. Faleev, Phys. Rev. B 76, 165106 (2007).
- Faleev et al. (2004) S. V. Faleev, M. van Schilfgaarde, and T. Kotani, Phys. Rev. Lett. 93, 126406 (2004).
- van Schilfgaarde et al. (2006) M. van Schilfgaarde, T. Kotani, and S. Faleev, Phys. Rev. Lett. 96, 226402 (pages 4) (2006).
- Chantis et al. (2006) A. N. Chantis, M. van Schilfgaarde, and T. Kotani, Phys. Rev. Lett. 96, 086405 (2006).
- Chantis et al. (2007) A. N. Chantis, M. van Schilfgaarde, and T. Kotani, Phys. Rev. B 76, 165126 (2007).
- Bruneval et al. (2006) F. Bruneval, N. Vast, L. Reining, M. Izquierdo, F. Sirotti, and N. Barrett, Phys. Rev. Lett. 97, 267601 (2006).
- Chambers et al. (2004) S. Chambers, T. Droubay, T. Kaspar, M. Gutowski, and M. van Schilfgaarde, Surf. Sci. Lett. 554, 81 (2004).
- Shishkin et al. (2007) M. Shishkin, M. Marsman, and G. Kresse, Phys. Rev. Lett. 99, 246403 (2007).
- Sanchez et al. (1984) J. M. Sanchez, F. Ducastelle, and D. Gratias, Physica A 128A, 334 (1984).
- Zunger (1994) A. Zunger, in Statics and Dynamics of Alloy Phase Transformations, NATO ASI (1994), p. 361.
- van de Walle and Ceder (2002) A. van de Walle and G. Ceder, J. Phase Equil. 23, 348 (2002).
- van de Walle and Asta (2002) A. van de Walle and M. Asta, Modelling Simul. Mater. Sci. Eng. 10, 521 (2002).
- Lang et al. (1981) J. K. Lang, Y. Baer, and P. A. Cox, J. Phys. F: Metal Phys. 11, 121 (1981).
- Shapira and Reed (1969) Y. Shapira and T. B. Reed, J. Appl. Phys. 40, 1197 (1969).
- Jayaraman et al. (1974) A. Jayaraman, A. K. Singh, A. Chatterjee, and S. U. Devi, Phys. Rev. B 9, 2513 (1974).
- Goncharenko and Mirebeau (1998) I. N. Goncharenko and I. Mirebeau, Phys. Rev. Lett. 80, 1082 (1998).
- not (a) For the magnetic ordering tests, most of the structures were selected due to their small size and high symmetry, while the largest 8-atom compound due to a suspected magnetic instability inferred from the early problems in electronic convergence (later linked to an instability of the RMM algorithm).
- not (b) In the single-sublattice mean-field theory, the PM-FM energy difference is equal to . According to the argument from the text, the for this estimate should be that of pure Eu.
- Ducastelle (1991) F. Ducastelle, Order and Phase Stability in Alloys (North Holland, Amsterdam, 1991), vol. 3, p. 142.
- Häggkvist et al. (2007) R. Häggkvist, R. Rosengren, P. H. Lundow, K. Markström, D. Andrén, and P. Kundrotas, Adv. Phys. 56, 653 (2007).
- Barabash et al. (2008a) S. V. Barabash, V. Ozolins, and C. Wolverton, Phys. Rev. Lett. 101, 155704 (2008a).
- Barabash and Ozolins (2010) S. V. Barabash and V. Ozolins, Phys. Rev. B 81, 075212 (2010).
- Barabash et al. (2008b) S. V. Barabash, V. Ozolins, and C. Wolverton, Phys. Rev. B 78, 214109 (2008b).
- Catlett and et al. (2007) C. Catlett and et al., HPC and Grids in Action (IOS Press, Amsterdam, 2007).