11email: zhongmu.li@gmail.com 22institutetext: Institute for Astronomy and History of Science and Technology, Dali University, Dali 671003, China
Estimation of absorption line indices of early-type galaxies using colours
Abstract
Context. Absorption line indices are widely used to determine the stellar population parameters such as age and metallicity of galaxies, but it is not easy to obtain the line indices of some distant galaxies that have colours available.
Aims. This paper investigates the correlations between absorption line indices and colours.
Methods. A few statistical fitting methods are mainly used, via both the observational data of Sloan Digital Sky Survey and a widely used theoretical stellar population model.
Results. Some correlations between widely used absorption line indices and colours are found from both observational data of early-type galaxies and a theoretical simple stellar population model. In particular, good correlations between colours and widely used absorption line indices such as Dn(4000), H, H, H, Mg1, Mg2, and Mgb, are shown in this paper.
Conclusions. Some important absorption line indices of early-type galaxies can be estimated from their colours using correlations between absorption line indices and colours. For example, age-sensitive absorption line indices can be estimated from or colours and metallicity-sensitive ones from or . This is useful for studying the stellar populations of distant galaxies, especially for statistical investigations.
Key Words.:
galaxies: stellar content — galaxies: formation — galaxies: evolution1 Introduction
The determination of stellar population properties (e.g., age, metallicity, and element abundances) of galaxies has long been an important subject in galaxy studies (Tantalo & Chiosi, 2004). The evolutionary population synthesis technique has been widely used in such works (see, e.g., Renzini, 2006). Many works confirm that some spectral features, which are called absorption line indices (the most famous ones are the well-known Lick indices), can reliably estimate stellar population properties (e.g., Worthey, 1994; Kong & Cheng, 2001; Bruzual & Charlot, 2003; Thomas et al., 2003; Gallazzi et al., 2005). The definitions of widely used line strength indices can be seen in the papers of Bruzual A. (1983), Worthey (1994), Worthey & Ottaviani (1997), Huchra et al. (1996), Diaz et al. (1989), Balogh et al. (1999), and Maraston et al. (2009) among others. Although absorption line indices can determine the stellar population properties of galaxies well, this method cannot be used to study very distant (e.g., ) galaxies because of the difficulty obtaining reliable spectral line indices. Meanwhile, some colours of such distant galaxies can be measured well. If some estimations of absorption line indices of galaxies can be derived from their colours, it will be able to investigate the stellar population properties of galaxies better, and then the formation and evolution of galaxies.
This work proposes to study the correlations between colours and absorption line indices, and then presents a new method for estimating absorption line indices from the colours of galaxies. The organization of the paper is as follows. In Sect. 2, we briefly introduce the observational data and theoretical stellar population model used in this work. In Sect. 3, we study the correlations between colours and absorption line indices using the data of some early-type galaxies and theoretical stellar populations. Then the estimation of absorption line indices of galaxies from colours are discussed. Finally, we give our conclusions in Sect. 4.
2 Observational data and theoretical stellar population model used in this work
This work uses the photometric data of Sloan Digital Sky Survey (SDSS, Abazajian et al. 2009) and a catalogue of absorption line indices of SDSS galaxies, which was built by the Max Plank Institute for Astrophysics (MPA) (see, e.g., Gallazzi et al. 2005). SDSS is an imaging and spectroscopic survey of the high Galactic latitude sky visible from the northern hemisphere. The results of SDSS includes the photometry and spectroscopy of a large sample of galaxies. These data are reliable and have been widely used in studies in recent years. In addition, the catalogue of absorption line strength indices built by the MPA includes stellar absorption line indices corrected for sky lines using the best-fit model spectrum to interpolate over the sky line contamination. The catalogue supplies some stellar absorption line indices defined by Bruzual A. (1983), Worthey (1994), Worthey & Ottaviani (1997), Huchra et al. (1996), Diaz et al. (1989), and Balogh et al. (1999) for some of the galaxies observed by SDSS. Some of these indices are sensitive to stellar age (e.g., H and Dn(4000)), metallicity (e.g., Mgb), or element abundances, and are therefore usually used to determine the stellar population properties of galaxies. One can read Gallazzi et al. (2005) as an example. Because the catalogue supplies the absorption line indices of galaxies and the photometric data of these galaxies are available in the SDSS, we chose the catalogue as a data source of this study.
The absorption line indices and photometric data of each galaxy is combined according to some special identifiers (objID and SpecobjID) of galaxies. One can refer to the web pages of the SDSS for more details. When selecting sample galaxies, only galaxies with small uncertainties in magnitudes and absorption line indices are chosen in our working samples. This guarantees that observational uncertainties in colours and absorption line indices lead to a small uncertainty in the final results. All sample galaxies have magnitude uncertainties less than 0.05 mag, and the uncertainty of each absorption line index is less than the average uncertainty of the line indices of all galaxies in the Fourth Data Release of SDSS (SDSS-DR4). As a result, 2287 early-type galaxies with concentration index 2.6 were chosen for our working galaxy sample. When calculating the colours of galaxies, the values for -corrections and galactic extinctions supplied by SDSS database were used directly.
We chose the widely used simple stellar population model of Bruzual & Charlot (2003) (hereafter BC03 model) for this work. BC03 model is a theoretical stellar population model that has been compared to the main features of galaxies observed by SDSS, and it has been widely used in all kinds of stellar population studies. The model supplies both colours and absorption line indices of simple stellar populations under a spectral resolution close to SDSS. Thus it is convenient to use the model with the data of SDSS for this investigation.
3 Correlations between colours and absorption line indices
3.1 Observational results
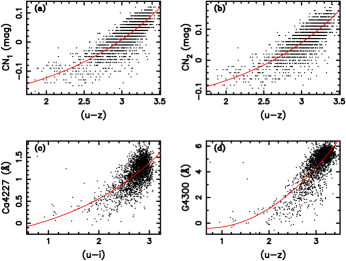
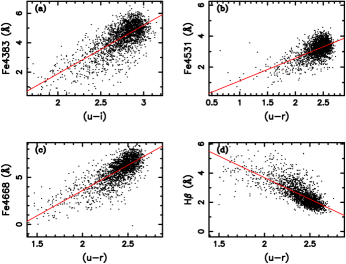
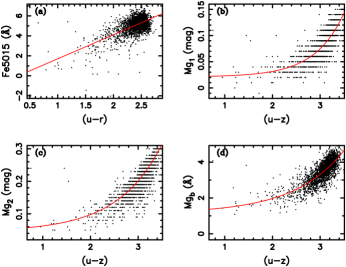
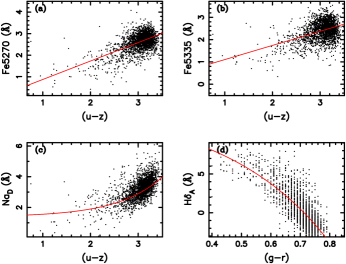
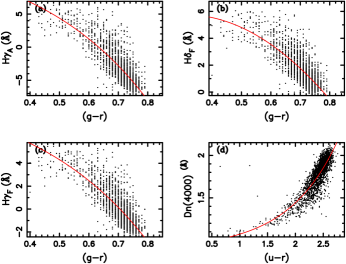
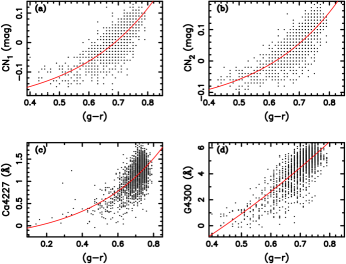
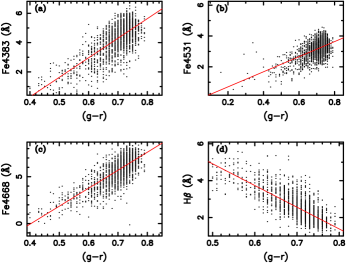
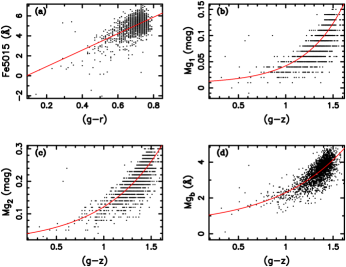
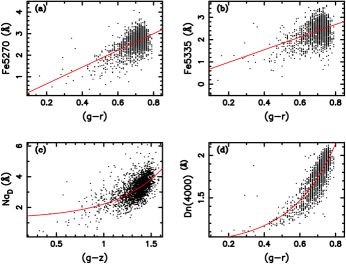
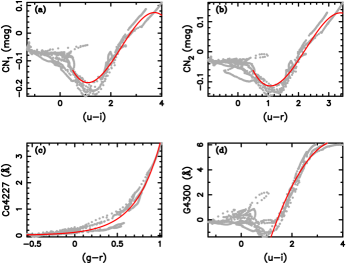
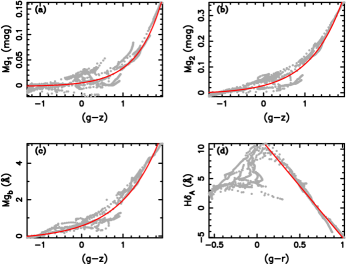
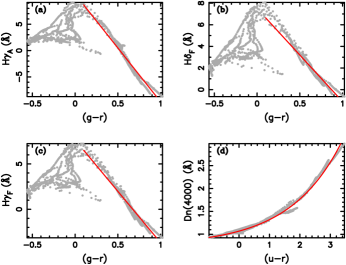
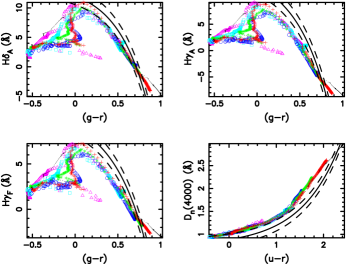
Using the data of colours and absorption line indices of 2287 early-type galaxies, we investigated the correlations between 26 widely used absorption line indices and colours. The results show that most absorption line indices correlate to some colours. We therefore tried to find the best colour for estimating each line index by comparing the correlations of all pairs consisting of a line index and a colour (hereafter line index-colour pair). Because 26 absorption line indices and 10 colours respecting , , , , and magnitudes are taken into account, the correlations for 260 line index-colour pairs are investigated in this work. Then for each absorption line index, we find the correlation with the least scatter from all correlations relating to it. The results show that in 26 line indices, 20 correlate well with some colours. In Figs. 1–5, the best-fit correlations are compared with observational data. The detailed best-fit correlations are then listed in Table 1, together with their 1 scatters. Because the data of a few (about 15 with blue colours) galaxies do not appear statistically significative, they are not used for giving the final fitting correlations between colours and absorption line indices. This results in the various galaxy samples used for studying each pair of line index and colour. In order to give results, any correlation relating to one line index that has the least scatters when using the whole sample (2287 galaxies) for fitting is then taken as the best-fit correlation of the line index (see Table 1), although this correlation shows bigger fitting uncertainties when taking smaller (excluding galaxies with significant data) galaxy samples.
| Best fit Correlation | Unit | |
|---|---|---|
| CN1=-0.254+0.033 e(u-z)/1.446 | 0.031 | mag |
| CN2=-0.180+0.027 e(u-z)/1.382 | 0.030 | mag |
| Ca4227=-0.678+0.450 e(u-i)/1.980 | 0.242 | |
| G4300=-0.001-1.170 +0.871 | 0.807 | |
| Fe4383=-4.697+3.296 | 0.707 | |
| Fe4531=-0.357+1.466 | 0.442 | |
| Fe4668=-7.147+5.376 | 0.904 | |
| H=9.596-2.952 | 0.515 | |
| Fe5015=-0.703+2.408 | 0.696 | |
| Mg1= 0.021+0.0004 e(u-z)/0.612 | 0.016 | mag |
| Mg2= 0.045+0.006 e(u-z)/0.920 | 0.026 | mag |
| Mgb= 1.133+0.124 e(u-z)/1.046 | 0.411 | |
| Fe5270=0.021+0.855 | 0.356 | |
| Fe5335=0.468+0.636 | 0.394 | |
| NaD=1.379+0.061 e(u-z)/0.934 | 0.580 | |
| H=13.874-1.906 e(g-r)/0.359 | 1.415 | |
| H=15.154-3.011 e(g-r)/0.392 | 1.548 | |
| H=3.266+16.141 -26.131 | 0.746 | |
| H=10.898-1.934 e(g-r)/0.408 | 0.921 | |
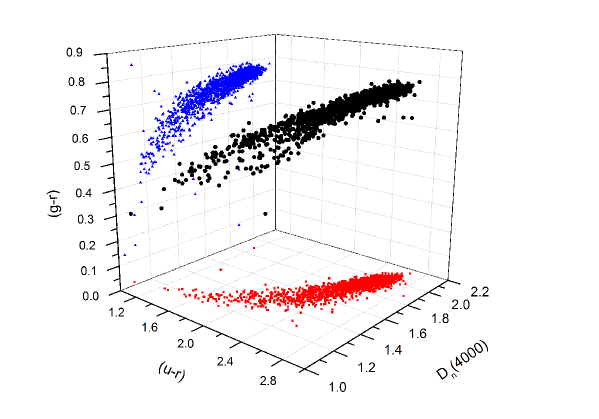
| Dn(4000)=0.892+0.059 e(u-r)/0.896 | 0.102 |
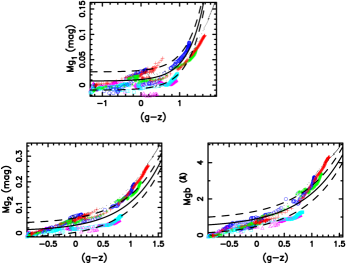
As we see, Figs. 1–5 show that there are good correlations between most absorption line indices and colours. Compared to Table 1, it is found that these correlations can be fitted well via linear, exponential, or polynomial correlations. However, as we see, most of the best-fit correlations relate to the band. According to the report of the SDSS, magnitudes in band usually have larger uncertainties than others. Thus it is better to take colours relating only to bands when using SDSS data for research. We therefore find the best-fit correlations between absorption line indices and the colours only relating to magnitudes. The results are shown in Figs. 6-9 and Table 2. The results of H, H, H and H are not repeated here, because one can refer to Figs. 1–5 and Table 1 for details of their results.
| Correlation | Unit | |
|---|---|---|
| CN1=-0.228+0.018 e(g-r)/0.271 | 0.032 | mag |
| CN2=-0.159+0.015 e(g-r)/0.263 | 0.031 | mag |
| Ca4227=-0.391+0.271 e(g-r)/0.410 | 0.250 | |
| G4300=-20.271+14.374 e(g-r)/1.288 | 0.784 | |
| Fe4383=-5.047+13.353 | 0.718 | |
| Fe4531=-0.279+ 4.893 | 0.454 | |
| Fe4668=-7.753+19.206 | 0.898 | |
| H=10.801-11.774 | 0.466 | |
| Fe5015=-0.715+8.233 | 0.707 | |
| Mg1= 0.008+0.003 e(g-z)/0.411 | 0.018 | mag |
| Mg2= 0.008+0.023 e(g-z)/0.626 | 0.028 | mag |
| Mgb= 0.420+0.486 e(g-z)/0.738 | 0.429 | |
| Fe5270=-0.103+3.879 | 0.359 | |
| Fe5335= 0.415+2.828 | 0.397 | |
| NaD=1.253+0.134 e(g-z)/0.506 | 0.553 | |
| Dn(4000)=0.936+0.047 e(g-r)/0.247 | 0.114 |
3.2 Results from theoretical stellar population model
The previous section shows some good correlations between observational absorption line indices and colours of early-type galaxies. However, the reliability of these correlations remains unclear. If these correlations can be found in theoretical stellar population models, they should be believable. This section tries to search for similar correlations from the theoretical stellar population model of Bruzual & Charlot (2003). Because early-type galaxies are close to simple stellar populations, we take the data of some simple stellar populations (with 6 metallicities and 220 ages) for our study. It shows that there are good correlations between some absorption line indices and colours of the BC03 model. The main results can be seen in Figs. 10 to 12, in which the results of a few absorption line indices that correlate well to colours are shown. We see that there are clear correlations between colours and CN1, CN2, Ca4227, G4300, Mg1, Mg2, Mgb, H, H, H, H, and Dn(4000), for stellar populations within the colour ranges listed in Table 3.
| Best Fit Correlation | Colour Range [mag] | |
|---|---|---|
| CN1=-0.011-0.341 +0.202 -0.028 | 0.026 | 0.504.00 |
| CN2=0.090-0.425 +0.261 -0.039 | 0.020 | 0.503.47 |
| Ca4227=0.012+0.110 e(g-r)/0.290 | 0.140 | -0.561.02 |
| G4300=-9.681+8.353 -1.087 | 0.584 | 1.004.00 |
| Mg1=-0.002+0.007 e(g-z)/0.610 | 0.012 | -1.321.95 |
| Mg2=-0.005+0.033 e(g-z)/0.795 | 0.021 | -1.321.95 |
| Mgb=-0.206+0.764 e(g-z)/0.956 | 0.298 | -1.321.95 |
| H=12.436-17.446 | 1.050 | 0.101.02 |
| H=10.701-20.424 | 1.214 | 0.101.02 |
| H=7.503-8.613 | 0.642 | 0.101.02 |
| H=7.639-11.328 | 0.677 | 0.101.02 |
| Dn(4000)=0.754+0.315 e(u-r)/1.711 | 0.051 | -0.993.47 |
3.3 Comparison of colour-absorption line index correlations derived from observational data and the theoretical model
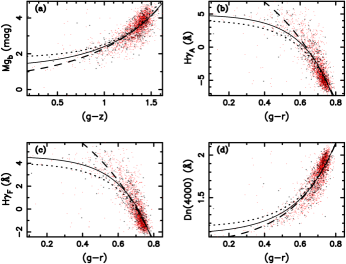
Because both the observational data and the theoretical stellar population model show good correlations between absorption line indices and colours, we compare two kinds of results here. The detailed comparisons are shown in Figs. 13 and 14. As can be seen, both observational data and the BC03 model show similar trends for how absorption line indices change with colours. In particular, both observational data and the BC03 model show exponential correlations for three metallicity-sensitive absorption line indices (Mg1, Mg2, Mgb) and colours (Fig. 13), and the scatters of observational and theoretical correlations are very close. However, the correlations between four age-sensitive line indices and colours, which were derived from observational data and BC03 model, are shown to be different (Fig. 14). When the observational data show some exponential correlations, the data of BC03 model report some linear correlations for Balmer lines and colours. In addition, although both the observational data and BC03 model give exponential correlations for Dn(4000) and , the two correlations show clear differences. The differences between the observational data of SDSS and theoretical stellar population model possibly result from the limitation of the stellar population model and observational uncertainties. When we tried to find the correlation between Dn(4000) and of BC03 stellar populations, the result showed that there is no clear correlation between the two indices; however, the observational data imply a correlation between them, as can be seen in Fig. 9. This suggests that simple stellar populations in the BC03 model are different from the sample galaxies. Therefore, the internal difference between simple stellar population models and real galaxies should mainly contribute to the differences between correlations derived from observational data and theoretical stellar populations.
As a whole, the observational data of SDSS and the BC03 theoretical stellar population model give similar trends for the correlations between absorption line indices and colours. Thus both correlations derived from observational data and theoretical stellar population model can be used for future investigations, especially for some statistical investigations.
3.4 Potential applications of results and discussions
It is shown that there are good correlations between most absorption line indices and colours of galaxies. Therefore, it is possible to measure absorption line indices of galaxies that have no reliable spectral data, but with colours available, and then to give stellar population studies to some distant galaxies.
The correlations derived from the observational data of SDSS are actually more suitable for statistical or relative studies because of the somewhat large uncertainties of fitted correlations. In addition, the final correlations are more suitable for studying early-type galaxies, because our results are derived from an early-type galaxy sample. However, the results can also work for relative studies of all galaxies. The reason is that both early and late type galaxies obey some similar correlations of absorption line indices and colours. In Fig. 15, a few correlations derived from different (early, late, mixed) galaxy samples are compared. It is shown that, although there are differences among the correlations derived from three galaxy samples, they give similar trends for the change of line indices with colours.
As expected, the correlations derived from the observational data and the BC03 model makes it possible to measure some absorption line indices of galaxies from colours. When using the results, one needs to take the colour ranges (see Table 3) of stellar populations into account. In addition, the results are actually model dependent. Different results may be obtained using correlations derived from various stellar population models.
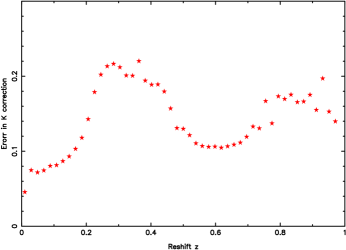
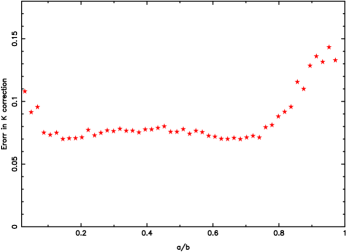
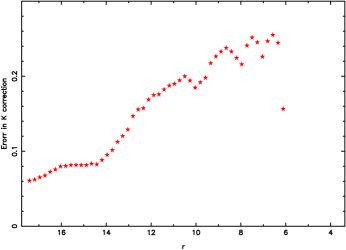
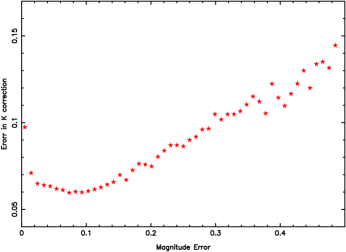
Although absorption line indices correlate to colours, and it is possible to estimate line indices of galaxies, the application of these correlations depends on the reliability of colour determinations. Because corrections of the magnitudes can affect the magnitudes directly, it is very important to take the uncertainty of correction into account when using colours to estimate the absorption line indices of galaxies. This will determine what galaxies the correlations found in this paper can be used for studying. To make this clear, we investigated how the correction uncertainty changes with some of the properties of galaxies. In detail, the relations between uncertainty in correction and redshift, magnitude, concentration index, a/b ratio, correction, redshift error, and magnitude error are investigated. The uncertainty of correction is calculated from redshift uncertainty, according to the determination of the correction in the SDSS process. As a result, the uncertainty in correction is found to correlate to the a/b ratio, Petrosian magnitude in band, and magnitude error in band. However, there is no simple changing trend between correction uncertainty and redshift. More detailed results can be seen in Figs. 16 to 19. These results will be helpful for estimating the correction uncertainty of each galaxy, and then for the effects on determining absorption line indices. Because it shows that correction uncertainty is strongly correlated to magnitude error, the result suggests using magnitude error for estimating the correction uncertainties of galaxies.
Furthermore, the 1 uncertainties in fitting correlations are shown to be different for galaxy samples within various redshift ranges. Table 4 shows the detailed results. It will be useful for estimating the final uncertainties when the fitting correlations are used to calculate the absorption line indices of galaxies with various distances.
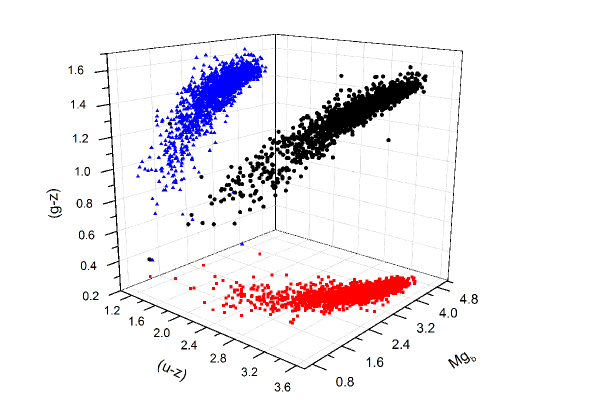
In addition, in order to show whether two colours can determine the absorption line indices better or not, we compared the correlations between absorption line indices and different colours. The example results are shown in Figs. 20 and 21. In Fig. 20, the relations among Mgb, and are plotted, while Fig. 21 is for the correlations among Dn (4000), and . As can be seen, the two figures show clearly that, when taking two colours to estimate an age or metallicity sensitive absorption line index, the uncertainty does not become smaller, compared to the case using only one colour. Therefore, it is unnecessary to use two or more colours to estimate absorption line indices of galaxies.
| Correlation | Redshift Range | Galaxy Number | Unit | |
|---|---|---|---|---|
| Mg1= 0.021+0.0004 e(u-z)/0.612 | 0.05 | 411 | 0.016 | mag |
| Mg1= 0.021+0.0004 e(u-z)/0.612 | 0.05 0.10 | 1626 | 0.015 | mag |
| Mg1= 0.021+0.0004 e(u-z)/0.612 | 0.10 | 250 | 0.016 | mag |
| Mg2= 0.045+0.006 e(u-z)/0.920 | 0.05 | 411 | 0.027 | mag |
| Mg2= 0.045+0.006 e(u-z)/0.920 | 0.05 0.10 | 1626 | 0.026 | mag |
| Mg2= 0.045+0.006 e(u-z)/0.920 | 0.10 | 250 | 0.024 | mag |
| Mgb= 1.133+0.124 e(u-z)/1.046 | 0.05 | 411 | 0.435 | mag |
| Mgb= 1.133+0.124 e(u-z)/1.046 | 0.05 0.10 | 1626 | 0.394 | mag |
| Mgb= 1.133+0.124 e(u-z)/1.046 | 0.10 | 250 | 0.471 | mag |
| H=13.874-1.906 e(g-r)/0.359 | 0.05 | 411 | 1.697 | |
| H=13.874-1.906 e(g-r)/0.359 | 0.05 0.10 | 1626 | 1.372 | |
| H=13.874-1.906 e(g-r)/0.359 | 0.10 | 250 | 1.841 | |
| H=15.154-3.011 e(g-r)/0.392 | 0.05 | 411 | 1.855 | |
| H=15.154-3.011 e(g-r)/0.392 | 0.05 0.10 | 1626 | 1.518 | |
| H=15.154-3.011 e(g-r)/0.392 | 0.10 | 250 | 2.138 | |
| H=3.266+16.141 -26.131 | 0.05 | 411 | 0.698 | |
| H=3.266+16.141 -26.131 | 0.05 0.10 | 1626 | 0.713 | |
| H=3.266+16.141 -26.131 | 0.10 | 250 | 0.927 | |
| H=10.989-1.934 e(g-r)/0.408 | 0.05 | 411 | 1.158 | |
| H=10.989-1.934 e(g-r)/0.408 | 0.05 0.10 | 1626 | 0.903 | |
| H=10.989-1.934 e(g-r)/0.408 | 0.10 | 250 | 1.271 | |
| Dn(4000)=0.892+0.059 e(u-r)/0.896 | 0.05 | 411 | 0.102 | |
| Dn(4000)=0.892+0.059 e(u-r)/0.896 | 0.05 0.10 | 1626 | 0.103 | |
| Dn(4000)=0.892+0.059 e(u-r)/0.896 | 0.10 | 250 | 0.097 |
The absorption line indices used in this paper rely on the STELIB spectral library (Le Borgne et al. 2003). When other spectral libraries are used for defining absorption line indices, the differences caused by spectral libraries should be taken into account, while the effects of spectral libraries on colours can be neglected (see, e.g., Bruzual & Charlot 2003). Therefore, before using the correlations found by this work to estimate absorption line indices, we suggest transforming the absorption line indices to the STELIB library (Prugniel & Soubiran, 2001). A simple way is to use the offsets (Johansson et al., 2010) between indices on the Lick/IDS library (Burstein et al. 1984; Faber et al. 1985) and those on spectral libraries including MILES (Sánchez-Blázquez et al. 2006), ELODIE (Prugniel & Soubiran 2001), and STELIB. However, it seems unnecessary to do transformations for some widely used indices such as H, H, Mgb, Fe5270, Fe5335, Fe5406, Fe5709, Fe5782, and NaD, because the STELIB, MILES, ELODIE, and Lick/IDS libraries give close values for these absorption line indices (Johansson et al., 2010).
4 Conclusions
We have investigated the correlations between absorption line indices and colours using observational data relating to SDSS and a widely used stellar population model. Both observational data of early-type galaxies and a theoretical stellar population model show good correlations between some line indices and colours of stellar populations. These correlations can be fitted as linear, exponential, or polynomial relations. The fitting uncertainties are found to be similar to, but somewhat larger than, the metrical uncertainties of line indices.
In particular, it was found that some widely used metallicity and age-sensitive line indices, such as Mgb, Fe5270, Fe5335, H, H, H, and Dn(4000), are well correlated to some colours. The relative uncertainties caused by the fitted correlations are small when transforming colours into absorption line indices.
The results suggest that some estimates of absorption line indices can be obtained from the colours of galaxies. Our results are possibly useful for estimating the absorption line indices of galaxies that have no reliable spectral data available, and then for studying the stellar metallicities, ages, and element abundances.
Acknowledgements.
We gratefully acknowledge Profs. R. Peletier and Gang Zhao for constructive suggestions on this work. We also thank E. Casuso, Prof. Zongwei Li, and Jinliang Hou for useful suggestions and the MPA of Germany for sharing their data on the internet. This work has been supported by Chinese Postdoctoral Science Foundation, Chinese National Science Foundation (Grant No. 10963001), and the Yunnan Science Foundation (Composite Population Studies of Galaxies Basing on Photometric Data). Zhongmu Li gratefully acknowledges the support of K. C. Wong Education Foundation, Hong Kong. Funding for the SDSS and SDSS-II was provided by the Alfred P. Sloan Foundation, the Participating Institutions, the National Science Foundation, the U.S. Department of Energy, the National Aeronautics and Space Administration, the Japanese Monbukagakusho, the Max Planck Society, and the Higher Education Funding Council for England. The SDSS was managed by the Astrophysical Research Consortium for the Participating Institutions.References
- Abazajian et al. (2009) Abazajian, K. N., Adelman-McCarthy, J. K., Agüeros, M. A., et al. 2009, ApJS, 182, 543
- Balogh et al. (1999) Balogh, M. L., Morris, S. L., Yee, H. K. C., Carlberg, R. G., & Ellingson, E. 1999, ApJ, 527, 54
- Bruzual & Charlot (2003) Bruzual, G. & Charlot, S. 2003, MNRAS, 344, 1000
- Bruzual A. (1983) Bruzual A., G. 1983, ApJ, 273, 105
- Burstein et al. (1984) Burstein, D. and Faber, S. M. and Gaskell, C. M. and Krumm, N. 1984, ApJ, 287, 586
- Diaz et al. (1989) Diaz, A. I., Terlevich, E., & Terlevich, R. 1989, MNRAS, 239, 325
- Faber et al. (1985) Faber, S. M. and Friel, E. D. and Burstein, D. and Gaskell, C. M. 1985, ApJS, 57, 711
- Gallazzi et al. (2005) Gallazzi, A., Charlot, S., Brinchmann, J., White, S. D. M., & Tremonti, C. A. 2005, MNRAS, 362, 41
- Huchra et al. (1996) Huchra, J. P., Brodie, J. P., Caldwell, N., Christian, C., & Schommer, R. 1996, ApJS, 102, 29
- Johansson et al. (2010) Johansson, J. and Thomas, D. and Maraston, C. 2010, MNRAS, 406, 165
- Kong & Cheng (2001) Kong, X. & Cheng, F. Z. 2001, MNRAS, 323, 1035
- Le Borgne et al. (2003) Le Borgne, J.-F. and Bruzual, G. and Pelló, R. and Lançon, A. and Rocca-Volmerange, B. and Sanahuja, B. and Schaerer, D. and Soubiran, C. and Vílchez-Gómez, R. 2003, A&A, 402, 433
- Maraston et al. (2009) Maraston, C., Nieves Colmenárez, L., Bender, R., & Thomas, D. 2009, A&A, 493, 425
- Prugniel & Soubiran (2001) Prugniel, P. and Soubiran, C. 2001, A&A, 369, 1048
- Renzini (2006) Renzini, A. 2006, ARA&A, 44, 141
- Sánchez-Blázquez et al. (2006) Sánchez-Blázquez, P. and Peletier, R. F. and Jiménez-Vicente, J. and Cardiel, N. and Cenarro, A. J. and Falcón-Barroso, J. and Gorgas, J. and Selam, S. and Vazdekis, A. 2006, MNRAS, 371, 703
- Tantalo & Chiosi (2004) Tantalo, R. & Chiosi, C. 2004, MNRAS, 353, 917
- Thomas et al. (2003) Thomas, D., Maraston, C., & Bender, R. 2003, MNRAS, 339, 897
- Worthey (1994) Worthey, G. 1994, ApJS, 95, 107
- Worthey & Ottaviani (1997) Worthey, G. & Ottaviani, D. L. 1997, ApJS, 111, 377