Web Sciences Center, University of Electronic Science and Technology of China - 610054 Chengdu, PRC
Computer science and technology Social and economic systems World Wide Web, Internet
A robust ranking algorithm to spamming
Abstract
Ranking problem of web-based rating system has attracted many attentions. A good ranking algorithm should be robust against spammer attack. Here we proposed a correlation based reputation algorithm to solve the ranking problem of such rating systems where user votes some objects with ratings. In this algorithm, reputation of user is iteratively determined by the correlation coefficient between his/her rating vector and the corresponding objects’ weighted average rating vector. Comparing with iterative refinement (IR) and mean score algorithm, results for both artificial and real data indicate that, the present algorithm shows a higher robustness against spammer attack.
pacs:
89.20.Ffpacs:
89.65.-spacs:
89.20.Hh1 Introduction
The abundance of available information troubled people every day, and information filtering technique is quickly developed in recent years. An important aspect in information filtering is the rating system. There are a range of daily examples of rating system. Such systems include opinion websites (Ebay, Amazone, Movielens, Netflix, etc.), where users evaluate objects. Ranking is one of the most common way to describe the evaluation aggregation result, which gives a simple representation of the comparative qualities of objects.
PageRank is the most widely applied algorithm for search engines which rank websites based on the directed hyperlink graph [1]. Recently, some iterative algorithms are used in scientific citation network to rank scientists [2]. Both the hyperlink network and scientific citation network are unipartite systems, but many other rating systems have a bipartite structure with two kinds of node: users as evaluators and objects as candidates [3]. In this paper, we consider the ranking problem in such rating systems where users vote objects with ratings, and devise algorithms to accurately rate objects.
Ranking objects according to their average ratings is a straightforward statistical method. However, in the open evaluation system, the user can be somebody who are not serious about voting, or he/she is not experienced in the corresponding field and gives some unreasonable ratings. What even worse is that the user might be an evil spammer who gives biased ratings on purpose. Therefore, the evaluation by simply averaging all ratings may be less accurate. Building a reputation system for users is a good way to solve this problem [4, 5]. Users with higher reputations are assigned more weight. Such reputation mechanisms are widely used in online systems, such as online shops [6], online auctions [7], Wikipedia [8], P2P sharing networks [9], etc.
There are already some ranking algorithms based on reputation estimate [12, 13, 10, 11]. In [12, 13], an iterative refinement (IR) algorithm is proposed. A user’s reputation is inversely proportional to the difference between his/her rating vector and the corresponding objects’ weighted average rating vector. Weighted rating of all objects and reputation of all users are recalculated at each step, until the change of weighted ratings is less than a certain threshold between two iteration steps. Kerchove and Dooren [11] modify the iterative refinement algorithm by assigning trust to each individual rating. In most previous works, the influence of spammer attack in rating systems is always ignored.
In this paper, we proposed a correlation based ranking algorithm. Reputation of user is determined by the correlation coefficient between the user’s rating vector and the corresponding objects’ weighted average rating vector. By comparing with other algorithms, the effectiveness of the correlation based ranking algorithm was tested using artificial data. The results show that correlation based ranking algorithm is more robust than other algorithms. Finally, we use two distinct real data sets (Movielens and Netflix) to evaluate the effectiveness of the algorithm.
2 The correlation model
The rating system we considered can be represented by a bipartite network, which consists of a set of users who have each rated some subset of the complete set of objects. We use Latin letters for users and Greek letters for objects to distinguish them. Consequently denotes the rating given by user to object . The set of users who rated a given object is denoted by , while the set of objects rated by a user is denoted by . The degree of object (i.e. the number of ratings given to object ) is denoted as and the degree of user (i.e. the number of ratings given by user ) is denoted as .
We use to represent the aggregate estimated quality of object , and the reputation of user . The quality of an object depends on the evaluations it received, and can be defined as the weighted average of ratings to this object:
| (1) |
According to the objects’ qualities, the Pearson correlation coefficient between the rating vector of user and the corresponding objects’ quality vector is given by:
| (2) |
where and are resoectively the standard deviations of rating vector of user and the corresponding objects’ quality vector, and and are their expected values.
Correlation coefficient is a good way to quantify the similarity between two vectors. As a user who has more similar ratings to the weighted average ratings should have a higher reputation, the reputation of a user is given based on this similarity:
| (3) |
3 Results on artificial data
When creating the artificial data, we assume that each user has a certain magnitude of rating error and each object has a certain true intrinsic quality . At each time step , a user-object pair , on which the rating has not been given (at all ), is chosen. The rating is determined as
| (5) |
where error is drawn from a probability distribution parameterized by user ’s error magnitude. Rating lying out of the range are truncated. To achieve a certain sparsity of the resulting data, the total number of generated ratings is hence ().
As evident from the power-law-like distribution of the number of ratings given by individual users and received by individual objects in the real data sets [3], there should be a preferential attachment mechanism in the evolution of the rating system [14]. In the real data sets, the more ratings a user have given, the higher probability he will give a new rating. And the more ratings an object have received, the higher probability it will receive a new rating. Based on these observations, at each time step , we choose a user-object pair using preferential attachment mechanism. The probabilities of choosing user and object at time step are
| (6) |
and
| (7) |
where and are the degree of user and object at time step . As the degrees are all zero at the initial time, we have used in the above equations.
To create artificial data, we set , and (which corresponds to approximately ratings). Objects’ qualities and users’ ratings are limited to the range . Objects’ qualities are drawn from the uniform distribution , users’ error magnitudes are drawn from the uniform distribution , and individual rating errors are drawn from the normal distribution . We choose and in the simulation.
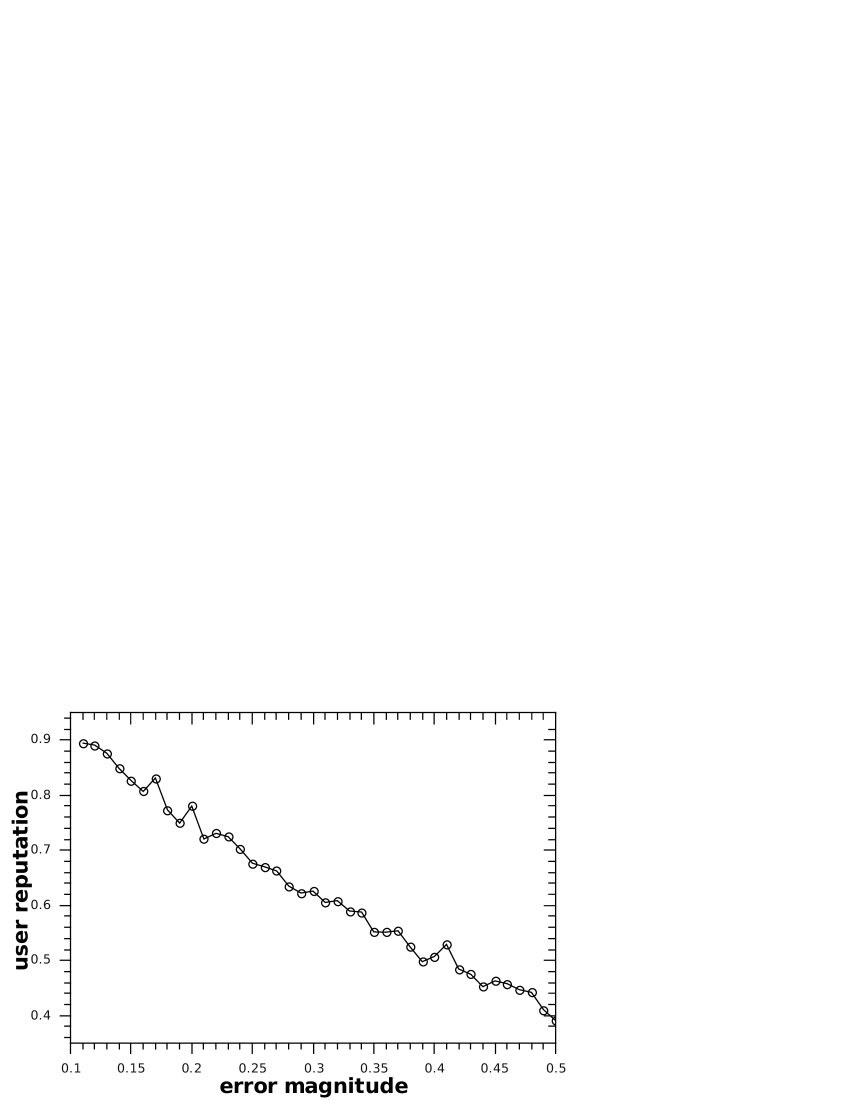
To get a more accurate ranking, a good ranking algorithm should give higher reputations to the users with lower error magnitudes. As the users’ error magnitudes are continuous, we divide the error magnitude into bins with the length 0.01. The mean reputations of users with error magnitudes in the same bins are then evaluated. Fig. 1 shows the users’ mean reputation as a function of error magnitude obtained by the correlation based ranking algorithm. It is clear that the higher the error magnitude of the user, the lower the reputation. The correlation coefficient is thus a good way to quantify a user’s reputation.
After the convergence of , we use a correlation measure called Kendall’s tau [15] to judge the ranking result of the algorithm. It is defined as
| (8) |
with the lower bound -1 ( the two rankings are exactly opposite) and the upper bound 1 ( the two rankings are exactly the same).
Besides, there is another standard measure in information filtering literature named AUC [16]. In most cases, the true ranking of objects is not available, and it is not possible to evaluate the algorithm by . Instead, we can select a group of benchmark objects by some plausible criteria, and then use AUC to evaluate a ranking algorithm. AUC equals one when all benchmark objects are ranked higher than the other objects, while AUC=0.5 corresponds a completely random ranked object list. In the tests using artificial data, 5% of all objects with the highest quality values are selected as benchmark objects.
Using the artificial data, we evaluate the effectiveness of the correlation based ranking algorithm. Comparing with straightforward mean algorithm and IR algorithm, table 1 shows the ranking result obtained from the artificial data. As we can see, in a clean rating system without any spammer, the effectiveness of the three algorithms are all good and do not differ a lot. The IR algorithm relatively has the best effectiveness.
| Algorithm | Mean | IR | Correlation-Based |
|---|---|---|---|
| AUC | 0.9940 | 0.9965 | 0.9952 |
| 0.9216 | 0.9387 | 0.9300 |
4 Spam analysis
In the above simulations, users are honest and give ratings with fixed error magnitudes. While in the real system, not all users are honest. There are many kinds of spammers that may drastically lower the effectiveness of ranking algorithms.
In general, there are two kinds of ratings that a spammer may give: (1) Random rating: random allowable ratings on items. (2) Push rating: maximum or minimum allowable ratings on items.
A random rating spammer may be a naughty user who just plays around with the informations and gives ratings which mean nothing. A push rating spammer always gives maximum/minimum allowable ratings that also mean nothing. These dishonest ratings influence the accuracy of the ranking result. A good ranking algorithm should be robust against any kind of spammers. To evaluate the correlation based ranking algorithm against different types of spammers, some users are randomly selected as spammers in the artificial data. These spammers’ ratings are generated according to their spamming types. In this paper, we consider two types of spamming: (1) Spammers who always give random ratings. (2) Spammers who always give push ratings. For both types of spamming, we study the influence on the effectiveness of the correlation based ranking algorithm as the ratio of spammers increases. For comparison, the effectiveness of mean and IR ranking algorithm are also studied.
4.1 Random rating spamming
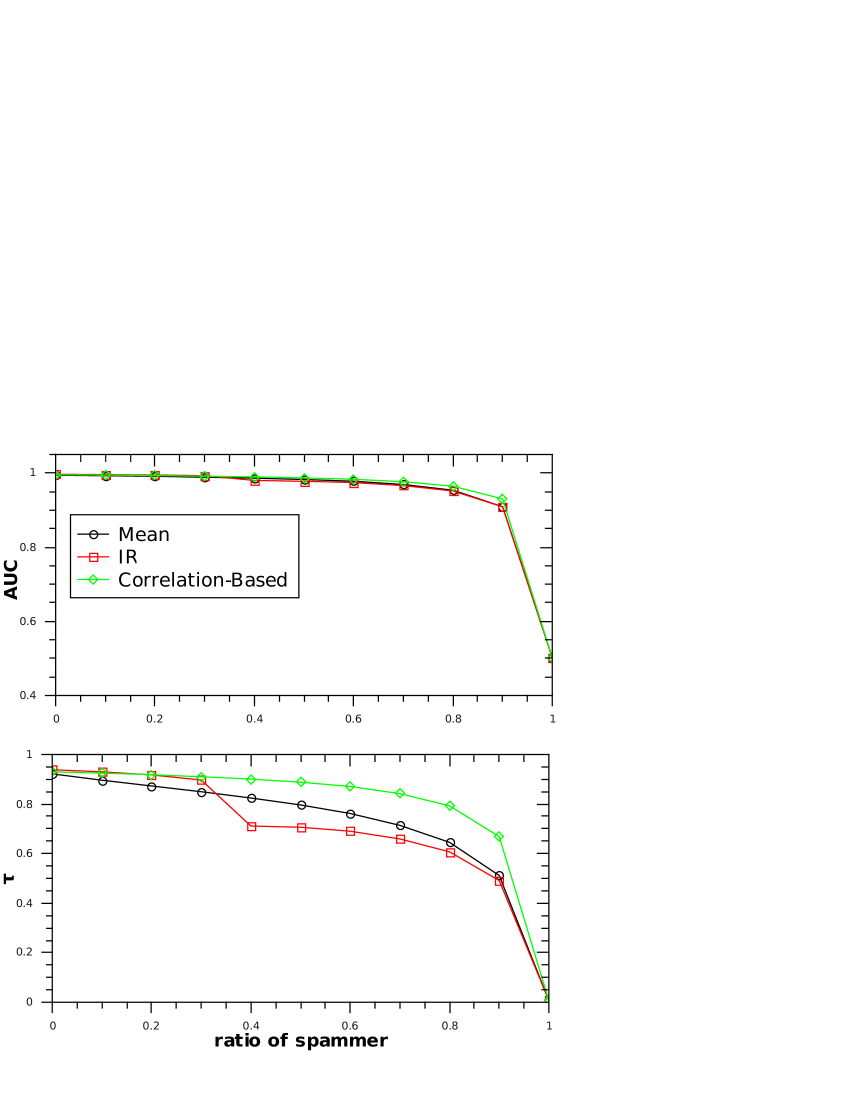
Fig. 2 shows the effectiveness of different algorithms obtained from the artificial data with random rating spamming. When there is no spammer, the effectiveness of all the three algorithms are almost the same. But when the ratio of spammers increases, the correlation based ranking algorithm is significantly better than the others. When all the users are spammers, the rankings are random for all algorithm, and the value of AUC becomes 0.5 and becomes 0.
Correlation coefficient is a measure of the strength of the linear relationship between two vectors. A random value vector normally has little or no correlation with any other vectors. Thus, the reputation of random rating spammers should be very small. As shown in fig. 3(a), the reputations of most random rating spammers are very low. Even when the ratio of spammers is 0.9, there is still more than 70% of spammers with the reputation less than 0.1.


While for the honest users, regardless of spammer size, their reputations are always high (up to 90% larger than 0.4, see fig. 3(b)). The inset in fig. 3(b) shows the relationship of user’s reputation and his error magnitude. The honest user’s reputation is decreasing with his error magnitude. When the ratio of spammers is very large, the decreasing line has larger fluctuation, but the magnitude of fluctuation is very small even when the ratio of spammers is 0.9. This shows that the reputations of honest users is decreasing with their error magnitudes.
As discussed above, the correlation based ranking algorithm always gives lower reputations to the random rating spammers, which decreases the influence of spammers on the the ranking result. At the same time, the reputations of honest users do not decrease significantly with the increase of spammers. It implies that the correlation based ranking algorithm can nearly remove the influence of spammers regardless of the ratio of spammers, and have a high robustness against the attack of random rating spammers.
4.2 Push rating spamming
The effectiveness of different algorithms with spammers who give push ratings is shown in Fig. 4. The AUC value of the correlation based ranking algorithm is only slightly higher than the other two algorithms when the ratio of spammers is high, but the value of for the correlation based ranking algorithm is significantly higher than the other two algorithm.
As push rating spammers are selected randomly, and every object has the same opportunity to get push ratings from the spammers, the result is that all object qualities calculated by IR or mean algorithm are higher than expected. The simulation results imply that, this impact has a great influence on the value of but small influence on the AUC value. A possible reason is that the ranking results of IR and mean algorithm have many local fluctuation comparing with the real ranking, and these local oscillations do not influence the AUC value. As the spammer always gives push ratings, its correlation coefficients with other vectors are always 0. The correlation based ranking algorithm can absolutely remove the influence of this kind of spammers. So the correlation based ranking algorithm has the highest robustness as indicated by either or AUC.
From the result discussed above we can conclude that, although the IR algorithm has the largest effectiveness for a clean system without spammer, it is clear that the correlation based algorithm has a good capability to resist spammer attack.
5 Real data experiment
After analyses with the artificial data, some real systems are studied in this section. We use two distinct real data sets containing movie ratings: Netflix and MovieLens. Movielens is provided by GroupLens project at University of Minnesota (www.grouplens.org). We use their 1 million ratings data set given on the integer rating scale from 1 to 5. Each user in Movielens data set has at least 20 ratings. Netflix is huge data set released by the DVD rental company Netflix for its Netflix Prize (www.netflixprize.com). We extracted a smaller data set by choosing 4968 users who have rated at least 20 movies (just like Movielens) and took all movies they had rated. The Netflix ratings are also given on the integer rating scale from 1 to 5. The characteristics of these data set are summarized in table 2.
| Data set | Sparsity | ||||
|---|---|---|---|---|---|
| Movielens | 6040 | 3883 | 166 | 270 | 0.0426 |
| Netflix | 4968 | 16331 | 242 | 74 | 0.0148 |
As already explained above, one needs an independently selected set of so-called benchmark objects to test a ranking algorithm on real data. In our tests, we use movies nominated for the best picture category at the Annual Academy Awards, popularly known as Oscars (as a source of information we used www.filmsite.org), as benchmark objects. There are 203 benchmark movies in Movelens data set and 299 in Netflix data set.
The AUC values of different algorithm on real data are shown in table 3. For the Movielens data set, IR algorithm has the best effectiveness. While for the Netflix data set, the correlation based algorithm has the best performance. It is obviously that the AUC values for Movielens using all the three algorithms are obviously higher than that of Netflix (range from 0.8723 to 0.8763 for Movielens, 0.7609 to 0.7742 for Netflix), and this may suggest that the Netflix data set includes more spammers than the Movielens data set. Thus based on the results of artificial data, it is suggested that the correlation based ranking algorithm obtain better result for Netflix than IR algorithm just because the correlation based ranking algorithm is more robust against spammer attack than IR algorithm.
| Algorithm | Mean | IR | Correlation-Based |
|---|---|---|---|
| Movielens | 0.8730 | 0.8763 | 0.8723 |
| Netflix | 0.7609 | 0.7650 | 0.7742 |
6 Conclusion and discussion
It is a big challenge to get the right ranking of objects in such rating systems where user vote objects with rating scores, especially when spammers are present in the rating system. When it comes to the user reputation system, how to decide a user’s trust value is a crucial question. As correlation is a good way to describe the similarity between two vectors, we choose correlation coefficient to represent user’s reputation and use iterative method to obtain the result step by step. According to the artificially generated data, the presented correlation based ranking algorithm has a good effectiveness to resist the attack of spammers. In testing with real data, the present algorithm has a higher effectiveness than IR algorithm for Netflix, but lower effectiveness for Movielens. That may suggest that Netflix data set includes more spammers than Movielens, and the present algorithm has higher robustness to spammers’ attack than the other two algorithms.
A good ranking algorithm should be both robust and accurate. The correlation based algorithm presented in this paper can more effectively tackle the problem of robustness than the others. For the accuracy, there is still a large room for improvement. On the other hand, how to judge the ranking result is also a problem. For movies, some of them which have not received any award are also widely loved by people. Only using movies that have been nominated by famous award as benchmark is also not reasonable. The effectiveness of ranking algorithm with artificial data is easy to evaluate. If real data are completely replaced by artificial data, it will be easier to evaluate a given ranking algorithm. Our future work will focus on how to build more reasonable models to generate artificial data and improve the accuracy of ranking algorithm.
Acknowledgements.
We thank Bill Yeung’s help to polish this paper. This work is partially supported by the Swiss National Science Foundation (Project No. 200020-121848).References
- [1] \NameLangville A. N.Meyer C. D. \REVIEWThe Mathematical Intelligencer30200868
- [2] \NameRadicchi F., Fortunato S., Markines B. Vespignani A. \REVIEWPhys. Rev. E802009056103
- [3] \NameShang M.-S., Lu L.-Y., Zhang Y.-C. Zhou T. \REVIEWEurophys. Lett.90201048006
- [4] \NameMasum H. Zhang Y.-C. \REVIEWFirst Monday920047
- [5] \NameHerlocker J. K., Konstan J. A., Terveen L. G. Riedl J. T. \REVIEWACM Trans. inf. Syst.2220045
- [6] \NameZacharia G., Moukas A. Maes P. \REVIEWDecision Support Systems292000371
- [7] \NameResnick P. Zeckhauser R. in \REVIEWAdvances in Applied Microeconomics112002127
- [8] \NameAdler B. T. de Alfaro L. Proceedings of the 16th International World Wide Web Conference (ACM Press) (2007), pp.261-270
- [9] \NameKamvar S. D., Schlosser M. T. Garcia-Molina H. Proceedings of the 12th international conference on World Wide Web (ACM Press) (2003), pp.640-651
- [10] \NameJiang L.-L., Medo M., Wakeling J. R., Zhang Y.-C. Zhou T. arXiv:1001.2186
- [11] \Namede Kerchove C. Van Doorenu P. arXiv:0711.3964
- [12] \NameYu Y. K., Zhang Y.-C., Laureti P. Moret L. \REVIEWPhysica A3712006732
- [13] \NameLaureti P., Moret L., Zhang Y.-C. Yu Y.-K. \REVIEWEurophys. Lett.7520061006
- [14] \NameBarabási A.-L. Albert R. \REVIEWScience2861999509
- [15] \NameKendall M. \REVIEWBiometrika30193881
- [16] \NameHanely J. A. McNeil B. J. \REVIEWRadiology143198229