Luminosity function of galaxies in groups in the SDSS DR7: the dependence on mass, environment and galaxy type
Abstract
We perform an exhaustive analysis of the luminosities of galaxies in groups identified in the Sloan Digital Sky Survey (SDSS) Data Release 7. Our main purpose is to perform a detailed study of the Schechter luminosity function parameters: the characteristic absolute magnitude and the faint end slope, as a function of group virial mass in order to quantify their dependence on environment. We analyse the trends of the Schechter parameters as a function of group mass for different photometric bands, galaxy populations, galaxy positions within the groups, and the group surrounding large scale density. We find that the characteristic magnitude brightens and the faint end slope becomes steeper as a function of mass in all SDSS photometric bands, in agreement with previous results. From the analysis of different galaxy populations, we observe that different methods to split galaxy populations, based on the concentration index or the colour-magnitude diagram, produce quite different behaviours in the luminosity trends, mainly for the faint end slope. These discrepancies and the trends with mass mentioned above are explained when analysing the luminosity function of galaxies classified simultaneously according to their concentrations and colours. We find that only the red spheroids have a luminosity function that strongly depends on group mass. Late type galaxies, whether blue or red, have luminosity functions that do not depend on group mass. The intrinsic change in the luminosity function of spheroids and the varying number contributions of the different types explain the overall trend of the LF with group mass. On the other hand, dividing the galaxy members in the inner and outer regions of the groups do not introduce a significant difference in the Schechter parameter trends, except for the characteristic absolute magnitude in the high group virial mass range () which is an indication of luminosity segregation in massive groups. Finally, we also analyse the possible influence of the large scale surrounding environment on the luminosity function of group galaxies. We find that galaxies inhabiting groups at low density regions experience more pronounced variations on the Schechter parameters as a function of groups mass, while galaxies in groups at high density regions show an almost constant behaviour. We discuss the possible implications of our findings in the galaxy evolution scenario.
keywords:
galaxies: fundamental parameters – galaxies: clusters: general – galaxies: evolution1 Introduction
Since the pioneer works of Einasto et al. (1974), Butcher & Oemler (1978) and Dressler (1980), stating that early-type systems tend to concentrate in high density regions, it has become clear that galaxy properties depend on the local environment. This dependence on environment must hold important information about the history of galaxy formation, so it is important to study the connection between the properties of the galaxies and their location in the Universe. In particular, a galaxy property that has been widely used in the literature is the luminosity, mainly through the analysis of the galaxy luminosity function (LF). This function describes the distribution of luminosities of a given population of galaxies and, in most cases, the shape of that distribution can be fully described by a function with two parameters (Schechter, 1976): the characteristic absolute magnitude and the faint end slope . Although these statistical measurements themselves do not give physical explanations about galaxy formation and evolution, they provide important constraints on various physical processes involved in such galaxy life stages (e.g. Benson et al. 2003).
During the 1990’s a lot of efforts have been made in order to compute the LF for galaxies in different environments such as the field, groups and clusters of galaxies (see for instance Marzke et al. 1994; Lin et al. 1996; Zucca et al. 1997; López-Cruz et al. 1997; Valotto et al. 1997; Ratcliffe et al. 1998; Muriel et al. 1998; Rauzy et al. 1998; Trentham 1998). However, the advent of large surveys of galaxies, such as the Sloan Digital Sky Survey (York et al., 2000) and the Two degree Field Galaxy Redshift Survey (2dFGRS, Colless et al. 2001), allowed for much better determinations of the LF (Blanton et al., 2001, 2003, 2005; Norberg et al., 2002; Madgwick et al., 2002; Trentham & Tully, 2002; Martínez et al., 2002; Christlein & Zabludoff, 2003; Eke et al., 2004). There is a broad consensus that the LF of galaxies in the field is mainly flat (), meanwhile a brighter characteristic magnitude and a steeper faint end slope have been found in galaxy systems for absolute magnitudes in the range . Other authors argue that a very steep faint end slope, at , can be measured in rich clusters and galaxy groups (Popesso et al., 2005; González et al., 2006) when using only photometric information. It should be remarked that the methods that do not use spectroscopic redshifts are sensitive to the background computation, so, they are less reliable.

Many works in the last few years have been concentrated on the effect of the environment on the LF. For instance, Croton et al. (2005); Hoyle et al. (2005); Xia et al. (2006); Park et al. (2007); Phleps et al. (2007) studied the dependence of the LF on the density contrast within spheres of different radii. A brightening of the characteristic magnitude and a steepening of the faint end slope are observed when moving from underdense to overdense regions. Deng et al. (2007) found that the dependence of galaxy luminosity on a dense environment is much weaker than that on an underdense environment. Choi et al. (2007) argued that the LF shows significant fluctuations due to large scale structures, while the morphological fraction as a function of luminosity is relatively less sensitive and thus seems to be more universal. The importance of the large scale environment was also established by Yang et al. (2009) and Tempel et al. (2009) showing strong environmental dependencies.
One of the main benefits of working with large spectroscopic samples of galaxies is that they are very suitable for the construction of large galaxy group catalogues. Zandivarez et al. (2006) used the main galaxy sample of the SDSS DR4 to construct a large galaxy group catalogue, and they have deepen the study of galaxy luminosities as a function of environment. Their analysis comprised the variation of the Schechter function parameters, for different galaxy populations, as a function of the galaxy group virial mass. Their results showed clear variations of and with group virial mass, and proved that these variations are mainly caused by the red population of galaxies in groups. More recently, Robotham et al. (2010) studied the dependence of the LF of galaxies in 2dFGRS groups on the group virial mass and multiplicity. They also found clear trends for decreasing when increasing the masses and/or multiplicity for early type galaxies, while a much suppressed relation was observed for late type population.
At present, the largest galaxy redshift survey is the Seventh Data Release of the Sloan Digital Sky Survey (hereafter DR7; Abazajian et al. 2009). This catalogue covers a very wide area on the sky and has high quality photometric and spectroscopic information. From this galaxy catalogue we can extract one of the largest galaxy group catalogued to date. Therefore, the main aim of this work is two fold: firstly, improving the results obtained for the mass dependence galaxy LFs in the SDSS DR4 (Zandivarez et al., 2006) by using the galaxies in groups in the SDSS DR7 in order to obtain more reliable and detailed results; and secondly, analysing galaxy LFs of different galaxy types using several criteria to classify them as well as study the influence of local and global environment on the LF. All this information is intended to provide a better understanding of galaxies in a wide range of density environments and, consequently, to clarify the scenario of galaxy evolution.
The layout of this paper is as follows. In section 2 we describe the galaxy sample and the group identification process. The detailed analysis of the LFs is in section 3. Finally, in section 4 we discuss possible implications of our results and summarize them in section 5.
2 The sample of galaxies in groups
The Sloan Digital Sky Survey (SDSS) has validated and made publicly available its Seventh Data Release (DR7; Abazajian et al. 2009) which consists of of five-band, , imaging data and 1,374,080 () spectra of galaxies, quasars and stars. The DR7 Main Galaxy Sample (MGS; Strauss et al. 2002) consists of galaxies with band Petrosian magnitudes and band Petrosian half-light surface brightnesses .
Our sample of groups has been identified in the MGS of DR7 following Merchán & Zandivarez (2005). We performed the identification of groups on a subsample of MGS that includes objects up to a redshift of . We used a Friends-of-Friends algorithm that links galaxies () which satisfy and , where is their projected distance and is their line-of-sight velocity difference. The scaling factor is introduced in order to take into account the decrement of the galaxy number density due to the apparent magnitude limit cutoff (e.g. Huchra & Geller 1982; Ramella et al. 1997; Merchán & Zandivarez 2002, 2005). We have adopted a transverse linking length corresponding to a contour over-density of (this value corresponds to an integrated overdensity of in a Cold Dark Matter cosmology), a line-of-sight linking length of and a fiducial redshift of . Since it is well known that the MGS is incomplete for -band apparent magnitudes lower than , we have adopted this magnitude as a lower apparent magnitude limit in our algorithm and excluded galaxies brighter than this from our analyses.

As in Merchán & Zandivarez (2005), we have carried out an improvement of the rich group identification by performing a second identification (double identification, hereafter ) on galaxy groups which have at least ten members. We used a higher density contrast (), in order to split merged systems or to eliminate spurious member detections (see Díaz et al. 2005). The position of the group centres for groups with at least 10 members has been determined by using an iterative procedure developed by Díaz et al. (2005). The procedure defines a new group centre estimation by using the projected local number density (using the 5 closest neighbours) of each galaxy member as a weight for their group centric distances, and then iterates this estimation by removing galaxies beyond a given distance. The iteration process stops when the centre location remains unchanged.
The final group sample comprises 15,961 groups with at least 4 members, adding up to 103,342 galaxies. Following Merchán & Zandivarez (2002), group virial masses were computed as , where is the virial radius of the system, and is the velocity dispersion of member galaxies (Limber & Mathews, 1960). The velocity dispersion is estimated using the line-of-sight velocity dispersion , . To compute we use the methods described by Beers et al. (1990). The group sample has a median redshift, line-of-sight velocity dispersion, virial mass and virial radius of 0.09, , , and , respectively. Figure 1 shows the distributions of these group properties for our whole sample.
Galaxy magnitudes used throughout this work are Petrosian magnitudes (Petrosian, 1976), and have been corrected for Galactic extinction using the maps by Schlegel et al. (1998). Absolute magnitudes have been computed assuming a flat cosmological model with parameters , and and corrected using the method of Blanton & Roweis (2007) (KCORRECT version 4.1). We have adopted a band shift to a redshift , i.e. to approximately the mean redshift of the MGS of SDSS. We have also included evolution corrections to this redshift following Blanton et al. (2003). Throughout this work we will refer to these shifted bands as , and . All magnitudes are in the AB system.
3 The group mass dependence of the luminosity function of galaxies in groups
In this section we study the luminosity function of galaxies in our sample of SDSS DR7 groups as a function of group virial mass and its dependence on: group identification procedure, photometric band, galaxy type, galaxy position within the groups and the large scale environment surrounding the groups.
For computing the LFs we adopt two different methods: to visualise the LF, we use the non parametric method (Lynden-Bell, 1971; Choloniewski, 1987), which is the most robust estimator being less affected by different values of the faint end slope and sample size (Willmer, 1997); and the STY method (Sandage, Tammann & Yahil, 1979) which is reliable for fitting analytic functions without binning the data. In all cases studied in this paper, we find that the Schechter parametrisation of the LF (Schechter, 1976) is appropriate, therefore, most of our findings below are expressed only in terms of the values of the Schechter function shape parameters and .
3.1 The overall group galaxy population LF
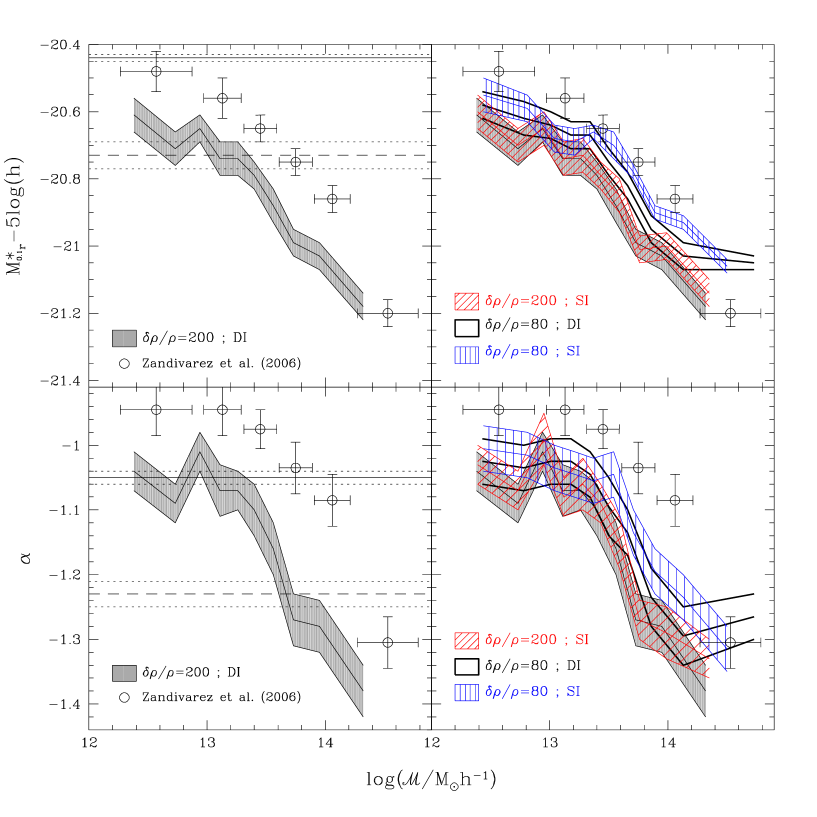
We have computed the band LFs of galaxies in groups for the full sample of groups in the SDSS DR7 as a function of group virial mass. The corresponding LFs are shown in Fig. 2, where each panel corresponds to a different group virial mass bin from lower (left bottom panel) to higher (right top panel) mass values. The solid lines show the STY best fit Schechter LFs, and the corresponding STY and values are quoted therein. A clearer way to analyse the variation of the LF with mass is to represent the best fitting parameters ( and ) as a function of virial mass. In the left panels of Fig. 3 we show the band LF’s parameters of galaxies in groups. Our results show a clear brightening in the characteristic magnitude and a decreasing faint end slope with mass. The amplitude variations ( and ) are fully consistent with the results obtained by Zandivarez et al. (2006), although the and parameters are slightly shifted () to brighter and steeper values, respectively. These differences are examined in detail in the following section. Even when these trends are in agreement with the results obtained by Yang et al. (2005), Zandivarez et al. (2006) and Robotham et al. (2010), the large number of groups used in our analysis allow us to obtain quite more clear and detailed determinations than those obtained in previous works.
3.1.1 The dependence of the LF on the group identification procedure
As described in Sect. 2, we have chosen to identify galaxy groups with a contour density contrast . This particular value differs from the one adopted in our previous work (Zandivarez et al., 2006) where groups with were used. The choice adopted in the current work relies on the idea of considering an even more reliable sample of galaxy groups to perform the luminosity statistics. Since the development of the Friends-of-Friends algorithm to identify groups in redshift space, the main reason to choose a value of was to include as many loose systems as possible in order to obtain larger samples, and without changing the main physical properties of galaxy groups (see for instance Ramella et al. 1997). In a previous work, Merchán & Zandivarez (2002) have shown that the larger the used in the identification process, the higher the reliability of identifying real systems. In that work they have chosen a just to include as many systems as possible at the expense of some reliability in the groups identified. Using basically selects galaxies within a radius that corresponds to the geometric mean between the virial and the turnaround radii, therefore, galaxy groups include infalling galaxies that can bias the group definition, mass estimate and properties (Mamon, 2007). Our purpose in this work is to avoid the loosest systems which are the least reliable in both, their probability of being real systems and the stability of their physical properties, and also exclude infalling galaxies, thus reducing biases in the luminosity statistics.
It is interesting to investigate whether the choice of or the refinement procedure in the identification could introduce observable effects on the LFs. Hence, we have performed different group identifications varying , and applying or not the refinement identification process (DI) described in Sect. 2. The contour overdensities adopted are 80 and 200 while performing or not the refinement is named as double identification (DI) or single identification (SI) respectively. The results obtained with these new group samples are shown in the right panels of Fig. 3. Analysing the trends observed for the characteristic magnitude (upper panel), it can be seen that the group identification with produces groups with typically fainter than those observed for , and such difference is more pronounced when just a single identification is performed. For the faint end slope trends (lower panel), the behaviour is similar but less notorious than the described above. The observed differences in both Schechter parameters, arise primarily from using a lower density contrast, which has two main effects: the presence of not virialised systems whose existence and physical properties are less reliable, and the inclusion of galaxies in the outer parts of groups. The presence of loose systems can affect the LF over the whole range of masses, while the extended outer parts of groups should have a stronger effect in for high mass groups. Evidence of the latter is provided in our analysis of the variation of the LF as a function of group centric distance in Sect. 3.3 below. The low density contrast results are in a better agreement with the previous results obtained by Zandivarez et al. (2006). The remaining differences, mainly observed in , could be attributed to an increment of in the number of galaxies between DR4 and DR7. For the purposes of this work we prefer to use in our analyses in order to minimise possible biases.
3.1.2 The LF in all SDSS photometric bands
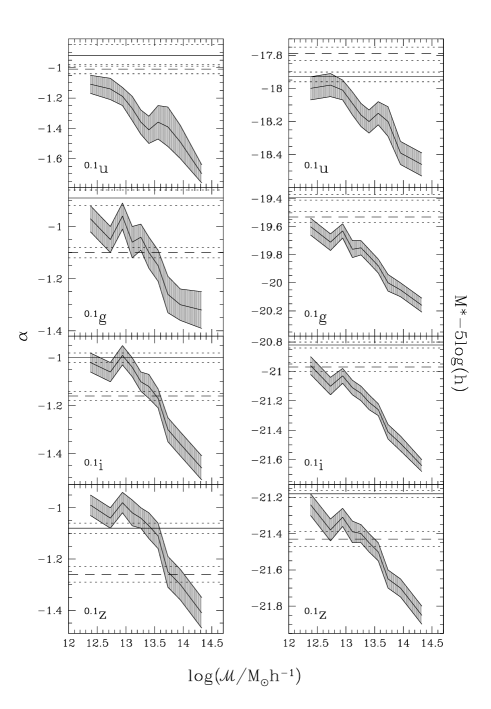
A full photometrical description of galaxies in groups is achieved by studying the LFs for different photometric bands as a function of group mass. Being the SDSS galaxy sample a band magnitude limited one, it does not mean that such sample is magnitude limited in the other SDSS bands. Therefore, we have introduced apparent magnitude cuts-offs in each SDSS photometric band in order to build complete magnitude limited samples of galaxies. The corresponding cut-offs in each band (see table in Appendix A) are obtained from the analysis of the galaxy number counts in each SDSS DR7 band. The adopted limits are more conservative than those adopted by Montero-Dorta & Prada (2009) for the SDSS DR6 (see their Table 2). Since corrections for each band are only reliable within certain redshift ranges, we have also adopted the redshift cut-offs for each band introduced by Blanton et al. (2003), which are consistent with those used by Montero-Dorta & Prada (2009).
The resulting Schechter parameters as a function of groups masses for each photometric SDSS band are shown in Fig. 4. We observe a similar behaviour as the obtained in the band for both Schechter parameters as a function of the group masses. The characteristic magnitude shows (left panels) approximately the same increment from low to high group masses in the , and bands ( mag), similar to the results. This brightening is smaller () in the band. The largest variation of the faint end slope as a function of mass is observed in the band () while the other bands show roughly the same increment () and also similar to the band.
As a comparison with field LF, we show in Figs. 3 and 4 the results by Blanton et al. (2003) and Montero-Dorta & Prada (2009) for galaxies in the SDSS DR1 and DR6, respectively. Since those galaxy samples comprise all MGS galaxies in each data release, the results obtained for the Schechter parameters are expected to be representative of the low mass groups tail of our analyses. This is clearly observed for both Schechter parameters when analysing the Blanton et al. (2003) results, while this is true only for the characteristic magnitudes obtained by Montero-Dorta & Prada (2009). The faint end slopes obtained by Montero-Dorta & Prada (2009) are typically steeper than ours. However, analysing their LFs and comparing them with those obtained by Blanton et al. (2003), we observe that the behaviours of both determinations, at the faint end slope, are quite similar (see Figs. 7 and 8 of Montero-Dorta & Prada 2009). The differences obtained in the fitted faint end slope are the result of a small brightening in the characteristic magnitude in the Montero-Dorta & Prada (2009) compared to Blanton et al. (2003).
3.2 The luminosity function of different galaxy types
The galaxy population in the local Universe can be broadly described in terms of two different classes of objects, early and late types, which can be distinguished by their morphology, star formation rate and colour (e.g. Strateva et al. 2001; Balogh et al. 2004; Baldry et al. 2004). Evidence has been found that the properties of early-type galaxies are almost independent of the environment (e.g. Dressler et al. 1997; Bernardi et al. 2003; Martínez et al. 2010). This has also been reported for late types (e.g. Biviano et al. 1990; Zandivarez et al. 2006). There is conclusive evidence that the bi-modality in galaxy colours is already in place at , and that the fractions of early and late types are different compared to the local universe. (Bell et al., 2004; Tanaka et al., 2005). A number of physical mechanisms related to environment can be responsible for this bimodality by transforming galaxies from late to early types (e.g., ram pressure, galaxy harassment, interactions with potential wells) or by truncating their star formation (e.g. strangulation).
In this section, we explore the mass dependence of the LF of different galaxy types. Galaxies are classified into different types according to their concentration index and colour, with the aim of shedding light on the effect of group environment in the transformation of galaxies and the build up of the bimodality observed in the galaxy population.
3.2.1 Early and Late galaxies according to the concentration index
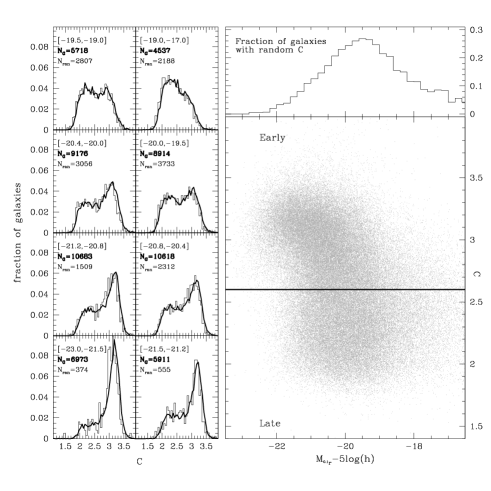
The concentration index is defined as the ratio of the radii enclosing 90 and 50 percent of the Petrosian flux, . This parameter is related to the light distribution within a galaxy. Typically, early-type galaxies have , while for late-types (Strateva et al., 2001), thus, is an indicator of morphology. We split group galaxies into early and late types according to their parameter, and compute the group mass dependence of the LF of galaxies of each type.
Special care must be taken when using to classify galaxies. The effects of seeing in the measurement of and , and thus in , have to be considered for galaxies with relatively small angular sizes. The average seeing in the SDSS is below a conservative value of , thus for galaxies that have , can be unreliable. We have found that of all MGS galaxies with redshifts (our redshift upper limit) have values below . This number drops to less than if we impose a further apparent magnitude cut-off of . We have used volume limited subsamples of these brighter MGS galaxies to compute the distribution of for different luminosity bins (see left panels of Fig. 5). These distributions are the used to randomly assign values to those galaxies that had unreliable values of (). Right upper panel of Fig. 5 shows the fraction of galaxies in group with randomly assigned values as a function of absolute magnitude. We used Kolmogorov-Smirnov test to choose the random assignations that reproduce the best the observed distributions per bin of absolute magnitude. These distributions are shown by histograms in the left panels of Fig. 5. Finally, right lower panel shows the scatter plot of vs. absolute magnitude for all the galaxies in groups in SDSS DR7, i.e., those whose was assigned randomly and those whose was reliable from the very beginning.
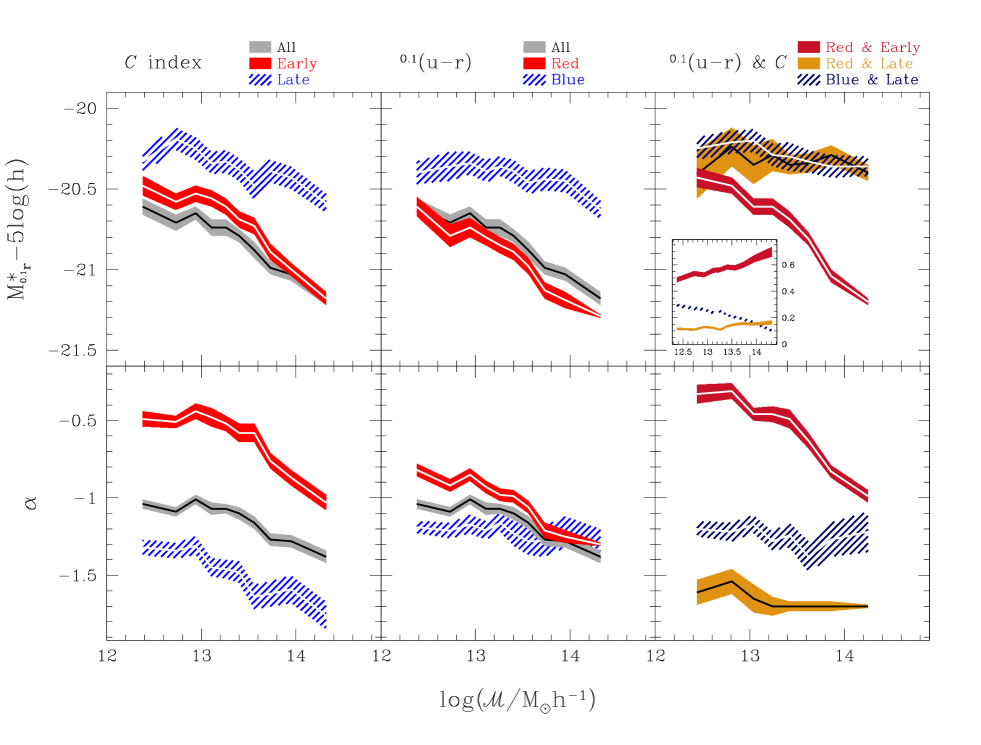
Once all the galaxies in groups have values assigned, we classify them into early or late types (see right panel of Fig. 5) and compute the mass dependence of the band LF of each galaxy type. We show in the left panels of Fig. 7 the group mass dependence of the parameters and . We also show, for comparison, the results from the overall population of galaxies in groups determined in the previous section. Clearly, early and late type galaxies have different LFs over the whole group mass range. Regarding the characteristic magnitude, , it is systematically brighter for early types, the difference ranging from to mag. Also, the dependence of on mass is stronger for early types. This behaviour closely follows the trend of the overall galaxy population, despite being fainter over most of the mass range. The faint end slope, , of early and late types differ in over the whole mass range, being, as expected, larger in absolute value for late types. Their trends as a function of group mass are roughly parallel to each other.
3.2.2 Red and Blue galaxies according to the colour
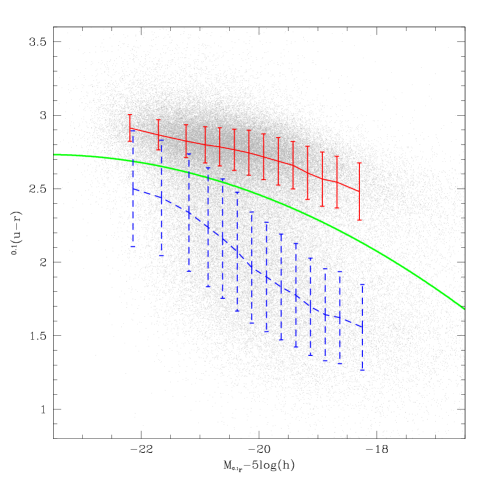
At a fixed luminosity, the colour distribution of galaxies can be remarkably well described as the combination of two Gaussian functions that represent the contributions from galaxies in the blue and the red sequence (e.g. Baldry et al. 2004; Balogh et al. 2004). We use this bi-modality of galaxy colours to split galaxies into red and blue populations.
We proceed as follows: firstly, we fit the two-Gaussian model to the colour distribution of the MGS galaxies in different absolute magnitude bins. For this purpose, we include in each absolute magnitude bin the largest volume limited subsample of MGS galaxies. The fitting procedure gives, for a given luminosity bin, 6 parameters that measure the amplitude, mean value and width of the two Gaussian functions. In Fig. 6 we show the mean colour of the blue and red populations as a function of absolute magnitude and the corresponding half-maximum widths as error-bars, superimposed over the colour-magnitude diagram of MGS galaxies. Secondly, we looked for the colour that separates between blue and red populations as a function of absolute magnitude: for each luminosity bin, we compute the colour value at which the two Gaussian functions intersect, i.e., the colour value that gives a galaxy the same probability of belonging to the red or to the blue population. We have found that these ’equal-probability’ points can be very well fitted by a second degree polynomial: , where , shown as a thick green line in Fig. 6. Finally, we use this polynomial to classify galaxies as red or blue for the computation of the band LF.
In the middle panels of Fig. 7 we show the resulting parameters and as a function of group mass for galaxies classified as blue and red and the comparison with the results for the overall galaxy population of groups (Sect. 3.1). The first conclusion that can be extracted from the comparison of these panels with the left panels is that, classifying galaxies according to colour is not as closely related to classifying galaxies according to concentration index as one may, a priori, think, since the results for blue/red differ from those of early/late types discussed above. The mass dependence of and for the red and blue sequences qualitatively agree with our previous findings using DR4 groups (Zandivarez et al., 2006). The red sequence is brighter than its blue counterpart over the whole mass range in mag, and has a stronger dependence on mass. It is also brighter than that of the whole sample, at least for masses . The blue sequence shows a weak dependence on mass. Regarding , the results for the blue sequence are independent of group mass, showing a constant value of , whereas the red sequence shows a variation of over the whole mass range.
The fact that the blue sequence LF shows such a weak dependence on the mass of the systems supports the existing idea of a blue population whose properties are basically independent of the environment.
3.2.3 The role of red spheroids
Splitting galaxies into two populations according to a morphological or a colour criterion has led to remarkably different faint end slopes (Fig. 7). This result indicates that the correspondence between galaxy colour and morphology is not perfect, as was also pointed out by Bundy et al. (2010). In that work, the authors studied a population of red sequence galaxies with disk-like morphologies taken from the COSMOS survey. They found that up to half of the red sequence galaxies harbour disks in the redshift range , and that their contribution to the red sequence declines with time.
In the right panels of Fig. 7, we show the group mass dependence of the LF for galaxies classified according to both: and colour, simultaneously. We show and as a function of group mass for red-early galaxies, red-late galaxies (i.e. passive disks) and blue-late galaxies. We did not introduce in this figure the results for galaxies classified as blue-early because there are only few of them which turns LF computation very noisy. It is clear from these panels that for both late types, blue-late and red-late, the LF parameters show no clear group mass dependence. Both types have similar , and passive disks have an LF steeper () than that of star forming disks (). The only type that displays strong mass dependence of its LF is the red-early type, dominated by red spheroids.
The general trend of the LF as a function of mass and the uneven behaviours of the LFs of galaxies classified according to morphology or colour can be understood in light of these results and the inset panel in Fig. 7, in which we show the fraction of the 3 colour-morphology types as a function of group mass. Red-early galaxies have a LF that strongly depends on mass, its brightens in mag and its steepens in over the mass range we probe, and also, the fraction of these galaxies increases with mass. This galaxies only can account for the trends observed in the overall group LF. When classifying galaxies according to , early type galaxies are dominated in number by the red-early type, therefore it explains the similarity between the trends seen in red in the left panels and in dark red in right panels of Fig. 7. On the other hand, late type galaxies are a mix of blue-late and red-late types, the former dominating at low mass and the latter increasing their contribution with mass. The steepening of the LF of late type galaxies with mass is due to both: the decreasing fraction of blue-late galaxies and the increasing fraction of passive disks with mass. As regard to the colour classification, the lack of mass dependence of of blue galaxies is mirroring the fact that they are mostly blue-late types. On the other hand, since the red sequence includes passive disks, its is systematically larger in absolute value than that of late galaxies.
3.3 The luminosity function dependence on group centric distance
Galaxies in the inner parts of clusters of galaxies are known to be statistically different in their physical properties from those in the outer parts (e.g. Withmore & Gilmore 1991; Withmore et al. 1993; Domínguez et al. 2001). This has also been found in less massive groups of galaxies (e.g. Domínguez et al. 2002). In order to deepen our understanding on the galaxy segregation within groups, in this part of the paper we explore the dependence of the LF on the position of galaxies inside the groups.
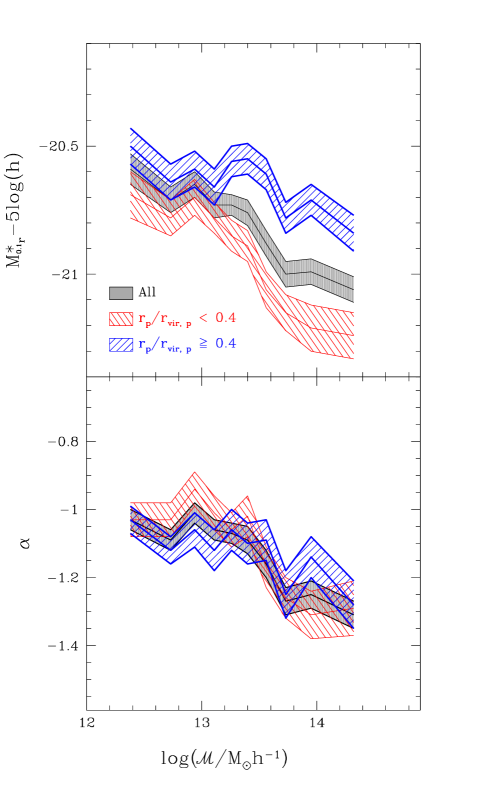
For each galaxy in our group sample we compute its projected distance to the group centre in units of the group virial radius. We find that the median of the distribution of these normalised projected distances is 0.4. We use this value to split galaxies in groups into two classes: galaxies in the inner and outer parts of groups, and compute the group mass dependence of the band LF for each class. The resulting STY best fit and parameters as a function of mass are shown in Fig. 8. Given the estimated error-bars, the only significant difference in the LF of galaxies in the inner and outer parts of groups is seen in for groups more massive than . Galaxies in the inner parts of groups have a brighter , as expected. This difference tends to increase with mass since galaxies in the inner parts show a strong dependence on mass while the outers do not. On the other hand, there is no significant differences in the behaviour of the faint end slope for inner and outer group galaxy members.
3.4 The luminosity function dependence on large scale environment
So far, all our analyses were carried out focusing on the influence of the intra-group medium in the Schechter parameters and their variation as a function of the group mass. The final issue that arises is whether the influence of the large scale environment could play a role in the Schechter parameters for different groups.
In order to quantify this effect, we split the sample of groups into two: groups with high and low dense large scale environment, where the density of the environment is characterised by a number density defined as follows. We compute the number density of galaxies in a cylindrical volume around groups, , where is a multiplicative factor used to compute the volume. On the sky plane, the cylinder is defined by the circle with a radius times the virial radius of the group measured from its centre (), while on the line-of-sight, the cylinder has length defined by times the velocity dispersion, above and below the mean redshift of the group (). Due to the irregular shape of the galaxy catalogue, the solid angle of this cylinder is estimated by taking into account the angular mask of the SDSS DR7. It should be noted that is computed subtracting the number density volume of the group, computed by using . Since the sample of galaxies in the catalogue is magnitude limited, in order to obtain proper estimations of the number densities we have defined a volume limited sample of galaxies to compute densities, using only those with and . We have also introduced a lower redshift cutoff () since the lower magnitude cut-off of 14.5 eliminates almost all galaxies in that region. Finally, the sample of groups is also restricted in the redshift range in order to have properly defined cylindrical volumes, i.e., we have used only those groups with mean redshift in the interval , where is the speed of light.
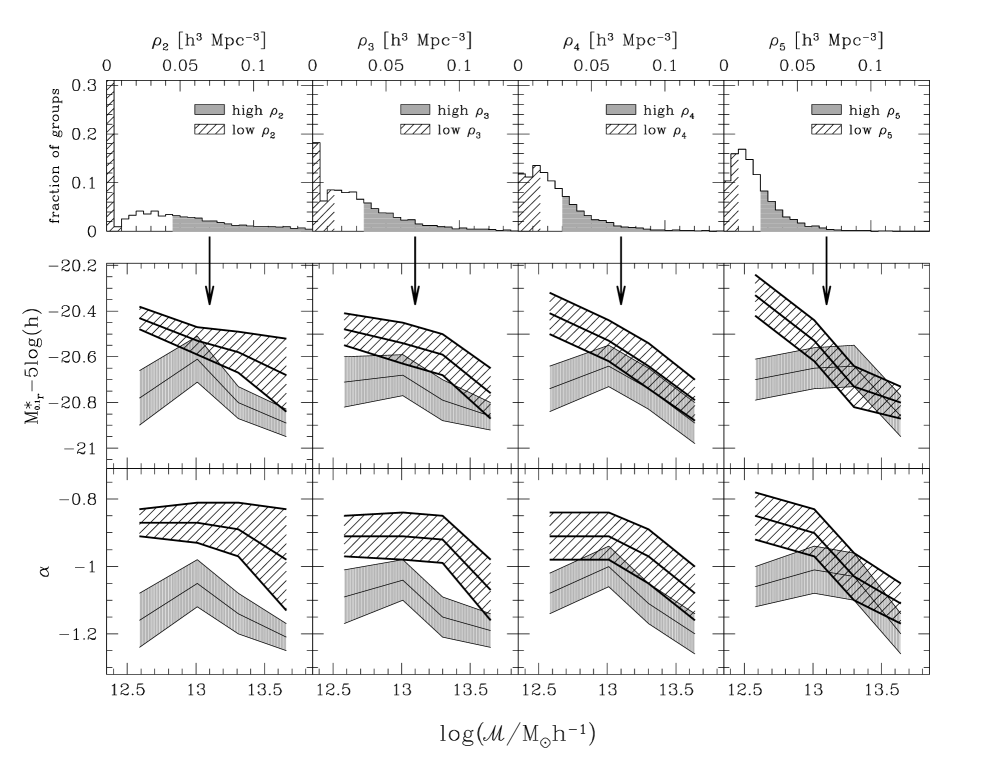
We have used four different values and . After applying the corresponding restrictions, each sample comprises groups which have been split in low ( below the percentile) and high ( above the percentile) large scale density subsamples of groups. The distribution of each type of density and their corresponding subsamples are shown in the upper panels of Fig. 9. The middle and lower panels show the variation of the Schechter parameters for each subsample as a function of group mass. From these panels, it can be seen that there is clear influence of the large scale environment on the resulting LF parameters, and on their variation with group mass. When analysing groups at the densest large scale environments, we do not observe a significant variation as a function of group mass, showing almost a constant behaviour for both, the characteristic absolute magnitude () and the faint end slope (), and these behaviours remains roughly unchanged moving from a small () to a large () surrounding volume. On the other hand, a different behaviour is observed for the subsamples at the lowest density surrounding environments. Regarding the characteristic absolute magnitude at the smallest surrounding volumes (), it can be seen that it is a decreasing function of mass, varying from to ( mag) over 1 order of group mass. This particular trend becomes more and more pronounced when the surrounding volume is increased, finding the largest variation at the largest volume (), from to ( mag) over 1 order of group mass. A similar behaviour is observed for the faint end slope. At the smallest surrounding volume, we observe almost a constant value of as a function of group mass, which is a significantly shallower slope than that obtained in the densest subsample. When the surrounding volume is increased, the - relation, for the lowest density subsamples, becomes a decreasing function of mass, varying from to () over 1 order in group mass, for the largest volume analysis.
4 Discussion
In the last few years, the mass dependence of the LF of galaxies in groups has been analysed by several authors (e.g Zandivarez et al. 2006; Robotham et al. 2010). Our findings for the overall LF are in agreement with the trends found in those previous works, but the use of a larger sample of groups allowed us an important statistical improvement. We have been able to disentangle the dependence of the LF on galaxy types, the location of galaxies within groups and the large scale environments of groups.
Our results strongly suggest that the population of red spheroids is the most related to the group environment. Among the different galaxy types, only red spheroids have LF that strongly correlates with group mass. On the other hand, the late types (blue and red), have LFs that are independent of mass. The mass dependence of the LF of red spheroids and their increasing fraction with mass are the responsible for the mass dependence of the overall LF of galaxies in groups. There are several physical mechanisms proposed in the literature to explain the presence of red spheroids in groups, some of them are more effective in higher mass systems, which may explain the increasing fraction of red spheroids with group mass. For instance, in high mass groups, strangulation (e.g Larson et al. 1980; Balogh & Morris 2000) and ram pressure (e.g. Gunn & Gott 1972; Abadi et al. 1999) can transform and quench star formation, which, in turn, affect primarily galaxy colour, while galaxy harassment transforms disks into spheroids (e.g. Farouki & Shapiro 1981; Moore et al. 1996). Regardless the masses of the systems, galaxy major mergers (e.g. Toomre & Toomre 1972; Hopkins et al. 2008) combined with a mechanism to prevent subsequent star formation (such as AGN feedback, Bower et al. 2006; Croton et al. 2006) can be responsible for the formation of red spheroids in groups of any masses.
Our work raises another interesting point. We find a clear indication of luminosity segregation, since galaxies in the inner parts have brighter characteristic magnitudes than their counterparts in the outer regions. This agrees with the well-known fact that the most luminous galaxies exist preferentially in the densest regions of the Universe (e.g Davis et al. 1988; Hamilton 1988; Loveday et al. 1995; Benoist et al. 1999; Zehavi et al. 2005; Deng et al. 2007). Moreover, the luminosity segregation becomes more pronounced for massive systems as a consequence of a strong brightening of with the group mass for galaxies in the inner parts. These facts resemble the results of Skibba et al. (2007) in which, by testing the halo model predictions in groups of galaxies, they found that the luminosity of the central objects increases with halo mass, while non central galaxies show almost no mass dependence.
Regarding the connection between the large scale group surrounding environment and the LF, high density regions show brighter and steeper values than the observed at low density regions, for both, and respectively. A similar result was observed by Tempel et al. (2010) when analysing galaxy luminosities in the SDSS DR7 at different global density environments. They found that clearly becomes brighter from voids to superclusters, however, they do not observe any variation in . Furthermore, an interesting result arises in our work when analysing the variation of the LF parameters with group mass, since two distinct behaviours are observed: meanwhile galaxies in groups within high density regions have LF parameters that exhibit almost no changes with group mass, LF of galaxies in groups inhabiting low density regions experience a significant variation with mass. Our results suggest a plausible scenario for galaxy evolution in which both, large scale and local environments play important roles. There is evidence in the literature stating that groups in high density regions formed earlier (Harker et al., 2006). This gives the galaxy members a longer time to evolve, producing brighter bright galaxies (), mostly through mergers, and also a larger number of faint galaxies (), affected by dynamical friction and with depleted gas reservoirs. For these groups, the effect of large scale environment could be the main responsible for galaxy evolution, with the group mass (local environment) playing a secondary role in the final result. On the other hand, for groups inhabiting low density regions, the group mass plays a more important role in the observed galaxy luminosities. For a fixed mass, it might be inferred that the difference in the formation time between groups in high and low density regions, is the key point to understand the differences in the LF, i.e., we are observing different stages of the same galaxy evolution. However, the formation time can not be entirely blamed for all differences, since groups in high density regions may have accreted a larger amount of material from their surroundings during their evolution, while groups in low density regions have had more limited access to fresh material. Thus, galaxy evolution in groups may follow different paths depending on where the groups inhabit.
5 Summary
We have carried out an exhaustive analysis of the luminosity function of galaxies in groups. This work was aimed to achieve a more complete and detailed analysis than previously done by Zandivarez et al. (2006). For this new study, we have identified groups of galaxies in the MGS of the SDSS DR7, obtaining one of the largest group samples at present ( groups with more than 4 members) that allowed us to obtain more refined and reliable statistics than in our previous work.
We have studied the group mass dependence of the galaxy LF under a number of different conditions: group identification algorithms, photometric bands, galaxy types, galaxy locations within groups, and the large scale environment in which the groups are positioned. We have found that the Schechter function is an appropriate description of the LF of galaxies in groups in all cases studied, thus our work relies on the analysis of the parameters describing the characteristic absolute magnitude, , and the faint end slope, , and their dependence with group mass. In the Appendix table we quote the LF parameters from all our analyses. The main results of our work can be summarised as follows:
-
•
The LF is sensitive to the identification technique (single or double identification) and to the value of the contour density contrast adopted. Our preferred choice, double identification plus high contour density contrast (), gives LFs that have systematically brighter and steeper compared to single identifications and/or lower density contrast values. It should be emphasised that the latter options are prone to include a larger number of loose systems, whose existence and physical parameters are less reliable, thus biasing the LF results (Merchán & Zandivarez, 2002; Mamon, 2007).
-
•
The trends of the Schechter parameters as a function of group mass show very similar results regardless of the photometric band considered. Over the probed group mass range (), brightens in mag and decreases in for the , , and bands. For the band we find a brightening of mag in and a decrease of in . This different behaviour for the band is likely to be explained in terms of the spectral coverage of the band, that is closely related to the current star formation, and the well known suppressed star formation rate experienced by galaxies in systems (Zandivarez et al., 2006).
-
•
When splitting galaxies into early and late types according to their concentration parameter, or into blue and red according to their position in the colour-magnitude diagram, we obtain quite different results in the mass dependence of the LF, mainly for the faint end slope of the different populations. The parameters of early and late types are decreasing functions of group mass, parallel one to another and shifted in . On the other hand, when classifying galaxies according to colour, the of the red population decreases with mass, but the of the blue population remains constant over the whole mass range. These differences reinforce the idea that there is no univocal relation between galaxy colour and morphology (e.g. Bundy et al. 2010). Classifying galaxies using concentration index and colour, simultaneously, allows us to understand the nature of the observed trends. We find that the blue-late and the red-late (passive disks) types, have LF parameters that do not correlate with group mass, it is their relative fraction what changes with mass and determines the trend of late types with mass. On the other hand, red-early type galaxies (red spheroids) do have LF parameters that are strongly correlated with group mass. All mass dependencies of the LF parameters observed in this work can be understood by the contribution of this single galaxy population.
-
•
Analysing galaxies in the inner and outer regions of groups, we find an indication of luminosity segregation in systems more massive than . For these groups, galaxies in the inner parts have systematically brighter ( mag) characteristic magnitude.
-
•
Finally, we analysed the possible influence of the large scale group surrounding environment on the luminosities of group members. It can be seen that, on average, the high density regions show brighter and steeper values than the observed at low density regions, for both, and respectively. Galaxies in groups within high density regions have LF parameters that have almost no changes with group mass in contrast with galaxies in groups inhabiting low density regions.
The implications of our results should be addressed by theoretical and semianalytic models in order to fully understand the physics behind the role played by the environment on galaxy evolution.
Acknowledgements
We thank the anonymous referee for helpful suggestions. We also thank Eugenia Díaz for useful comments. This work has been partially supported with grants from Consejo Nacional de Investigaciones Científicas y Técnicas de la República Argentina (CONICET) and Secretaría de Ciencia y Tecnología de la Universidad de Córdoba.
Funding for the SDSS and SDSS-II has been provided by the Alfred P. Sloan Foundation, the Participating Institutions, the National Science Foundation, the U.S. Department of Energy, the National Aeronautics and Space Administration, the Japanese Monbukagakusho, the Max Planck Society, and the Higher Education Funding Council for England. The SDSS Web Site is http://www.sdss.org/. The SDSS is managed by the Astrophysical Research Consortium for the Participating Institutions. The Participating Institutions are the American Museum of Natural History, Astrophysical Institute Potsdam, University of Basel, University of Cambridge, Case Western Reserve University, University of Chicago, Drexel University, Fermilab, the Institute for Advanced Study, the Japan Participation Group, Johns Hopkins University, the Joint Institute for Nuclear Astrophysics, the Kavli Institute for Particle Astrophysics and Cosmology, the Korean Scientist Group, the Chinese Academy of Sciences (LAMOST), Los Alamos National Laboratory, the Max-Planck-Institute for Astronomy (MPIA), the Max-Planck-Institute for Astrophysics (MPA), New Mexico State University, Ohio State University, University of Pittsburgh, University of Portsmouth, Princeton University, the United States Naval Observatory, and the University of Washington.
References
- Abadi et al. (1999) Abadi, M. G., Moore, B., & Bower, R. G. 1999, MNRAS, 308, 947
- Abazajian et al. (2009) Abazajian, K. N., et al. 2009, ApJS, 182, 543
- Baldry et al. (2004) Baldry, I. K., Glazebrook, K., Brinkmann, J., Ivezić, Ž., Lupton, R. H., Nichol, R. C., & Szalay, A. S. 2004, ApJ, 600, 681
- Balogh & Morris (2000) Balogh, M. L., & Morris, S. L. 2000, MNRAS, 318, 703
- Balogh et al. (2004) Balogh, M. L., Baldry, I. K., Nichol, R., Miller, C., Bower, R., & Glazebrook, K. 2004, ApJL, 615, L101
- Beers et al. (1990) Beers, T. C., Flynn, K., & Gebhardt, K. 1990, AJ, 100, 32
- Bell et al. (2004) Bell, E. F., et al. 2004, ApJ, 608, 752
- Benoist et al. (1999) Benoist, C., Cappi, A., da Costa, L. N., Maurogordato, S., Bouchet, F. R., & Schaeffer, R. 1999, ApJ, 514, 563
- Benson et al. (2003) Benson, A. J., Bower, R. G., Frenk, C. S., Lacey, C. G., Baugh, C. M., & Cole, S. 2003, ApJ, 599, 38
- Bernardi et al. (2003) Bernardi, M., et al. 2003, AJ, 125, 1882
- Biviano et al. (1990) Biviano, A., Giuricin, G., Mardirossian, F., & Mezzetti, M. 1990, ApJS, 74, 325
- Blanton et al. (2001) Blanton, M. R., et al. 2001, AJ, 121, 2358
- Blanton et al. (2003) Blanton, M. R., et al. 2003, ApJ, 592, 819
- Blanton et al. (2005) Blanton, M. R., Lupton, R. H., Schlegel, D. J., Strauss, M. A., Brinkmann, J., Fukugita, M., & Loveday, J. 2005, ApJ, 631, 208
- Blanton & Roweis (2007) Blanton, M. R., & Roweis, S. 2007, AJ, 133, 734
- Bower et al. (2006) Bower, R. G., Benson, A. J., Malbon, R., Helly, J. C., Frenk, C. S., Baugh, C. M., Cole, S., & Lacey, C. G. 2006, MNRAS, 370, 645
- Bundy et al. (2010) Bundy, K., et al. 2010, ApJ, 719, 1969
- Butcher & Oemler (1978) Butcher, H., & Oemler, A., Jr. 1978, ApJ, 219, 18
- Choi et al. (2007) Choi, Y.-Y., Park, C., & Vogeley, M. S. 2007, ApJ, 658, 884
- Choloniewski (1987) Choloniewski J., 1987, MNRAS, 226, 273
- Christlein & Zabludoff (2003) Christlein D., Zabludoff A.I., 2003, ApJ, 591, 764
- Colless et al. (2001) Colless, M., et al. 2001, MNRAS, 328, 1039
- Croton et al. (2005) Croton, D. J., et al. 2005, MNRAS, 356, 1155
- Croton et al. (2006) Croton, D. J., et al. 2006, MNRAS, 365, 1
- Davis et al. (1988) Davis, M., Meiksin, A., Strauss, M. A., da Costa, L. N., & Yahil, A. 1988, ApJL, 333, L9
- Deng et al. (2007) Deng, X.-F., He, J.-Z., & Jiang, P. 2007, ApJL, 671, L101
- Devereux et al. (2009) Devereux, N., Willner, S. P., Ashby, M. L. N., Willmer, C. N. A., & Hriljac, P. 2009, ApJ, 702, 955
- Díaz et al. (2005) Díaz E., Zandivarez A., Merchán M.E., Muriel H. 2005, ApJ, 629, 158
- Domínguez et al. (2001) Domínguez, M. J., Muriel, H., & Lambas, D. G. 2001, AJ, 121, 1266
- Domínguez et al. (2002) Domínguez, M. J., Zandivarez, A. A., Martínez, H. J., Merchán, M. E., Muriel, H., & Lambas, D. G. 2002, MNRAS, 335, 825
- Dressler (1980) Dressler, A. 1980, ApJ, 236, 351
- Dressler et al. (1997) Dressler, A., et al. 1997, ApJ, 490, 577
- Einasto et al. (1974) Einasto, J., Saar, E., Kaasik, A., & Chernin, A. D. 1974, Nature, 252, 111
- Eke et al. (2004) Eke, V. R., et al. 2004, MNRAS, 355, 769
- Farouki & Shapiro (1981) Farouki, R., & Shapiro, S. L. 1981, ApJ, 243, 32
- González et al. (2006) González, R. E., Lares, M., Lambas, D. G., & Valotto, C. 2006, A&A, 445, 51
- Gunn & Gott (1972) Gunn, J. E., & Gott, J. R., III 1972, ApJ, 176, 1
- Hamilton (1988) Hamilton, A. J. S. 1988, ApJL, 331, L59
- Hansen et al. (2009) Hansen, S. M., Sheldon, E. S., Wechsler, R. H., & Koester, B. P. 2009, ApJ, 699, 1333
- Harker et al. (2006) Harker, G., Cole, S., Helly, J., Frenk, C., & Jenkins, A. 2006, MNRAS, 367, 1039
- Hopkins et al. (2008) Hopkins, P. F., Hernquist, L., Cox, T. J., & Kereš, D. 2008, ApJS, 175, 356
- Hoyle et al. (2005) Hoyle, F., Rojas, R. R., Vogeley, M. S., & Brinkmann, J. 2005, ApJ, 620, 618
- Huchra & Geller (1982) Huchra, J. P., & Geller, M. J. 1982, ApJ, 257, 423
- Larson et al. (1980) Larson, R. B., Tinsley, B. M., & Caldwell, C. N. 1980, ApJ, 237, 692
- Limber & Mathews (1960) Limber, D. N., & Mathews, W. G. 1960, ApJ, 132, 286
- Lin et al. (1996) Lin H., Kishner R.P., Schectman S.A., Landy S.D., Oemler A., Tucker D.L., Schechter P.L., 1996, ApJ, 464, 60
- López-Cruz et al. (1997) López-Cruz O., Yee H.K.C., Brown J.P., Jones C., Forman W., 1997, ApJ, 475, 97
- Loveday et al. (1995) Loveday, J., Maddox, S. J., Efstathiou, G., & Peterson, B. A. 1995, ApJ, 442, 457
- Lynden-Bell (1971) Lynden-Bell D., 1971, MNRAS, 155, 95
- Madgwick et al. (2002) Madgwick, D. S., et al. 2002, MNRAS, 333, 133
- Mamon (2007) Mamon, G. A. 2007, Groups of Galaxies in the Nearby Universe, 203
- Martínez et al. (2002) Martínez, H. J., Zandivarez, A., Merchán, M. E., & Domínguez, M. J. L. 2002, MNRAS, 337, 1441
- Martínez et al. (2010) Martínez, H. J., Coenda, V., & Muriel, H. 2010, MNRAS, 403, 748
- Marzke et al. (1994) Marzke R.O., Huchra J.P. & Geller M.J., 1994, ApJ, 428, 43
- Merchán & Zandivarez (2002) Merchán, M., Zandivarez, A. 2002, MNRAS, 335, 216
- Merchán & Zandivarez (2005) Merchán M.E., Zandivarez A., 2005, ApJ, 630, 759
- Montero-Dorta & Prada (2009) Montero-Dorta, A. D., & Prada, F. 2009, MNRAS, 399, 1106
- Moore et al. (1996) Moore, B., Katz, N., Lake, G., Dressler, A., & Oemler, A. 1996, Nature, 379, 613
- Muriel et al. (1998) Muriel H., Valotto C. & Lambas D.G., 1998, ApJ, 506, 540
- Norberg et al. (2002) Norberg P., et al., 2002, MNRAS, 336, 907
- Park et al. (2007) Park, C., Choi, Y.-Y., Vogeley, M. S., Gott, J. R., III, & Blanton, M. R. 2007, ApJ, 658, 898
- Phleps et al. (2007) Phleps, S., Wolf, C., Peacock, J. A., Meisenheimer, K., & van Kampen, E. 2007, A&A, 468, 113
- Petrosian (1976) Petrosian, V. 1976, ApJL, 209, L1
- Popesso et al. (2005) Popesso, P., Böhringer, H., Romaniello, M., & Voges, W. 2005, A&A, 433, 415
- Ramella et al. (1997) Ramella, M., Pisani, A., & Geller, M. J. 1997, AJ, 113, 483
- Ratcliffe et al. (1998) Ratcliffe A., Shanks T., Parker Q.A., Fong R., 1998, MNRAS, 294, 147
- Rauzy et al. (1998) Rauzy S., Adami C. & Mazure A., 1998, A&A, 337, 31
- Robotham et al. (2010) Robotham, A., Phillipps, S., & de Propris, R. 2010, MNRAS, 403, 1812
- Sandage, Tammann & Yahil (1979) Sandage A., Tammann G.A., Yahil A., 1979, ApJ, 232, 352
- Schechter (1976) Schechter P., 1976, ApJ, 203, 297
- Schlegel et al. (1998) Schlegel, D. J., Finkbeiner, D. P., & Davis, M. 1998, ApJ, 500, 525
- Skibba et al. (2007) Skibba, R. A., Sheth, R. K., & Martino, M. C. 2007, MNRAS, 382, 1940
- Strateva et al. (2001) Strateva I., et al., 2001, AJ, 122, 1861
- Strauss et al. (2002) Strauss, M. A., et al. 2002, AJ, 124, 1810
- Tanaka et al. (2005) Tanaka, M., Kodama, T., Arimoto, N., Okamura, S., Umetsu, K., Shimasaku, K., Tanaka, I., & Yamada, T. 2005, MNRAS, 362, 268
- Tempel et al. (2009) Tempel, E., Einasto, J., Einasto, M., Saar, E., & Tago, E. 2009, A&A, 495, 37
- Tempel et al. (2010) Tempel, E., Saar, E., Liivamägi, L. J., Tamm, A., Einasto, J., Einasto, M., Müller, V. 2010, arXiv:1012.1470
- Toomre & Toomre (1972) Toomre, A., & Toomre, J. 1972, ApJ, 178, 623
- Trentham (1998) Trentham N., 1998, MNRAS, 295, 360
- Trentham & Tully (2002) Trentham N., Tully R.B., 2002, MNRAS, 335, 712
- Valotto et al. (1997) Valotto C.A., Nicotra M.A., Muriel H., Lambas D.G., 1997, ApJ, 479, 90
- Willmer (1997) Willmer C.N.A, 1997, AJ, 114, 898
- Withmore & Gilmore (1991) Whithmore, B., Gilmore, D., 1991, ApJ, 367, 64
- Withmore et al. (1993) Whithmore, B., Gilmore, D., Jones, C., 1993, ApJ, 407, 489
- Xia et al. (2006) Xia, L., Zhou, X., Yang, Y., Ma, J., & Jiang, Z. 2006, ApJ, 652, 249
- York et al. (2000) York, D. G., et al. 2000, AJ, 120, 1579
- Yang et al. (2005) Yang, X., Mo, H. J., van den Bosch, F. C., & Jing, Y. P. 2005, MNRAS, 356, 1293
- Yang et al. (2009) Yang, X., Mo, H. J., & van den Bosch, F. C. 2009, ApJ, 695, 900
- Zandivarez et al. (2006) Zandivarez, A., Martínez, H. J., & Merchán, M. E. 2006, ApJ, 650, 137
- Zehavi et al. (2005) Zehavi, I., et al. 2005, ApJ, 630, 1
- Zucca et al. (1997) Zucca E., et al., 1997, A&A, 326, 477
Appendix A Table
In the following table we quote the STY best-fitting Schechter parameters for different subsamples of galaxies in groups used in this work.
| Mass range111Units are | Mass range111Units are | Mass range111Units are | Mass range111Units are | ||||||||||||
| band - Early | band - Red & Late | band - low | |||||||||||||
| 7479 | 3322 | 1621 | 7187 | ||||||||||||
| 7998 | 3815 | 1785 | 6047 | ||||||||||||
| 8395 | 4150 | 1977 | 3329 | ||||||||||||
| 8681 | 4619 | 2048 | 1000 | ||||||||||||
| 9277 | 4970 | 2191 | band - high | ||||||||||||
| 9538 | 5312 | 2235 | 2360 | ||||||||||||
| 10004 | 5814 | 2344 | 3183 | ||||||||||||
| 10473 | 6368 | 2171 | 5296 | ||||||||||||
| 11348 | 7207 | band - Blue & Late | 10007 | ||||||||||||
| 12113 | 8298 | 3586 | band - low | ||||||||||||
| band - Late | 3471 | 5151 | |||||||||||||
| 4379 | 4157 | 3196 | 3406 | ||||||||||||
| 4301 | 4183 | 3259 | 3213 | ||||||||||||
| 4206 | 4245 | 3133 | 3002 | ||||||||||||
| 3932 | 4062 | 2964 | band - high | ||||||||||||
| 3879 | 4307 | 2904 | 2787 | ||||||||||||
| 3431 | 4227 | 2592 | 4155 | ||||||||||||
| 3043 | 4190 | band - | 5131 | ||||||||||||
| 2590 | 4106 | 3259 | 7332 | ||||||||||||
| 2193 | 4144 | 3660 | band - low | ||||||||||||
| 1384 | 3831 | 3894 | 3895 | ||||||||||||
| band - Red | 4118 | 3460 | |||||||||||||
| 5634 | 3860 | 4401 | 3627 | ||||||||||||
| 5830 | 4547 | 4504 | 4077 | ||||||||||||
| 5983 | 5007 | 4751 | band - high | ||||||||||||
| 5851 | 5522 | 4920 | 3607 | ||||||||||||
| 5914 | 5914 | 4799 | 4034 | ||||||||||||
| 5733 | 6353 | 3345 | 4428 | ||||||||||||
| 5564 | 6819 | band - | 5944 | ||||||||||||
| 5191 | 7354 | 4113 | band - low | ||||||||||||
| 5010 | 8174 | 4255 | 3289 | ||||||||||||
| 3664 | 8886 | 4410 | 3488 | ||||||||||||
| band - Blue | 4430 | 3900 | |||||||||||||
| 6442 | 3619 | 4664 | 4718 | ||||||||||||
| 6854 | 3451 | 4665 | band - high | ||||||||||||
| 7343 | 3388 | 4662 | 3971 | ||||||||||||
| 7560 | 3159 | 4757 | 3855 | ||||||||||||
| 8126 | 3363 | 4844 | 4214 | ||||||||||||
| 8333 | 3186 | 3637 | 5302 | ||||||||||||
| 8784 | 3185 | ||||||||||||||
| 9077 | 3120 | ||||||||||||||
| 9844 | 3177 | ||||||||||||||
| 10366 | 3243 | ||||||||||||||
| band - Red & Early | |||||||||||||||
| 5901 | 3327 | ||||||||||||||
| 6297 | 4047 | ||||||||||||||
| 6762 | 4759 | ||||||||||||||
| 6935 | 5251 | ||||||||||||||
| 7403 | 5891 | ||||||||||||||
| 7631 | 6475 | ||||||||||||||
| 8016 | 7556 | ||||||||||||||
| 8284 | 8765 | ||||||||||||||
| 9004 | |||||||||||||||
| 9400 | |||||||||||||||