11email: stefano.andreon@brera.inaf.it 22institutetext: GEPI, Paris-Meudon Observatory 5, Place Jules Janssen, 92190, Meudon, France
22email: marc.huertas@obspm.fr 33institutetext: Université Paris Diderot, 75205 Paris Cedex 13, France
Galaxies spatially coincident with the JKCS 041 X-ray emission display a red sequence at
Abstract
New deep data readly show a narrow red sequence co-centered with, and similary concentrated to, the extended X–ray emission of the cluster of galaxies JKCS 041. The JKCS 041 red sequence is mag redder in than the red sequence of the IRC0218A cluster, putting JKCS 041 at . The colour difference of the two red sequences gives a red-sequence based redshift of for JKCS 041, where the uncertainty accounts for uncertainties in stellar synthesis population models, in photometric calibration and in the red sequence colour of both JKCS 041 and IRC0218A clusters.
keywords:
Galaxies: evolution — galaxies: clusters: general — galaxies: clusters: individual JKCS 041 — galaxies: clusters: individual IRC0218A1 Introduction
Clusters markately differ from filaments, walls and sheets, up to the highest redshifts at which we have good data to allow such a discrimination. These structures are very different environments in terms of (hot) gas temperature and density, galaxy density, velocity dispersion, morphological composition, depth of the potential well, etc. While someone might argue that the difference between them is just semantic, as a matter of fact, we don’t known any astronomer calling “cluster” the Great Wall.
If one wants to study the evolution of galaxies in clusters, of the X-ray scaling relations of clusters, or any sensible cluster quantity, it seems not reasonable to build samples where clusters, filaments, walls and sheets enter (and exit) from the sample in an uncontrolled way. For example, a cluster sample contaminated at high redshift by the presence of filaments, walls and sheets is prone to confuse the effect of (look-back) time (i.e. evolution) with environment. Such a contamination is possible at high redshift if the studied sample includes systems that we actually don’t known whether they are clusters or not.
In order to discriminate high redshift clusters from other large scale strucures (redshift spikes, filaments, sheets, etc), a reliable probe of the structure size in the line of sight direction is the most difficult observation to acquire, because measurements are generally easier in the plane of the sky. Low quality velocity dispersions, with common small samples, are of little help unless the found velocity dispersion is large enough, and its error small, to discard low values typical of large scale structures or of galaxy pairs. X-ray is useful, because if an X-ray source is unambigously extended and spatially coincident with a galaxy overdensity, it testifies the presence of a potential well deep enough to hot and retain the intracluster medium, i.e. to reject non-cluster possibilities. However, a generic X-ray detection, such as such as those of some high redshift structure candidates from Chiaberge et al. (2009) or Henry et al. (2010), is insufficient in this respect because it could originate from the ICM but also from the numerous (at the cluster count rate) point sources (or a blend of them) of the X-ray sky. Distinguishing between a truely extended or a blend of point sources with just the few counts typical of faint X-ray detections requires a good PSF, like the one of Chandra. We emphasize that if a probability computation is used instead of Chandra data, it should be realistic, and allow, for example, blended point sources to have all possible fluxes (as in the real universe) and not only a single value as in Henry et al. (2010) computation.
Equally dangerous is allowing to enter in an uncontrolled way structures which won’t necessarily become clusters by . Several proto-clusters are in this situation, basically because the 1 (or 2) interval of the collapsing time includes values larger than the look-back time of the structure. For example, the ”proto-clusters” in Hatch et al. (2010) have a collapsing time of 6 Gyr, shorter than the look back time at the redshift of the systems (about 10.8 Gyr), but widely uncertain and larger that the latter at better than 1.5 sigma. Therefore, there is very little, if any, evidence that these systems will be clusters by today. Assuming that they will become clusters by , when such evidence is lacking, is risky and prone to mix different environments at different redshifts.
To summarize, having detected a structure at high redshift, it not enough to call it cluster. If the nature of the detected structure is unknown, we risk to compare apples (at very high redshift) to oranges (at lower redshift) and therefore call “evolution” what is instead “contamination” or “environemnt”.
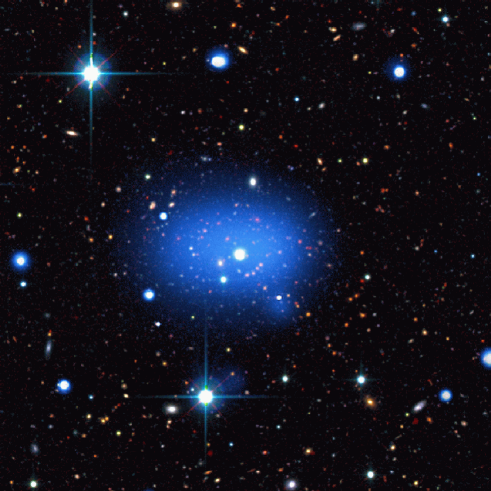
In that sense, JKCS 041 (Andreon et al. 2009, see Fig 1) is a uniq very high redshift cluster, as it has an unambiguously extended X-ray emission (from Chandra data) testifying the presence of an intracluster medium and deep potential well, that makes it unambigously a cluster. However, it lacks of a spectroscopic redshift: its 68 % photometric redshifts interval [1.89,2.12]. In this proceeding we first report the presence of a clear red sequence of passive galaxies in the region of JKCS 041 using a filter pair sampling the Balmer break at : the colour. Second, by comparing the red sequence colour of the JKCS 041 and IRC0218A, a spectroscopically confirmed cluster at (Papovich et al. 2010: Tanaka et al. 2010), we confirm that JKCS 041 lies at much higher redshift, and we quantify its photometric redshift (). More details can be found in Andreon & Huertas-Company (2010).
Throughout the paper, we assume the following cosmological parameters: km s-1 Mpc-1, and . Magnitudes are in the AB system.
2 Data and minor photometric corrections
JKCS 041 (see Fig. 1) is in the area covered by CFHTLS deep survey release and by WIRDS follow-up in the infrared filters () (Bielby et al., in preparation, catalogs are available on the Terapix site). More precisely, we use the catalog generated using -band as detection image and the other bands ( and ) in analysing mode.
IRC0218A is 2.1 degree aways from JKCS 041 and is in the area covered by Williams et al. (2009), whose catalogs are based on UKIDSS survey (Lawrence et al. 2007) for the infrared bands ( and ), and from the SXDS survey (Furusawa 2008) for the band. Colors listed in the catalog are measured in matched apertures and corrected for seeing differences.
The photometry of the two catalogs comes from different telescopes and reduction pipelines. The comparison of the stellar locii in the vs plane confirms that the two catalogs are truely on a consistent photometric system, after a minor color correction, mag, is applied to JKCS 041 colors.
3 Results
3.1 Red sequences & JKCS 041 photometric redshift
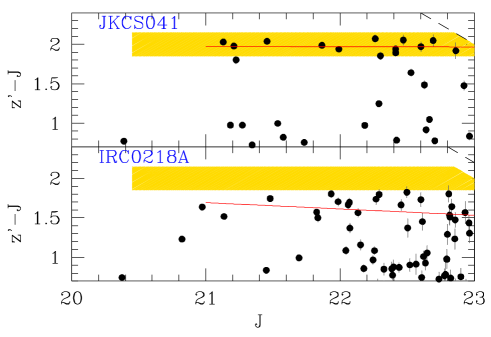
The top panel of Figure 2 shows the color-magnitude relations toward JKCS 041 within a radius of arcmin ( Mpc at ), after applying the minor photometric correction described above and a partial masking of 45 deg sector, partially contaminated by another structure 1.2 arcmin away. The bottom panel shows for comparison a random control region of the same solid angle (it turns out to be at roughly 0.4 deg north of JKCS 041). Slanted and vertical dashed lines mark magnitudes where the S/N=15 in (vertical) or (diagonal), and therefore delimit the region where catalogs should be complete. JKCS 041 presents a clear red sequence of objects well aligned, within a narrow colour band, all within 1 arcmin from the X-ray cluster center. We fit the red sequence through the Bayesian methods of Andreon (2006) and Andreon et al. (2006), also used for other clusters (Andreon 2008; Andreon et al. 2008), solving at once for all parameters: slope, intercept and intrinsic spread of the colour-magnitude relation, luminosity function parameters (characteristic magnitude, faint end slope and normalisation), accounting for photometric errors and also the presence of a fore/background population, the latter constrained using a control field region with a times larger solid angle. The mean fitted red sequence is marked in the figure as solid line, at mag.
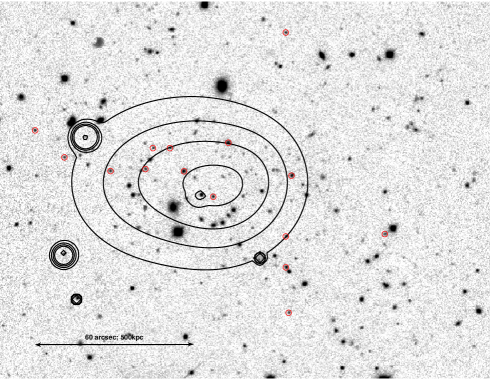
Fig. 3 shows the spatial distribution of galaxies within the shaded colour range, , with no spatial filtering applied: these galaxies are not uniformly distributed but concentrate in the region of the X-ray emission.
We also fitted the color-magnitude of IRC0218A. The solid, slanted, line at mag in the bottom panel of Fig. 2 marks it. We found the IRC0218A red sequence mag bluer than the JKCS 041 red sequence. The quoted error accounts for the error in the two red sequence intercepts ( and mag for JKCS 041 and IRC0218A, respectively) and the uncertainty in the photometric correction ( mag, see sec 2). The IRC0218A reddest galaxies are all bluer than the bluest galaxies on the JKCS 041 red sequence, and in fact none fall in the shaded area where JKCS 041 red sequence galaxies are found. The redder colour of the JKCS 041 red sequence directly implies that . Even without any photometric correction, the JKCS 041 red sequence is 0.29 mag redder than the IRC0218A red sequence, showing the much larger redshift of JKCS 041 compared to .
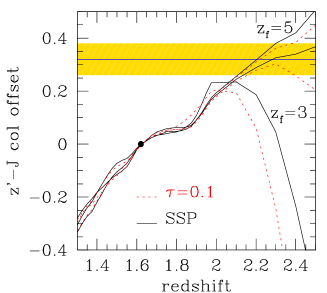
Fig. 4 plots colour tracks of single stellar populations (SSP, solid black) and exponential declining (, red dotted) models with solar metallicity, Chabrier initial mass function, formed at , zero-pointing them to the observed colour of IRC0218A cluster at . This approach to estimate the photometric redshift is more robust than using the absolute colour of the population, and benefits of a smaller extrapolation. For computing the colour tracks we use the 2007 version of Bruzual & Charlot (2003) synthesis population model. The measured colour difference is marked with an horizontal line, and its error is shaded. The JKCS 041 photometric redshift derived from a SSP model with can be easely read in it: . We add in quadrature a further 0.05 error term to approximatively account for different and star formation histories (this accounts for the total spread in redshift of the three models reaching a colour difference of mag) giving a final photometric redshift of .
The newly determined photometric redshift is slightly higher than the conservatively estimated photometric redshift quoted in Andreon et al. (2009) and consistent with it, since the two 68 % confidence intervals ([1.84,2.12] vs [2.09,2.31]) overlap. The current redshift determination superseeds the old determination, since we now use a calibration at similar redshift (via IRC0218 red sequence colour).
Bielby et al. (2010) detected, using the very same photometric catalog used here, a cluster co-centered with the X-ray cluster emission and formed by much the very same galaxies plotted in the top panel of Fig 2. They put their detection at which is in flagrant disagreement with the observed colour of the red sequence of the spectroscopically confirmed IRC0218 cluster: a red sequence should be 0.2 mag bluer than the IRC0218 red sequence (Fig. 4), whereas the observed red sequence is 0.32 mag redder.
The abundant spectroscopic (VVDS, Le Fevre et al. 2005) and photometric ( bands) data available for galaxies in the X–ray area of JKCS041 has attracted many authors to look for clusters in this region using a variety of cluster detection methods (e.g. Olsen et al. 2007, 2008; Grove et al. 2009; Mazure et al. 2007; Thanjavur et al. 2009). However, up to now, no other cluster co-centered with the X-ray emission has been found even, if as showed in this work, the quality of available data enables a detection at . Therefore, the galaxy cluster at is the only cluster from which the extended X–ray emission may come from.
4 Conclusions
We show that galaxies mag redder than the red sequence of the cluster IRC0218A are spatially concentrated where the JKCS 041 X-ray emission is located. Their red colour implies that the cluster JKCS 041 is at , where the uncertainty accounts for uncertainties in stellar synthesis population models, in photometric calibration and in the red sequence colour of both JKCS 041 and IRC0218A clusters.
We can hence confirm that JKCS 041 is a cluster of galaxies with the photometric redshift , with a formed potential well, deep enough to hot and retain the intracluster medium, and with a well defined red sequence. Incoming X–ray survey telescopes or red-sequence based surveys will likely return hundreds of clusters candidates. Getting spectroscopic redshifts for all of them, or even a small part, is too time consuming with present telescopes. Therefore, photometric redshifts based on the red sequence color will necessarily become very popular in the next years and we need to get used to them. Sunayev-Zeldovich surveys (e.g. High et al. 2010 for SPT; Menanteau et al. 2010 for ACT) are already using galaxy colours to infer the cluster redshift for their small (dozen of clusters) samples at low () redshift.
Acknowledgements.
We thank Marco Malaspina for Fig. 1 compositing. Based on observations obtained with MegaPrime/MegaCam111The full text acknowledgement is at http://www.cfht.hawaii.edu/Science/CFHLS/cfhtlspublitext.html and WIRCAM222The full text acknowledgement is at http://ftp.cfht.hawaii.edu/Instruments/Imaging/WIRCam/WIRCamAcknowledgment.html at CFHT.References
- Andreon (2006) Andreon, S. 2006a, A&A, 448, 447
- Andreon (2006) Andreon, S. 2006b, MNRAS, 369, 969
- Andreon (2008) Andreon, S. 2008, MNRAS, 386, 1045
- (4) Andreon, S. 2010, MNRAS, submitted
- (5) Andreon, S., Huertas-Company M. 2010, A&A, 526, A11 (arXiv:1012.1951)
- Andreon et al. (2006) Andreon, S., Cuillandre, J.-C., Puddu, E., & Mellier, Y. 2006, MNRAS, 372, 60
- Andreon et al. (2009) Andreon, S., Maughan, B., Trinchieri, G., & Kurk, J. 2009, A&A, 507, 147
- Andreon et al. (2008) Andreon, S., Puddu, E., de Propris, R., & Cuillandre, J.-C. 2008, MNRAS, 385, 979
- Bruzual & Charlot (2003) Bruzual, G., & Charlot, S. 2003, MNRAS, 344, 1000
- (10) Chiaberge M., et al. 2010, ApJ 710, 107
- (11) Grove L. F., Benoist C., Martel F., 2009, A&A, 494, 845
- (12) Hatch, N., et al. 2010, MNRAS, in press (arXiv:1008.458)
- High et al. (2010) High, F. W., et al. 2010, ApJ, submitted (arXiv:1003.0005)
- Henry et al. (2010) Henry, J. P., et al. 2010, ApJ, in press (arXiv:1010.0688)
- Lawrence et al. (2007) Lawrence, A., et al. 2007, MNRAS, 379, 1599
- Le Fèvre et al. (2005) Le Fèvre, O., et al. 2005, A&A, 439, 845
- Mazure et al. (2007) Mazure, A., et al. 2007, A&A, 467, 49
- Menanteau et al. (2010) Menanteau, F., et al. 2010, ApJ, in press (arXiv:1006.5126)
- Olsen et al. (2007) Olsen L. F., et al., 2007, A&A, 461, 81
- Olsen et al. (2008) Olsen L. F., et al., 2008, A&A, 478, 93
- Papovich et al. (2010) Papovich, C., et al. 2010, ApJ, 716, 1503
- Polletta et al. (2007) Polletta, M., et al. 2007, ApJ, 663, 81
- Tanaka et al. (2010) Tanaka, M., Finoguenov, A., & Ueda, Y. 2010, ApJ, 716, L152
- Williams et al. (2009) Williams, R. J., Quadri, R. F., Franx, M., van Dokkum, P., & Labbé, I. 2009, ApJ, 691, 1879