Cluster X-ray luminosity–temperature relation at
Abstract
The evolution of the properties of the hot gas that fills the potential well of galaxy clusters is poorly known, since models are unable to give robust predictions and observations lack a sufficient redshift leverage and are affected by selection effects. Here, with just two high redshift, , clusters avoiding selection biases, we obtain a significant extension of the redshift range and we begin to constrain the possible evolution of the X-ray luminosity vs temperature relation. The two clusters, JKCS 041 at and ISCS J1438+3414 at , are respectively the most distant cluster overall, and the second most distant that can be used for studying scaling relations. Their location in the X-ray luminosity vs temperature plane, with an X-ray luminosity 5 times lower than expected, suggests at the 95% confidence that the evolution of the intracluster medium has not been self–similar in the last three quarters of the Universe age. Our conclusion is reinforced by data on a third, X-ray selected, high redshift cluster, too faint for its temperature when compared to a sample of similarly selected objects. Our data suggest that non-gravitational effects, such as the baryon physics, influence the evolution of galaxy cluster. Precise knowledge of evolution is central for using galaxy clusters as cosmological probes in planned X-ray surveys such as WFXT or JDEM.
keywords:
clusters: general — galaxies: clusters: individual ISCS J1438+3414 — X-rays: galaxies: clusters1 Introduction
The observation of the diffuse, X–ray emitting medium (a.k.a. intra-cluster medium, or ICM) of galaxy clusters provides quantities like its mass, temperature () and X–ray luminosity (). The analysis of the scaling relation between these physical quantities gives considerable insight into the physical processes in the ICM (e.g. Rosati et al. 2002 and reference therein). On the other hand, the evolution of these scaling relations is difficult to predict theoretically (e.g. Norman 2010). The simplest model (Kaiser 1986), in which the ICM evolution is governed only by gravity, predicts an relation shallower than observed (Markevich 1998). This suggests that non-gravitational energy inputs, such as merger shocks or feedback from active galactic nuclei (AGNs) and star formation, need to be considered. More sophisticated models sensitively depend on the assumed physics of the baryons, and their predictions can be tuned to be in good agreement with observed scaling relations (Kravtov et al. 2005; Nagai, Kratsov & Vikhlinin 2007; Bode, Ostriker & Vikhlinin 2009) measured in the nearby Universe, if one accept an overprediction of the baryon fraction in stars by an order of magnitude (Gonzalez, Zarisky & Zabludoff 2007, Andreon 2010).
The most direct way to probe ICM evolution is to measure the scaling relations over a wide range of redshifts. Here a difficulty arises: many cluster samples with known and are either X-ray selected, or are heterogenous collections of objects without a simple and accountable selection function. In both cases, neglecting the selection function may bias the relation (Stanek et al. 2006; Pacaud et al. 2007; Nord et al. 2008), because at a given temperature clusters more luminous enter more easely in the sample (they can be seen on a larger volume, have smaller temperature errors, and are more frequently in archive and samples). Therefore, the mean at a given can be systematically over-estimated, unless one accounts for the selection function (e.g. Gelman et al. 2004, Pacaud et al. 2007, Andreon & Hurn 2010). The requirement of a known selection function restricts the choice of the available samples and the redshift baseline making hard to detect deviations from a self–similar evolution for lack of extension at high redshift. For example, for Pacaud et al. (2007), and for Pratt et al. (2009).
Only a handful of clusters are known at high (four at ). In this paper we use the only two suitable for this study, namely JKCS 041, probably the most distant cluster known to date, and ISCS J1438+3414 (at , Stanford et al., 2005), the second most distant cluster that can be used for studying scaling relations. Note that the redshift of JKCS 041, conservatively estimated at in Andreon et al. (2009) and has now a red-sequence estimated redshift of (Andreon & Huertas-Company 2010). Both are optically-NIR selected, i.e. are detected through their galaxies, and have been subsequently followed up in X rays (see Andreon et al. 2009 for JKCS 041 and this paper for ISCS J1438+3414) to derive and T for the gas. Though small, this sample is free from the biases that affect X-ray selected samples, since these clusters are considered independently from their X–ray luminosity. By using them, we extend the redshift baseline to , where the self-similar model predicts a brightening 1.7 times larger than at .
We adopt the following cosmological parameters: , and km s-1 Mpc-1. The scale, at , is 8.4 kpc arcsec-1. As point estimate and error measurements, we quote posterior mean and standard deviation when a Bayesian approch is esplicitely mentioned, or, otherwise the usual profile likelihood-based estimates (e.g. XSPEC error, ).
2 Data and Analysis
2.1 HST Observations
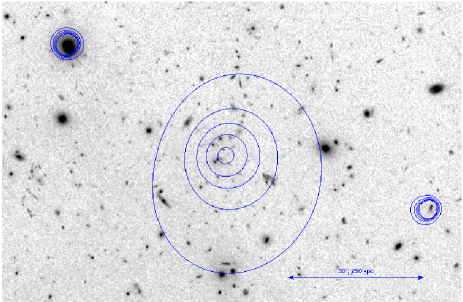
ISCS J1438+3414 has been observed with the Wide Field Camera of the Advanced Camera for Surveys (hereafter ACS, Ford et al. 1998, 2002) of the Hubble Space Telescope (HST, hereafter) for 10 ks with the F850LP filter. These data are reduced following the procedure adopted in, e.g., Andreon (2008): the raw ACS data were processed through the standard CALACS pipeline (Hack 1999) at STScI. This includes overscan, bias, and dark subtraction, as well as flat-fielding. Image combination has been done with the multidrizzle software (Koekemoer et al. 2002). The data quality arrays enable masking of known hot pixels and bad columns, while cosmic rays and other anomalies are rejected through the iterative drizzle/blot technique. Fig 1 shows the resulting image.
2.2 Chandra X-ray Observations
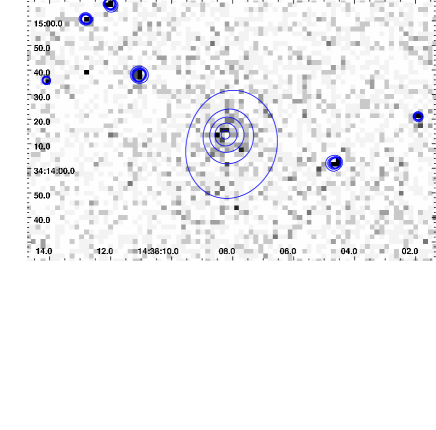
ISCS J1438+3414 was observed by Chandra for ks on 2009 October 4 and 9 (ObsID 10461 & 12003), using the ACIS-S detector. The data were reduced using the standard data reduction procedures and were checked for periods of high background. We found no differences between the data quality and the set-up of the instruments of the first and second observation. We therefore merged the two datasets for a total obsering time of 143 ks, consistent with the 150 ks originally requested. A preliminary examination of the data showed that the keV energy band gave the maximum cluster signal to noise ratio for our image analysis. The image produced in this energy band is shown in Fig. 2. The image was then adaptively smoothed with the Ebeling et al. (2006) algorithm, avaiable in the CIAO software, requesting a minimum significance of . Contours of this smoothed X-ray image are overlaid in Fig. 1 on the HST F850LP image. The X-ray morphology appears regular, but this could simply result from the relatively large kernel required by the low signal-to-noise of the cluster emission (). Within a 1 arcmin radius from the cluster centre there are photons in the 0.3-2 keV band (after subtraction of the background and exclusion of point sources).
2.2.1 X-ray Image Analysis
To quantify the cluster surface brightness distribution, the Chandra image of ISCS J1438+3414 was fit with a two-dimensional (2D) beta profile (Cavaliere & Fusco-Femiano 1978) with an additive constant (on detector) component for the background111 We checked that consistent results are found whether we model the background with a constant on the detector or we modulate it through the telescope vignetting.. The model was constrained to be circular. Point sources were masked out during the fitting process. We adopt the Bayesian approach of Andreon et al. (2008) with uniform priors except for , taken to be a Gaussian, zero-ed at (the beta model must have a finite integral), centered on and with width , the latter to account for the fact that clusters tend to have (e.g. Maughan et al. 2008). The posterior probability distribution of values resulting from the fit is displayed in Fig 3 and compared to the assumed prior. We found , but with a posterior distribution fairly different from a Gaussian (see Fig 3), implying that the data carry information about the beta parameter. Basically, the data constrain to be small, at 95 % confidence (with to ensure a finite flux), but not its exact value.
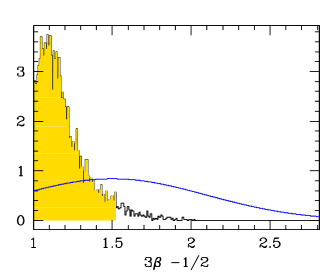
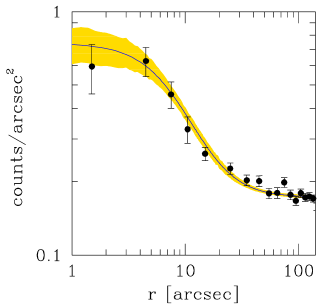
Figure 4 shows an azimuthally averaged radial profile of the data with euristic error bars (for visualisation purposes) and the mean 2D model, with 68 % (highest posterior) error (shaded). The latter rigorously accounts for uncertainty and co-variance of all modelled quantities. We emphasize that the model was not fit in this space. The X-ray emission is manifestly extended with respect to the Chandra 0.5 arcsec point spread function. The fit coordinates of the X-ray emission of ISCS J1438+3414 are arcsec and arcsec. We found a core radius of arcsec ( kpc). We also compute the core radius with fixed at , for comparison with other clusters, r arcsec ( kpc). In either case, rc is in the range of values observed for local clusters.
2.2.2 X-ray Spectral Analysis
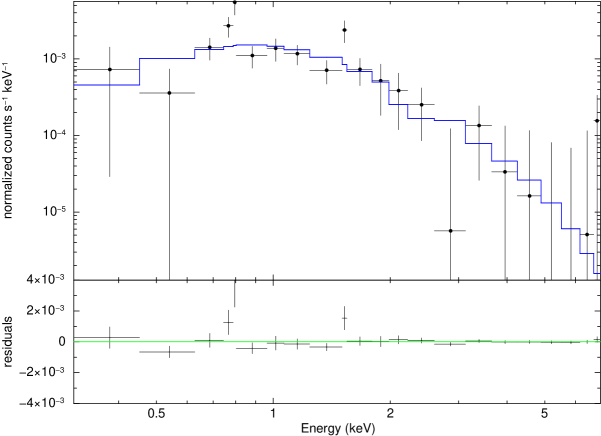
Our spectral analysis procedure was chosen to match that of Pacaud et al. (2007) to allow direct comparison with their relation. In summary, a cluster spectrum was extracted from an aperture of radius arcsec (252 kpc) (with minor masking of a single point source falling just outside the boundary), chosen to maximise the signal to noise ratio. A background spectrum was extracted from two regions around the cluster, sufficiently separated to exclude any cluster emission (mean backgroud radius: 125 arcsec, 1050 kpc at the cluster distance), and chosen to be included in the same chip, but avoiding gaps and bad columns. The resulting cluster spectrum containes net photons in the keV band used for spectral fitting. The source spectrum was fit with an absorbed APEC (Smith et al. 2001) plasma model, with the absorbing column fixed at the Galactic value ( cm-2, Dickey & Lockman 1990), the metal abundance fixed at relative to Solar and the redshift of the plasma model fixed at . The spectrum was grouped to contain a minimum of counts per bin and the source and background data were fit within the XSPEC spectral package using the modified C-statistic (also called W-statistic in XSPEC). Simulations in Willis et al. (2005) confirm that this methodology is reliable.
The best fitting spectral model (plotted in Fig. 5) gives keV, which results in an unabsorbed bolometric X-ray flux of erg cm-2 s-1.
In order to measure X-ray scaling relations we need , and therefore we need to estimate , which is derived from the cluster temperature, using the scaling relation of Finoguenov et al (2001) as given in equation 2 of Pacaud et al (2007). For the best fit temperature, Mpc, but temperature has errors, which we need to account for. We use a Bayesian approach: for each temperature (we used a chain of 1000 samples drawn from the temperature likelihood) we compute 1000 estimated values of . For each and for each sampling the posterior distribution of the parameters of the model (a chain of 2000 values), we compute the ratio between the flux in the spectral aperture and within the estimated , including correction for point sources. This gives the wanted posterior distribution of the conversion factor. It turns out to have a (near to) log-normal shape, i.e. it is normal after moving to log units. We found dex, i.e. the conversion factor has a % uncertainty. This uncertainty is larger than the uncertainty on the flux in the spectral aperture alone (10 %), and therefore cannot be neglected. Not accounting for the temperature error also induces a bias almost as large as the flux error in the spectral aperture. To summarize, the bolometric luminosity within is erg s-1. We emphasize that this is the luminosity within the angular aperture of radius .
Finally, the temperature of ISCS J1438+3414 can be used to estimate the cluster’s mass. Under the (strong) assumption that the temperature mass relation presented in Finoguenov et al. (2001) self-similarly evolves (doubtful, but adopted for lack of anything more suitable) from to , and neglecting all (at this point negligible) statistical subtilities, we found 222Although not as clearly stated as in this work, the mass of JKCS 041 quoted in Andreon et al. (2009) has been also derived self-similarly evolving the relation..
3 A first look at scaling relation at
Figure 6 shows the position of the two clusters in the X-ray luminosity, , vs X-ray temperature plane relative to the relation self-similarly evolved at the redshift of the two clusters. Because of the slighly revised redshift from the publication of Andreon et al. (2009), JKCS 041 data have been re-analized with the updated redshift. We find: erg s-1 and keV. Once the large temperature errors have been taken into account, it is plausible to find a cluster such as JKCS 041 in the volume surveyed in Andreon et al. (2009) in a standard CDM universe.
The relation is derived from data presented in Pacaud et al. (2007). In their paper, the authors account for the selection function, but did not publish the value of the parameters of the scaling. We obtained the selection function in electronic form directly from the authors, through a Bayesian analysis (Andreon & Hurn 2010) we recomputed the scaling at the median redshift of their sample, , and we checked that our results is entirely consistent with theirs. The scatter amplitude uses as prior the Stanek et al. (2006) measurements. The relation, self–similarly evolved at (solid blue line) and (dashed red line), is shown in Fig. 6.
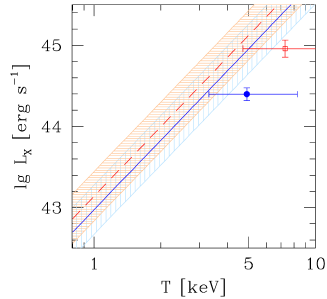
Both clusters are located below the self-similar expectation, too faint by dex (ISCS J1438+3414) and by dex (JKCS 041), i.e. by a factor 5, for their (best fitting) temperature. On the other end, they are about only “1 sigma” away from the predicted scaling relation, given their relatively large errors on . The probability to observe two points “1 sigma”, or more, away from the expected relation and on the same side is (), i.e. our claim is statistically significant at confidence (in the above, -value, sense). A more advanced analysis is not very useful: a) the influence of a redshift uncertainty for JKCS 041 is negligible: using the previous value of ( away from the current value) makes JKCS 041 dex too faint (vs dex) and still 1 sigma away from the predicted scaling relation; b) we performed a preliminary account for the fact that points are not exaclty “1 sigma” away and for the covariance between regressed quantities (, on abscissa, enters also in the ordinate, via ), but the ultimate limit is given by the sample size, not by the precise treatment of errors, and to improve the former more data are needed, not a better statistical analysis.
We have not included in our analysis the only remaining cluster at for which a measure of and is avalable, namely XMMXCSJ2215.9-1738 at (Stanford et al. 2006) because this cluster is X-ray selected and its (X-ray) selection function unpublished. As already noted by Hilton et al. (2010), this high redshift cluster is too faint for its temperature when compared to a sample of similarly selected objects from Maughan et al. (2006) and when the selection function is ignored. If we assume that the X-ray selection factors out (i.e. it is benign), our suggestion of a breaking of the self-similar evolution is reinforced and its statistical significance increased.
4 Conclusions & Discussion
The large redshift leverage considered in this paper has provided a direct, though not yet compelling, evidence that clusters do not evolve self-similarly in the last Gyr, about three quarter of the current age of the Universe. We remark that our result relies on a large redshift leverage, rather than on a detailed analysis of small effects on large samples at lower redshift. If confirmed, the trend we have found implies that non-gravitational effects, such as baryon physics, began long ago to shape the clusters’ scaling relations. In particular, the observed evolution is in line with the predictions of simulation that include high-redshift pre-heating and radiative cooling in addition to shock heating, such as those in Short et al. (2010). They predict that our clusters should be a factor 3 to 4 fainter than self–similar evolution while we observe a factor 5. Instead, their models that include feedback directly tied to galaxy formation or that incorporate gravitional heating only strongly disagree with our observations. This conclusion should not over-emphasized, because we are still a long away from having the numerical resolution required to really implement these mechanisms (e.g. Norman 2010), for example to follow the formation of stars, whose feedback is deemed important for the evolution of the gas properties.
It is of the utmost importance to extend the sample of non X-ray selected clusters to , to confirm the modulation provided by non-gravitational phenomena in the cluster evolution. We emphasize the need of non-X-ray selected samples: X-ray selected samples should be treated with caution when used in this context, because the probability that an object is in the sample is not random in at a given . Optically/near-infrared selected samples should instead be used since their selection is not due to their X-ray properties, unless we were able to predict their individual X-ray luminosity relative to the average X-ray luminosity at a given in absence of X-ray data and we were to make use of this information to select the objects.
If confirmed, the breakdown of the self–similar evolution, would have important consequences for the cosmological studies. Indeed, the evolution with redshift of the scaling relations is very sensitive to cosmological parameters (e.g. Allen et al. 2004; Albrecht et al. 2006, Report of the Dark Energy Task Force, and references therein). A proper assessment of the intrinsic processes shaping the scaling relations is fundamental for the use of galaxy cluster surveys, such as the planned WFXT (Conconi et al. 2010) and JDEM (Sholl et al. 2009), as probes of the cosmological parameters.
Acknowledgements
We thank Ben Maughan for his encouragement at the start of this work, Florian Pacaud for giving us the selection function of his sample in electronic form, and the anonymous referee for useful suggestions. This paper is based on observations obtained by Chandra (ObsID 10461 & 12003) and HST (10496). We acknowledge financial contribution from the agreement ASI-INAF I/009/10/0.
References
- art (2001) Albrecht A., et al., 2006, Report of the Dark Energy Task Force (arXiv:astro-ph/0609591)
- art (2011) Andreon S., 2008, MNRAS, 386, 1045
- aart (2012) Andreon S., 2010, MNRAS, 407, 263
- aart (2013) Andreon S., Huertas-Company, M. 2010, A&A, appeared (arXiv:1012.1951)
- aart (2014) Andreon S. & Hurn M., 2010, in preparation
- aart (2015) Andreon S., De Propris R., Puddu E., Giordano L., Quintana H., 2008, MNRAS, 383, 102
- aart (2016) Andreon S., Maughan B., Trinchieri G., Kurk J., 2009, A&A, 507, 147
- aart (2017) Bode P., Ostriker J. P., Vikhlinin A., 2009, ApJ, 700, 989
- aart (2018) Cavaliere A., Fusco-Femiano R., 1978, A&A, 70, 677
- Conconi et al. (2010) Conconi P., Campana S., Tagliaferri G., Pareschi G., Citterio O., Cotroneo V., Proserpio L., Civitani M., 2010, MNRAS, 405, 877
- aart (2132) Dickey, J. M., & Lockman, F. J. 1990, ARA&A, 28, 215
- aart (2128) Ebeling, H., White, D. A., & Rangarajan, F. V. N. 2006, MNRAS, 368, 65
- vart (2033) Finoguenov A., Reiprich T. H., Böhringer H., 2001, A&A, 368, 749
- aart (2123) Ford, H. C., et al. 1998, Proc. SPIE, 3356, 234
- aart (2124) Ford, H. C., 2002, Proc. SPIE, 4854, 81
- aart (2019) Gelman A., Carlin J., Stern H., Rubin D., 2004, “Bayesian Data Analysis”, (Chapman & Hall/CRC)
- aart (1991) Gonzalez, A. H., Zaritsky, D., & Zabludoff, A. I. 2007, ApJ, 666, 147
- aaart (1926) Hack, W. 1999, CALACS Operation and Implementation, Instrument Science Report ACS 99-03 (Baltimore: STScI)
- aart (111) Hilton M., et al. 2010, ApJ, in press (arXiv:1005.4692)
- aart (1912) Kaiser, N. 1986, MNRAS, 222, 323
- aart (1927) Koekemoer, A. M., Fruchter, A. S., Hook, R. N., & Hack, W. 2002, in The 2002 HST Calibration Workshop : Hubble after the Installation of the ACS and the NICMOS Cooling System, Proceedings of a Workshop
- aart (1931) Kravtsov, A. V., Nagai, D., & Vikhlinin, A. A. 2005, ApJ, 625, 588
- aart (1141) Markevitch, M. 1998, ApJ, 504, 27
- aart (1930) Maughan, B. J., Jones, C., Forman, W., & Van Speybroeck, L. 2008, ApJS, 174, 117
- aart (1961) Maughan, B. J., Jones, L. R., Ebeling, H., & Scharf, C. 2006, MNRAS, 365, 509
- aart (1161) Nagai, D., Kravtsov, A. V., & Vikhlinin, A. 2007, ApJ, 668, 1
- aart (1971) Nord B., Stanek R., Rasia E., Evrard A. E., 2008, MNRAS, 383, L10
- aart (1982) Norman M. L., 2010, unpublished (arXiv:1005.1100)
- av (1993) Pacaud F., et al., 2007, MNRAS, 382, 1289
- aart (1100) Pratt, G. W., Croston, J. H., Arnaud, M., Böhringer, H. 2009, A&A, 498, 361
- aart (1923) Rosati, P., Borgani, S., & Norman, C. 2002, ARA&A, 40, 539
- Sholl et al. (2009) Sholl M. J., et al., 2009, SPIE, 7436,
- aart (1925) Short, C., Thomas, P., Young, O., Pearce, F., Jenkins, A., Muanwong, O, 2010, MNRAS, submitted (arXiv:1002.4539)
- aart (1931) Smith, R. K., Brickhouse, N. S., Liedahl, D. A., & Raymond, J. C. 2001, ApJ, 556, L91
- aart (1928) Stanek R., Evrard A. E., Böhringer H., Schuecker P., Nord B., 2006, ApJ, 648, 956
- aart (1929) Stanford S. A., et al., 2005, ApJ, 634, L129
- aart (1930) Stanford S. A., et al., 2006, ApJ, 646, L13
- Willis et al. (2005) Willis, J. P., et al. 2005, MNRAS, 363, 675