Quest for Order in Chaos: Hidden Repulsive Level Statistics
in Disordered Quantum Nanoaggregates
Abstract
The local distribution of exciton levels in disordered cyanine-dye-based molecular nano-aggregates has been elucidated using fluorescence line narrowing spectroscopy. The observation of a Wigner-Dyson-type level spacing distribution provides direct evidence of the existence of level repulsion of strongly overlapping states in the molecular wires, which is important for the understanding of the level statistics, and therefore the ‘functional properties, of a large variety of nano-confined systems.
pacs:
PACS number(s): 78.30.Ly 73.20.Mf 71.35.Aa;One of the current dreams in the field of molecular optics is the full understanding of nature’s way to harvest and use photonic energy which ultimately could enable the development and design of highly efficient functional optical devices using molecular arrangements as building blocks. One of the crucial elements of such photonic assemblies are the ’wires’ which transport the energy between the different functional units of the devices. Natural systems often utilize structures of coupled aggregated pigments to transport energy in the form of excitonic excitations. vanAmerongen00 ; Renger01 ; Berlin06 ; Scholes06 Such structures can also be mimicked in synthetic systems, greatly assisting studies aiming to understand their fundamental properties. An important class of synthetic species, on which we focus here, is found in the so-called one dimensional (1D) -aggregates based on, for instance, pseudoisocyanine, porphyrin, and benzimidazole carbocyanine dyes. Kobayashi96 ; Knoester02 ; Pugzlys06
Synthetic, as well as natural systems, usually exhibit a substantial degree of disorder, arising from the environment and from vibrations and disorder within the systems themselves. In general the presence of disorder in gapped systems leads to the formation of highly localized states inside the optical, electronic or magnetic energy gap of the unperturbed system; i.e. to a tail of the density of states inside the gap generally referred to as the Lifshits tail. Lifshits88 There are many systems which optical properties are governed by exciton-like excitations highly susceptible to disorder leading to localization and level repulsion phenomena. These include conjugated oligomer aggregates Spano06 and polymers, Hadzii99 molecular -aggregates, Kobayashi96 ; Knoester02 ; Pugzlys06 semiconductor quantum wells and quantum dots, Takagahara03 gold nanoparticles, Kuemmeth08 semiconductor quantum wires, Akiyama98 as well as photosynthetic light harvesting complexes vanAmerongen00 ; Renger01 and proteins Berlin06 (see Ref. Scholes06, for a recent overview). In all these systems, excitons are confined at least in one dimension at a nanometer scale.
The physical and transport properties of most of the above mentioned systems are predominantly determined by the states residing in the vicinity of the energy gap, i.e. the gap excitation itself and the Lifshits tail below it, even at finite temperatures. Malyshev03 The localization of the exciton states within the Lifshits tail gives rise to a local (hidden) statistics of the levels, which deviate substantially from the overall statistics. Malyshev95 ; Malyshev01a Therefore, understanding the physical properties of these systems requires the use of statistical approaches; the energy level distributions become an important part of the theory and interpretation of the experimental data.
For non-interacting systems it is well known that the presence of disorder leads to an energy spectrum with a Poissonian energy spacing distribution. In less trivial cases of interacting systems, the situation naturally becomes more complex leading to the concept of level repulsion, i.e. a vanishing probability to find two quantum states with the same energy. The level statistics of such a system is known as Wigner-Dyson statistics (see the excellent textbook by Metha Ref. Metha04, for an overview).
Level repulsion phenomena in nano-confined materials has recently drawn considerable attention, in particular, concerning localized Wannier excitons in disordered quantum wells Haacke01 ; Intonti01 and wires, Feltrin03 and in disordered graphene quantum dots, Libisch09 as well as concerning vibronic states in polyatomic molecules. Krivohuz08 Time-resolved resonant Rayleigh scattering Haacke01 and near-field spectroscopy Intonti01 ; Feltrin03 have been used to study them. In Ref. Malyshev07, , an alternative method has been proposed to analyze the level statistics – low-temperature time-resolved selectively excited exciton fluorescence spectroscopy, widely known as fluorescence line narrowing (FLN) spectoscopy. Under a narrow (compared to the the -band width) excitation within the -band, the fluorescence spectrum consist of a sharp intensive peak at the excitation energy and, growing in time, a red-shifted feature, resulting from the exciton band relaxation. It is this feature that contains information about the level statistics of the spatially overlapped states.
Here we apply a variant of this method to reveal the repulsive statistics of levels residing in the Lifshits tail Lifshits88 of J-aggregates of pseudoisocyanine (PIC) with a chloride counter-ion (PIC-Cl). In contrast to the earlier proposal to use time dependent FLN, Malyshev07 we here show that also steady state FLN, which is much more simple in realization, can be utilized to extract the desired information. We extract the conditional probability distribution of the repelled states from the experimental data and show that this distribution is Wigner-Dyson-like indicating zero probability for zero energy spacing, which is a fingerprint of the level repulsion.
Figure 1 shows the absorption and fluorescence spectra of -aggregates of PIC-Cl, the latter measured after excitation using 400 nm light. Both spectra exhibit an intense peak arising from the dominant exciton transitions (the -band) and a much less intense and broad shoulder located on the red side of the -band. We relate this red feature to aggregates in the vicinity of the substrate as the relative intensity of this shoulder decreases upon increasing thickness of the aggregated film. For completeness, we note that the overall absorption spectrum of our samples (see inset in Fig. 1) is found to be in good agreement with earlier results. Renge97

Before turning to the main experimental results, we briefly sketch some of the theoretical background relevant for the present study; more details on the model and the energy level structure of the disordered -aggregates has been discussed in Ref. Malyshev01a, . A typical realization of the calculated low-energy level structure and wavefunctions for a one dimensional aggregate of 300 chromophors is depicted in Fig. 2. In this calculation, we used a gaussian disorder distribution of the chromophore energies with standard deviation (disorder degree from now on), being the transfer interaction between chromophores (for more details see Ref. Malyshev01a, ).
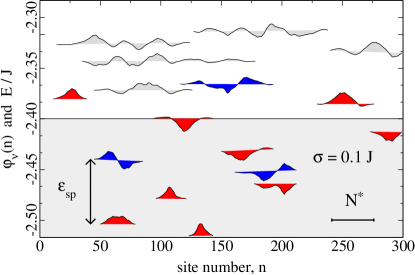
Without disorder wavefunctions are fully delocalized, and the lowest state is located at -2.404. The presence of disorder leads to localization of the wavefunctions within so called segments, and to the appearance of highly localized states within the band gap, i.e. in the Lifshits tail (grey shaded area in Fig. 2). These are the states of our primary interest since they determine the optical properties and transport in the J-aggregates. They originate from localization in well-like fluctuations of the site potential on the molecules. The optically dominant states resemble -like wavefunctions which have no nodes within their localization segments. The -like states lying deep in the Lifshits tail usually appear as singlets and are localized by the so called optimal fluctuations of the site energy. Lifshits88 Close to the band edge, however, the -like states often have partners localized within the same localization segment. The latter look like -states, having one node within their localization segment. Manifolds like these form the local (hidden) structure of the tail of the density of states. Since these states are localized on the same segment, one may expect level repulsion to occur for them, as is indeed observed. In contrast, states from distant (non-overlapping) manifolds can be arbitrarily close in energy.
Optical experiments probe the states with a finite transition dipole moment. For the -like states, the transition dipole moment scales proportionally to , where is the typical localization length of the states. This enhancement of the dipole moment is known as superradiant enhancement. Fidder90 Typically, the -like states have a transition dipole moment which is several times smaller than the -like states. Malyshev07 Nevertheless, since the -states are not perfectly antisymmetric, they do have a finite transition dipole moment and these states can be optically excited too. Therefore optical experiments can be used to probe the level statistics by studying the relaxation between and like levels. Malyshev07
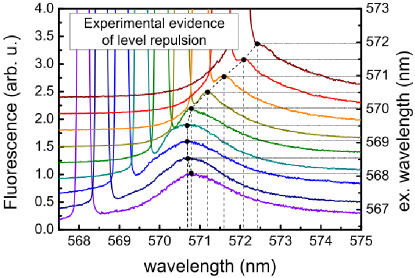
To experimentally study the level statistics in the neighborhood of the exciton band edge, we performed steady state resonance fluorescence measurements using a narrow excitation line to excite states within the -band. Figure 3 shows a number of such spectra recorded at low temperature using different excitation energies. The spectra show a strong peak at the excitation wavelength, together with a broad red-shifted emission band separated from the main peak by a pronounced dip. The red shifted emission originates from relaxation of the initially excited exciton states into states of the Lifshits tail of the DOS. The position of the maximum of this band remains almost unchanged while -aggregates are excited on the blue side of the -band. For the red-side excitation, the peak position moves to the red, the line shape changes considerably, and the dip washes out. This is a consequence of the changes in the relaxation pathways since red-side excitation predominantly excites -like states.
The dip close to the excitation energy in blue side excited spectra distribution shows that energy relaxation into states close to the excitation energy is substantially suppressed, hinting to the occurrence of level repulsion. The sheer existence of the dip, however, is not enough to conclude on the level statistics. The problem is that the relaxation process from the initially excited states to the lower lying levels is phonon assisted and, hence, the line shape is determined by the product of the level spacing distribution function and the phonon spectral density. Since the phonon spectral density vanishes for zero energy, one expects the spectral intensity to vanish at the excitation energy, even without level repulsion. Moreover, one also should bear in mind that together with the fluorescence of the relaxed excitons two more processes contribute to the red feature and affect its line shape: the phonon side-band fluorescence, Malyshev07 and surface-mediated fluorescence in our thin samples. All three contributions to the red-shifted feature are spectrally superposed and must be separated in order to extract the signal we are interested in. We note, however, that if the observed red-shifted feature would solely originate from the phonon side-band, its line shape and position would be virtually independent of the excitation wavelength, clearly in contradiction to the experimental observations.
In the analysis of the observed spectra we limit ourselves to those spectra measured using excitation on the blue side of the -band, since it is here that one expects the -like states to contribute most strongly. In order to discriminate the true relaxation mediated fluorescence (RMF) from the surface mediated and the phonon sideband fluorescence we use a simple subtraction method. For this, we consider the differential spectrum between two experimental spectra with close excitation wavelengths defined by
| (1) |
where the second term on the right hand side is the spectrum shifted in wavelength to match its excitation peak position with that of the spectrum. In addition, this term is rescaled by a factor of in order to cancel the red tail in the spectra; any feature that is not wavelength dependent is suppressed in the difference spectrum 1, and the resulting difference spectrum represents just the RMF differential signal :
| (2) |
At the next step, we calculated the quantum efficiency of the red-shifted feature and found that it did not exceed 0.3 for most blue excitation. For the spectra we will use in the fitting procedure, the efficiency even smaller, around 0.1. This means that excitons make only one step of relaxation, moreover, the major contribution to this process comes from the intra-segment hops (see the discussion in Section 2). Then the theoretical RMF line shape , and we can relate two RMF spectra taken for different (close) excitation wave length as:
| (3) |
where we assumed that the energy spacing distribution function varies much slower than the phonon spectral density, the assumption which, as will be seen, is consistent with the final results. Substituting Eq. (3) into (2), we arrive at a relationship between the differential and ordinary RMF spectra:
| (4) |
where
| (5) |
i.e., the lineshape of the RMF spectrum can be extracted from the lineshape of the differential RMF spectrum by dividing it by the known correction function, provided the factor is adjusted to cancel long red tale.
It is important that the correction function is almost constant for wave lengths that are far from the excitation wave lengths (). Hence, it would not change the shape of the distant features in the long red tail of the experimental fluorescence spectra. Such features will therefore be canceled in the difference spectrum which will contain only the contribution of the RMF. Finally, applying the above reasoning and formulae to the experimental FLN spectra, we can recover the MRF lineshape according to the formula (4).

The described procedure has been applied to two spectra recorded using excitation in the blue part of the absorption spectrum ( nm and nm). The result, assuming a Debye-like spectral density is shown in Fig. 4. The extracted RMF spectrum, obtained using , is shown in the figure by the open circles. Clearly, the non-RMF contributions, leading to the long red tail the fluorescence spectrum, is, as expected, nearly fully eliminated. Superimposed on this experimental spectrum is the result of a simulation of the RMF fluorescence spectrum, using a Gaussian disorder with standard deviation , again assuming a Debye model for the phonon spectral density, and an exciton-phonon scattering strength of J (see for details Ref. Malyshev07, ), which reproduces the Stokes shift presented in Fig. 1.
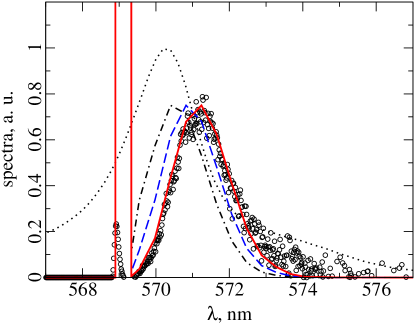
It is to be noticed that calculations performed with non-Debye models for the phonon spectral density, do not lead to a satisfactory agreement with the experimental data. This is clearly demonstrated in Fig. 5. The apparent validity of the usage of the Debye model corroborates the results of Ref. Heijs05, , where this model has been successfully used to explain the temperature dependence of the J-band width and the radiative lifetime of J-agregates of the dye pseudoisocynine wiith different counter ions.
Figure 4 shows the principal result of the present work: the conditional distribution of the nearest-level spacing, (diamonds), obtained after dividing the extracted RMF spectrum presented in Fig. 4 (open circles) by the phonon spectral density . We see that tends to zero upon . This is a clear signature of the repulsive statistics of the nearest level spacing. i.e., it is of a Wigner-Dyson-type. In spite of the observed distribution is strikingly close to a Wigner-Dyson one, it remains difficult to determine whether it is the trully Wigner-Dyson distribution, requiring a linear decrease to zero probability for zero spacing, which, though consistent with the data, is not fully proven by the current experiments and analysis.
To conclude, we experimentally studied the statistics of the low energy spectrum of disordered molecular nano aggregates of pseudoisocyanine with the chloride counter ion in the neighborhood of the exciton band edge. The fluorescence line narrowing technique, allowing to probe the local energy level distribution, Malyshev07 has been exploited for this goal. We found a clear signature of a Wigner-Dyson-like distribution for the nearest level spacing, originating from the exciton states localized on the same segment of the aggregate and thus undergoing the quantum mechanical level repulsion. This is the first direct experimental prove of the existence of hidden structure of the exciton low energy spectrum, the region which dominates the aggregate optical response and low-temperature transport.
Finally, we note that our finding has a wider applicability than for a simple 1D Frenkel exciton system considered here. The reason is that the nature of the band edge states (mostly in the Lifshits tail) is shared by a large variety of systems, such as gold nanoparticlesKuemmeth08 , quantum wells and quantum wires Alessi00 ; Klochikhin04 ; Feltrin04a .
Acknowledgments. This work is part of the research program of the Stichting voor Fundamenteel Onderzoek der Materie (FOM), which is financially supported by the Nederlandse Organisatie voor Wetenschappelijk Onderzoek (NWO). A. V. M. and V. A. M. acknowledge support from NanoNed, a national nanotechnology programme coordinated by the Dutch Ministry of Economic Affairs. A. V. M. also acknowledges support from the program Ramón y Cajal (Ministerio de Ciencia y Tecnología de España).
References
- (1) H. van Amerongen, L. Valkunas and R. van Grondelle, Photosynthetic Excitons (World Scientific, Singapore, 2000); R. van Grondelle and V. I. Novoderezhkin, Phys. Chem. Chem. Phys. 8, 793 (2006).
- (2) T. Renger, V. May, and O. Kühn, Phys. Rep. 343, 137 (2001).
- (3) Y. Berlin, A. Burin, J. Friedrich, and J. Köhler, Phys. Life Rew. 3, 262 (2006); 4, 64 (2007).
- (4) G. D. Scholes and G. Rumbles, Nature Mat. 5, 683 (2006); G. D. Scholes, ACS Nano 2, 523 (2008).
- (5) See contributions to J-aggregates, ed. T. Kobayashi (World Scientific, Singapore, 1996)
- (6) J. Knoester, In Organic Nanostructures: Science and Applications, Eds. V. M. Agranovich and G.C. La Rocca (IOS Press: Amsterdam, 2002); J. Knoester, Int. J. Photochem. 2006 (Hindawi: New York, 2006).
- (7) A. Pugžlys, R. Augulis, P. H. M. van Loosdrecht, C. Didraga, V. A. Malyshev, and J. Knoester, J. Phys. Chem. B 110, 20268 (2006).
- (8) B. Halperin and M. Lax, Phys. Rev. 148, 722 (1966); I. M. Lifshits, Zh. Experim. Theor. Fiz. 53, 743 (1967) [Sov. Phys. JETP 26, 462 (1968)]; I. M. Lifshits, S. A. Gredeskul, and L. A. Pastur, Introduction to the Theory of Disordered Systems (Wiley, New York, 1988).
- (9) F. C. Spano, Annu. Rev. Phys. Chem. 57, 217 (2006).
- (10) See, e.g., contributions to Semiconducting Polymers - Chemistry, Physics, and Engineering, eds. G. Hadziioannou and P. van Hutten (VCH, Weinheim, 1999).
- (11) see contributions to Quantum Coherence, Correlation and Decoherence in Semiconductor Nanostructures, ed. T. Takagahara, (Elsevier Science, USA, 2003).
- (12) F. Kuemmeth, K. I. Bolotin, S. F. Shi, D. C. Ralph, Nano Lett. 8, 4506 (2008).
- (13) H. Akiyama, J. Phys.: Condens. Matter 10, 3095 (1998); X.-L. Wang and V. Voliotis, J. Appl. Phys. 99, 121301 (2006).
- (14) A. V. Malyshev, V. A. Malyshev and F. Domínguez-Adame, Chem. Phys. Lett. 371, 417(2003); J. Phys. Chem. B 107, 4418 (2003); A. Malyshev, Phys. Stat. Sol. (c) 3, 3539 (2006).
- (15) V. Malyshev and P. Moreno, Phys. Rev. B 51, 14587 (1995).
- (16) A. V. Malyshev and V. A. Malyshev, Phys. Rev. B 63, 195111 (2001).
- (17) M. L. Metha, Random Matrices, 3d Edition, Elsevier: Amsterdam, 2004.
- (18) V. Savona and R. Zimmermann, Phys. Rev B 60, 4928 (1999); V. Savona, S. Haacke, and B. Deveaud, Phys. Rev. Lett. 84, 183 (2000); S. Haacke, Rep. Prog. Phys. 64, 737 (2001).
- (19) F. Intonti, V. Emiliani, C. Lienau, T. Elsaesser, V. Savona, E. Runge, R. Zimmermann, R. Nützel, and K. H. Ploog, Phys. Rev. Lett. 87, 76801 (2001); C. Lienau,F. Intoni, T. Guenther, T. Elsaesser, V. Savona, R. Zimmermann, and E. Runge, Phys. Rev. B 69, 085302 (2004).
- (20) A. Feltrin, R. Idrissi Kaitouni, A. Crottini, J. L. Staehli, B. Deveaud, V. Savona, X. L. Wang, and M. Ogura, Phys. Stat. Sol (c) 0, 1417 (2003); A. Feltrin, R. Idrissi Kaitouni, A. Crottini, M.-A. Dupertuis, J. L. Staehli, B. Deveaud, V. Savona, X. L. Wang, and M. Ogura, Phys. Stat. Sol. (c) 1, 506 (2004); A. Feltrin, R. Idrissi Kaitouni, A. Crottini, M.-A. Dupertuis, J. L. Staehli, B. Deveaud, V. Savona, X. L. Wang, and M. Ogura, Phys. Rev. B 69, 205321 (2004).
- (21) F. Libisch, C. Stampfer, anf J. Burgdörfer, Phys. Rev B 79, 115423 (2009).
- (22) M. Krivohuz, J. Cao, and S. Mukamel, J. Phys. Chem. B 112, 15999 (2008).
- (23) A. V. Malyshev, V. A. Malyshev, and J. Knoester, Phys. Rev. Lett. 98, 087401 (2007).
- (24) I. Renge and U. P. Wild, J. Phys. Chem. A 101, 7977 (1997).
- (25) H. Fidder, J. Knoester, and D. A. Wiersma, Chem. Phys. Lett. 171, 529 (1990); J. Chem. Phys. 95, 7880 (1991).
- (26) M. Bednarz, V. A. Malyshev, and J. Knoester, J. Lumin. 112, 411 (2005); M. Bednarz and P. Reineker, J. Lumin. 119-120, 482 (2006).
- (27) D. J. Heijs, V. A. Malyshev, and J. Knoester, Phys. Rev. Lett. 95, 177402 (2005).
- (28) M. Grassi Alessi, F. Fragano, A. Patané, and M. Capizzi, E. Runge, and R. Zimmermann, Phys. Rev. B 61, 10985 (2000).
- (29) A. Klochikhin, A. Reznitsky, B. Dal Don, H. Priller, H. Kalt, and C. Klingshirn, S. Permogorov, and S. Ivanov, Phys. Rev. B 69, 085308 (2004).
- (30) A. Feltrin, J. L. Staehli, and B. Deveaud, V. Savona, Phys. Rev. B 69, 233309 (2004).