The Position/Structure Stability of Four ICRF2 Sources
Abstract
Four close radio sources in the International Celestial Reference Frame (ICRF) catalog were observed using phase referencing with the VLBA at 43, 23 and 8.6 GHz, and with VERA at 23 GHz over a one year period. The goal was to determine the stability of the radio cores, and to assess structure effects associated with positions in the ICRF. Although the four sources were compact at 8.6 GHz, the VLBA images at 43 GHz with 0.3-mas resolution showed that all were composed of several components. A component in each source was identified as the radio core using some or all of the following emission properties: compactness, spectral index, location at the end of the extended emission region, and stationary in the sky. Over the observing period, the relative positions between the four radio cores were constant to 0.02 mas, the phase referencing positional accuracy obtained at 23 and 43 GHz among the sources, suggesting that once a radio core is identified, it remains stationary in the sky to this accuracy. Other radio components in two of the four sources had detectable motion in the radio jet direction. Comparison of the 23 and 43 GHz VLBA images with the VLBA 8.6 GHz images and the ICRF positions suggests that some ICRF positions are dominated by a moving jet component; hence, they can be displaced up to 0.5 mas from the radio core, and may also reflect the motion of the jet component. Future astrometric efforts to determine a more accurate quasar reference frame at 23 and 43 GHz and from the VLBI2010 project are discussed, and supporting VLBA or EVN observations of ICRF sources at 43 GHz are recommended in order to determine the internal structure of the sources. A future collaboration between the radio (ICRF) and the optical frame of Gaia is discussed.
1 Motivation for the Experiment
The Second Realization of the International Celestial Reference Frame (ICRF2) is defined by the positions of 295 compact radio sources located around the sky (Fey et al, 2010). The positional errors for many of these sources is less than 0.06 mas obtained by averaging decades of observations, and they define the axes of a radio-based quasi-inertial frame to about 0.01 mas precision. This positional accuracy is presently limited by a typical residual variable tropospheric refraction of about 20 psec ( 0.15 mas) for a time-scale of tens of minutes and angular size scale of tens of degrees.
The radio source emission for most sources in the ICRF2 catalog (quasars and galaxies) is dominated by a strong compact radio component (called the radio core) with a size mas. This radio core is probably located at the base of a radio jet that is formed perpendicular to the accretion disk about 1000 to 10000 Schwarzschild radii from the massive object in the galactic nucleus (Marscher, 2006). For quasars and radio galaxies at cosmological distances, this offset is less than about 0.01 mas, so the radio core should represent a fixed point in the sky at this precision. However, there is often more extended emission (generically called the jet) that may be connected to the core, or consist of discrete components. The emission of the core and jet both vary with time, and the jet often contains components that move away from the core. Because the emission near the core becomes more opaque at lower frequencies, the determination of the core position becomes problematic. Although the magnitude of this uncertainty caused by structure is less than that from troposphere refraction, it is becoming an important part of the position error budget as the tropospheric modeling and measurements improve.
In order to determine the effect of structure and its changes on the apparent radio core positions obtained from radio observations, the effect of the tropospheric refraction variations must be significantly decreased in order to reach the structure astrometric effects. By using a VLBI technique called phase referencing, where several sources that are closely spaced on the sky are observed simultaneously or in quick succession, a large part of the tropospheric refraction can be canceled. For frequencies as high as 43 GHz, the needed phase stability (residual tropospheric-induced and other phase errors should be less than about 1 radian) can be obtained most of the time if the separations among the sources are less than a few degrees, and the switching times between sources is less than about one minute.
2 Observations and Initial Data Processing
2.1 Source Selection
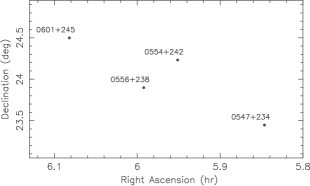
The source selection was made to accommodate observations by the VLBI Exploration of Radio Astrometry (VERA) four-element VLBI array in Japan (Honma et al, 2008) that can observe two sources simultaneously if they are separated by no more than . A search of the 8.6-GHz ICRF catalog found several sets of sources and the best set for phase referencing were the four sources: 0547+234, 0554+242, 0556+238 and 0601+245. The relative position of the four sources are illustrated in Fig. 1. The positions and approximate intensity parameters for the sources are shown in Table 1. The apriori positions, taken from the ICRF catalog, are fiducial locations for each source (phase center used in the correlation of the data) to which the measured offset positions and structures are referred. The approximate correlated flux densities at each frequency are given for the projected spacing of 200 km (S) and at 5000 km (L). The values have been taken from these observations. All of the sources are somewhat variable. Because the sources are within of the galactic plane, there are no firm identifications, and their redshifts are not known. The sources are probably quasars with a redshift between 0.5 to 2.0 (Hardwick & Schade, 1990).
The source 0556+238 is one of the 295 defining sources in the ICRF2 catalog. The other three sources are in the extended ICRF2 list, but are not one of the defining sources because of their somewhat limited use in the ICRF sessions over the past thirty years.
Although this quartet of sources was chosen because of their proximity in the sky and their relative strength and compact structure at 8.6 GHz, other deeper properties of these sources—internal structure and its frequency dependence, and variability time-scale—were unknown at the higher frequencies and resolutions used for these observations. These four sources are a representative, although limited, sample of good quality ICRF sources for the deeper investigations reported in this paper.
2.2 Observing Sequences
The list of observing sessions are given in Table 2 The initial observing request was submitted to the Japanese VERA array, and the first observing session at 23 GHz occurred on 18 April 2008. The session was 6.5 hours in length, and cycled among the source pairs: 0547-0554; 0547-0556; 0554-0556; 0554-0601; 0556-0601, all with a separation less than so VERA could observe each source-pair simultaneously. Only the source pair separation 0547+234 to 0601+245 was over this angular limit. Each pair was observed for an 8-minute scan, and then each of the five pairs had 8 such observations over each session. These data enabled accurate images and pair separations to be determined. After the second VERA session on 24 May 2008, an observing proposal was submitted to the VLBA in order to observe at somewhat higher resolution and at 43 GHz since the preliminary VERA results indicated the complex nature of the sources.
Six VLBA sessions (see Table 2 at 23 GHz and 43 GHz were scheduled between 20 Dec 2008 and 12 Dec 2009. For the most accurate phase referencing stability, a primary reference source that is observed every other scan was chosen. The source 0556+238 was chosen as the primary calibrator because it was the most compact (ratio of L/S from Table 1 was largest), and it was relatively strong. This permitted the monitoring of fast phase changes caused by the tropospheric refraction variations. The other sources were then alternated observed in turn with the primary phase calibrator. This observing/reduction scheme uses the primary reference source to determine the instrumental/atmospheric/astrometric errors in its direction and assumes that the same errors apply to the other sources (targets). The positional reference frame is also tied to the apriori position of the primary reference source.
The observing sequence used was 0556–0547–0556–0554–0556–0601–0556–0547…). Each scan was 18 sec in length, with 10 sec needed for source switching. The separation between the center of two 0556+238 scans was only 55 sec, sufficiently close in time to maintain phase coherence at 43 GHz except under adverse weather conditions or at very low elevations. The basic sequence took 3 min, and ten sequences were made over a 30 minute period. These 30-minute blocks were then alternated between 23 GHz and 43 GHz observing frequencies.
For 40 minutes near the middle of each VLBA session, 1-min scans at 23 GHz of strong ICRF2 sources over the sky were made in order to determine the residual tropospheric refraction model in addition to that used for the baseline correlator model. This observing technique is called “DELZN”, and is described by Reid et al (2009).
The final VLBA session on 31 Jan 2010 for one hour at 8.4 GHz, used the same scan cycle in order to obtain the relative source positions and structure at this lower frequency at the end of the monitoring period.
2.3 Data Correlation and A-priori Processing
The correlator models used for the VERA and VLBA observations used accurate locations for the antennas, up-to-date earth orientation (EOP) parameters, and initial tropospheric delay models. The positions listed in Table 1 are the assumed positions (phase center) for the sources for all sessions. These positions are merely the reference point from which offset positions are determined. They are often close to the location of the maximum intensity of the radio source.
For all VERA sessions, the correlated data were sampled every 2 sec, with 512 channels in one frequency band, covering at total bandwidth of 128 MHz, centered at 23.564 GHz. After flagging data associated with mal-functioning antennas or system temperatures in excess of 200K (the nominal operating system temperature of 100-120K increased significantly during periods of poor weather), the remaining data were then averaged to 6-sec intervals and 32 channels covering the 128 MHz bandwidth. No bandpass corrections in phase and amplitude were needed. Each of the five source pairs for each session were processed separately: 0547-0556(PR), 0554-0556(PR) 0601-0556(PR), 0547-0554(PR), 0601-0554(PR); where (PR) signifies the source that was used as the phase reference. The first three pairs contain all of the information about the relative source positions among the three sources with respect to 0556+238, and it is these data that were used in order to be directly comparable to the VLBA observing strategy. However, the observations for the last two pairs are independent, and provide an estimate of the errors associated with the source positions and structures.
For all VLBA 23 and 43 GHz sessions, the correlated data were sampled every 1 second, with a total bandwidth of 64 MHz (2-bit sampling; except for 20 and 22 Dec 2008 with 1-bit sampling) contained in four contiguous frequency bands, each with sixteen 1-MHz channels. The center frequencies were at 22.45 GHz and 43.41 GHz. At 23 GHz the amplitude and phase bandpass over the frequency range were determined from the observations of 0556+238, and data that were associated with mal-functioning antennas also were flagged. At 43 GHz, we inserted two observations of the strong ICRF2 source, 0851+202, in order to determine the bandpass amplitude and phase at this frequency. For the final VLBA session at 8 GHz of one hour, the same frequency and correlator configuration were used, and the average frequency was 8.64 GHz.
Updates of telescope positions, improved EOP, phase compensation for the parallactic angle changes over the session, and corrections from the monitored antenna electronic gain and phase variations were applied to the correlated data. For the VERA observations, the phase and delay difference between the dual-beams were measured using an internally-generated broad-band noise source, and these corrections were applied. The offsets are large, although relatively stable with time, and are critical corrections needed for precise phase referencing.
The estimates of the tropospheric delay for the VERA data were obtained from GPS measurements at each antenna. These are accurate to about 1cm, except at the more humid locations at Ogasawra and Ishigaki-jima (Honma, Tamura & Reid, 2008). In order to improve the tropospheric delay model used in the VLBA correlator, analysis of the DELZN observations, taken near the mid-point of each session, determined the zenith-path delay offset for each antenna (Reid et al, 2009). The frequency configuration consisted of four bands each with 16 1-MHz channels, centered at 23.02 23.57, 23.29 and 23.46 GHz. The antenna-based group delays were measured, and then the data for each antenna were fit to a linear clock delay and a zenith-path delay residual over the observation period of 40 minutes (Mioduszewski & Kogan, 2009). These results are not as accurate as the GPS-measured tropospheric delays, but decreased the systematic zenith-path delay model errors for each VLBA antennas from about 4 cm, to about 1 cm. At 43 GHz, zenith-path delay error of 1 cm for a source pair two degrees apart give a systematic phase error of at the zenith and at a source elevation of . When this error is averaged over all antennas, the systematic position shift from this uncertainty is estimated to be about 0.01 mas (reference to meeting in Socorro).
These data were then ready for phase-referencing calibrations.
3 Phase Reference Calibrations
3.1 The Primary Calibrator 0556+238
The choice of 0556+238 as the primary reference calibrator is discussed in § 2.2. Its ICRF history suggested that it is relatively stable over time, and was included as a defining sources in the ICRF2 catalog since its position varied by less than 0.3 mas in both alpha and delta at 8.6 GHz over several decades. Although of the emission is contained in a small, unresolved radio component, images of the source were made for each frequency and session in order to determine the small structure phase. The source peak brightness is assumed to be located at the position given in Table 1 at both frequencies and for all sessions, and this defines the relative position grid for the entire experiment.
It will turn out that the assumption—that the location of the peak intensity for this source is fixed over the year period of this experiment—is incorrect at the level of nearly 0.2 mas! This is significantly less than the image resolution, but the source position change with time was easily determined from the anomalous motions of the other sources.
3.2 VERA Phase Referencing
Since both phase calibrator and target are observed simultaneously with VERA observations, phase referencing requires the transferal of the measured antenna-based temporal phase and gain determined for the calibrator directly to the target. For each 8-min scan on a source pair, the AIPS task FRING determined the residual phase, and phase derivative with time (rate) and frequency (delay) for each one-minute interval during a scan (Greisen, 2003). An example of the delay solutions for the a VERA session is shown in Fig. 2. The delay values were slowly changing with time with an rms scatter over a seven-minute scan of about 1.0 nsec, caused in roughly equal amounts by the limited signal-to-noise over one minute and by fast changes in the tropospheric refraction. Over the bandwidth of 128 MHz, this delay scatter corresponds to a phase change of across the band, which causes a decorrelation of only about 4%. Delay solutions that were outside of the range or with significantly increased scatter were flagged. These data usually correspond to periods of poor weather conditions.
After the phase calibrations tables (delay, phase-rate and phase) were then applied to the phase calibrator, The AIPS task CALIB was then run on this data, using the input model of 0556+238, to determine the gain variations for each antenna. Variations of about 10 to 20% over the 6.5-hour session were typical. The phase calibration tables and the antenna-gain corrections found for the phase calibrator were then applied to the target source in order to obtain calibrated data. Since both sources were observed simultaneously, no temporal interpolation of the corrections found for the calibrators were needed to apply to the target.
3.3 VLBA Phase Referencing
From the “DELZN”40-min observations near the mid-point of each session (§ 2.3) the residual zenith-path delay offset and clock delay for each antenna were obtained. These corrections were applied to all data (23 and 43 GHz) for the session to remove the relatively large offset troposphere and clock delay error.
The VLBA phase referencing analysis, using the observations of 0556+238, were similar to those described above for the VERA session. These calibrations were done independently for 23 and 43 GHz. Because of the excellent stability of the VLBA and the relatively dry locations of most of the antennas, the AIPS task FRING determined only the delay and phase for each 20-sec scan of the calibrator. The delays were then smoothed over a time scale of one-hour to decrease the variations from the signal-to-noise.
The antenna-based phase variations for the calibrator over a session varied considerably, depending primarily on the weather conditions. Examples of these phase variations for several VLBA antennas at 43 GHz observations on 08 June 2009 over a three hour period are shown in Fig. 3. In order to maintain the necessary temporal phase coherence, the observed antenna-based phase must be accurately interpolated between adjacent 0556+238 scans, 55 seconds apart, in order to transfer them to the intervening target scans. In Fig. 3 periods of poor phase stability are obvious (SC 14:30 to 14:50, FD after 16:20, NL after 16:50), and the data for the targets during these periods were flagged. As with the VERA observations, these phase calibrations were applied to 0556+238 and then the average antenna-based gain calibrations were determined using the AIPS task CALIB. The delays, phase and gains from 0556+238 are then interpolated between scans in order to apply them to the target source. The target sources were now ready for imaging.
4 Radio Source Images
4.1 Imaging Techniques and Astrometry Analysis
Images for each source, frequency, and array were then made from the VERA and VLBA data. All image sizes were pixels, with a pixel separation of 0.01 mas. The data were weighted by the inverse-square of the antenna noise, and an additional weighting (called robust=0) of the data as a function of was data resolution emphasized the fine-scale structure without significant loss of signal-to-noise. The dirty images were cleaned using small boxes around the areas of known emission. Because of the substantial differences in the (u-v) coverage among the individual VLBA sessions and the VERA sessions due to flagged data or missing antennas, we used a conservative resolution for the restoring clean beam in order to produce images with the same resolution. The following resolutions (north/south by east/west Full-Width at Half-Power [FWHP] in mas) were adopted: for the VLBA at 23 GHz, the resolution was ; for the VLBA at 43 GHz, the resolutions was ; for the VLBA at 8.6 GHz the resolution was ; and for the VERA 23 GHz, the resolution was . Although many radio components in these diagrams appear to have an angular size that is similar to that of the beam, even a small broadening is indicative of internal structure, and both imaging and visibility model fitting can determine more precise component parameters and sizes (see § 6.2).
The target VLBA images (0547+234, 0554+242, 0601+245) are affected by phase noise introduced by the phase-referencing calibration interpolation errors between calibrator scans, that are implied in Fig. 3. The VERA observations are not affected by interpolation errors. Also, angular decorrelation (the tropospheric phase refraction between calibrator and target are somewhat different because of their separation in the sky) corrupts the target phases for both the VERA and VLBA observations. Unless these phase errors are larger than about one radian (all such data are flagged before images are made), the phase-referenced (PR) images for all sources are on the reference frame tied to the apriori position of the phase-reference calibrator to an accuracy that can be a good as 0.02 mas over a few degrees on the sky (Fomalont, 2005)
The image quality of the target sources can be improved using self-calibration techniques. By starting with the PR image as the estimate of the source structure and position, the self-calibration algorithm then determines improved antenna-based phases that are consistent with the PR image. The improved antenna-based phases are determined every one minute, and corrected visibility data are obtained. This technique is robust because it utilizes data from all baselines (45 maximum for the VLBA) in order to obtain antenna-based phase corrections (9 maximum for the VLBA). See Cornwell & Fomalont (1999) for more information about self-calibration and its stability.
The self-calibrated (SC) images have better quality than the original PR images. The peak brightness of the stronger components increase from a few percent to 20 percent because the corrected visibility data have smaller phase errors, and the extended emission and fainter components are somewhat better defined. The improved image quality aids in determining the angular size and frequency spectrum of various components in a source.
Tests from these VLBA and VERA observations (as well as from many other VLBI sessions) conclusively show that the self-calibration algorithm, when starting with the phase-referenced image, does not change significantly the position of the radio emission in the improved images. In Fig. 4, the PR-image and the SC-image are shown for 0547+234 at 43 GHz from the 08-Jun-2009 session. This example was chosen because the separation between 0556+238 and 0547+234 is the largest of the pairs, about two degrees, where residual phase errors can become as large as a radian at 43 GHz. For this particular example, the difference in the location of the peak brightness for PR and the SC image is 0.003 mas east/west and 0.015 mas north/south. The position difference of the secondary peak is 0.02 and 0.07 mas, well within the uncertainty of the location of this faint and blended component. For other source pairs and at 23 GHz frequencies, the differences between a PR and an SC image will be less than that shown in this example. Hence, in this paper, the position of all components and the image displays will be obtained from the self-calibrated data.
Several methods can be used to determine a “position” of a component from a clean image including: 1) Measure the location of its peak brightness. This position determination is resolution dependent, and is subject to the blending of close components. This uncertainty can be somewhat lessened if the same resolution is used for all sessions, even though this degrades the resolution for some of them. 2) Fit the emission on an image with a small number of Gaussian-components that are needed to describe the emission properties. Each component intensity, position and angular size, with error estimates, are then obtained. The angular size measured from the image can be deconvolved (since the images resolution is known) in order to obtain an estimate of the true sky angular size. 3) Fit the calibrated visibility data (self-calibrated) directly with a small number of Gaussian-components. The initial guess often comes from a clean image of the source. Such modeling of the visibility data directly, with no recourse to the image and its resolution limits, can often determine a component’s true angular size or more complex structure more accurately than by image fitting techniques.
Method (2) was used for most of the component and source analysis. When it is necessary to determine the internal structure of some of the compact components, method (3) was used in order to obtain as high a resolution as the data signal-to-noise would permit.
4.2 The Morphology of Each Source
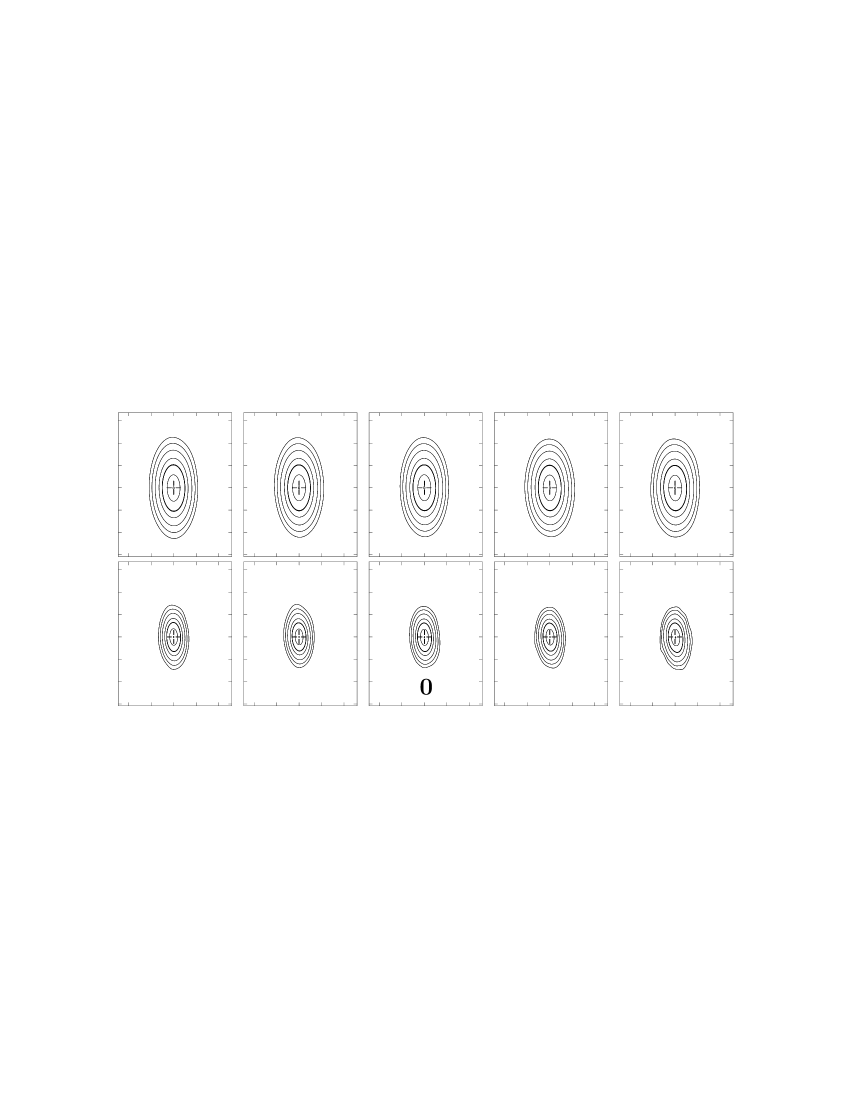
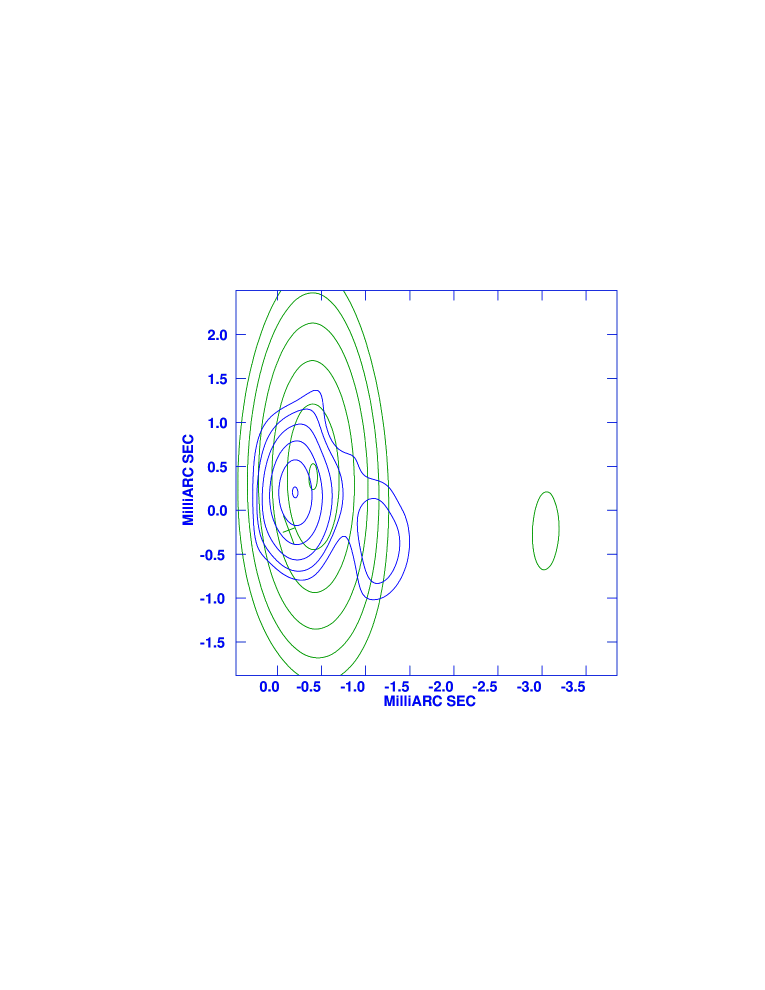
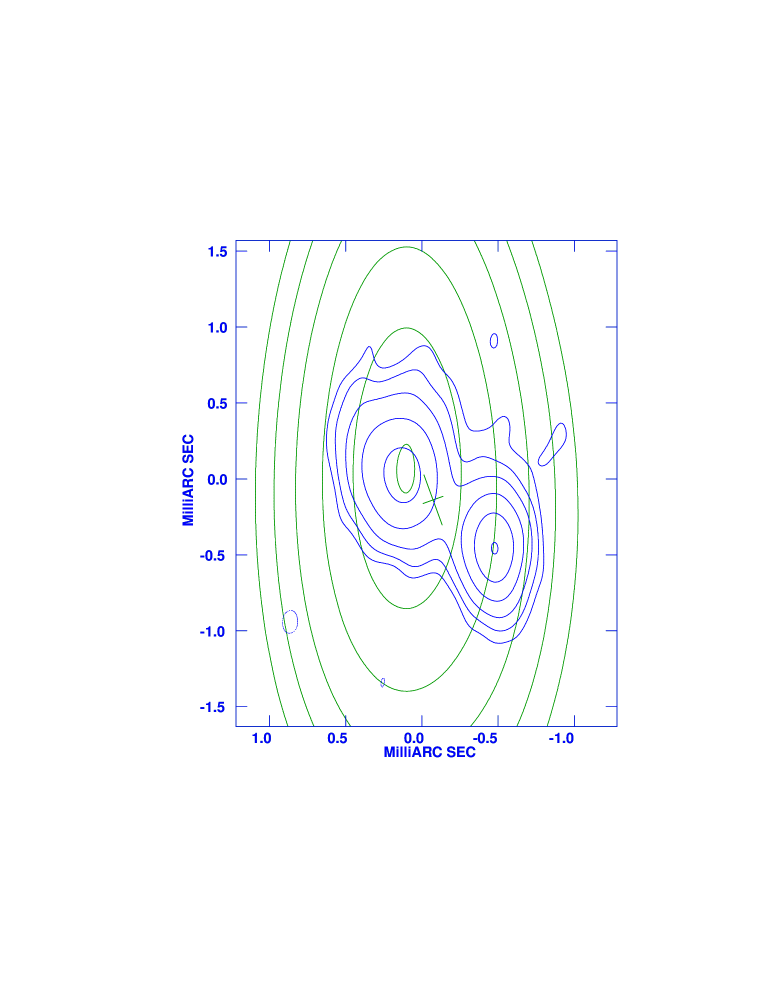
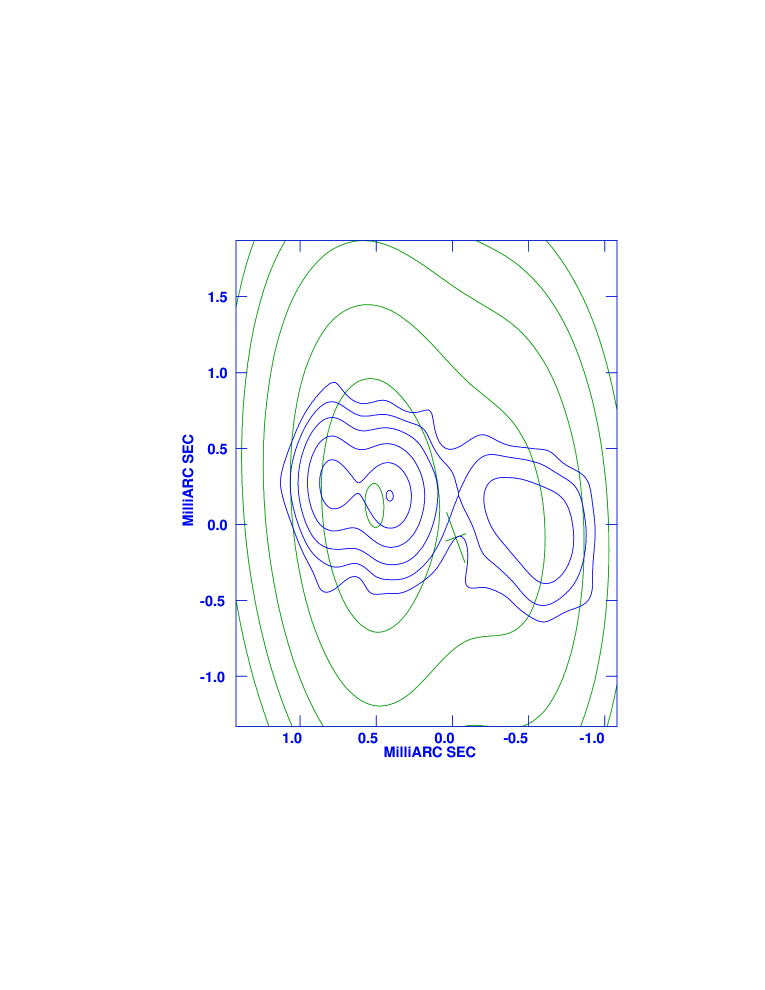
The VLBA images in the form of contour images at 23 GHz and 43 GHz for five sessions are given for the phase reference source, 0556+238, and the three target sources, 0547+234, 0554+242 and 0601+245 in Fig. 5, Fig. 6, Fig. 7, and Fig. 8, respectively. Although there are six VLBA observing sessions, the first contour plot on the left shows the average of the images for the 20-Dec-2008 and 22-Dec-2008 sessions111The intent of these first two sessions, only two days apart, were to determine the approximate positional accuracy that could be obtained from these observations. A lower sensitivity set-up was used and the 43 GHz data were not well-calibrated. Improvement in the observing strategy were then made for the subsequent VLBA sessions. The average of these two sessions are comparable in quality with the later sessions, so the results are included and are given the effective observing date of 21-Dec-2008.. All images have the identical contour levels as a percentage of the peak intensity. The quality of the images at 43 GHz on 12-Dec-2009 and 21-Dec-2008 (the average of two sessions) is somewhat degraded because of inclement weather at several antennas. This series of images show the good consistency of the VLBA images at both frequencies, and that none of the sources changed substantially over the year period. The components for each source have been given a number designation. The component ’0’ is thought to be the core, and will be discussed in detail in § 5.1.
The images and structure for 0556+238 have been discussed in § 3.1 in the decision to use this source as the main phase reference for the experiments. It is nearly a point source, although the last session at 43 GHz shows a slight extension to the south-west. Deeper imaging of this sources will show the surprising evolution of this source structure over the year observation in §6.2.
The source 0547+234 is dominated by a compact core, displaced about 0.5 mas north-west of the phase center, shown by the ’+’. A faint component about 1.0 mas to the west is somewhat variable and brightest on the 08-Jun-2009 session. The source 0554+242 has two components, clearly shown in the 43 GHz images. The phase center is located near the component to the north-east, but the south-west component appears more compact and is possibly the radio core. Finally, the source 0601+245 has a complex structure that is resolved into three major components at 43 GHz. The possible location of the radio core in this source is unclear with this level of display.
4.3 The Frequency Dependence and
VLBA/VERA Comparisons
Most of the analysis in the paper will be derived from the VLBA observations since these were the highest resolution and covered the frequency range from 8.6 GHz to 43 GHz. The most accurate VERA session was on 17-Jan-2009 when the weather at the four antennas was excellent. For the other VERA sessions one antenna was not available for a substantial part of the 6.5-hour observation, primarily because of inclement weather.
The comparison among the VLBA images at 8.6, 23 and 43 GHz with the VERA images at 23 GHz are shown in Fig. 9. The importance of high resolution is demonstrated in these comparisons. For example, the VERA and VLBA 23 GHz images show similar structures and position for the four sources, but some essential features of the source structure are more apparent with the better VLBA resolution, especially at 43 GHz. The VERA images, although not used heavily in the following analysis, were consistent in structure and position with the VLBA images, lending more confidence to the overall conclusions. The non-contemporaneous aspect of the images shown in this figure are not a complicating factor in their comparison because of the relative slow pace of evolution for the sources.
The VLBA resolution at 8.6 GHz, the same frequency used for the ICRF, barely hints at the inner structure of these four sources. Clearly, without the 43 GHz VLBA images at the highest resolution, interpretation of the source structure and evolution would be ambiguous—as will be documented in later sections.
5 Analysis of the Radio Source Structure and Evolution
5.1 Finding the Radio Core in each Source
The major goals of the observations of these four sources were 1) to determine the location of the radio core for each source, 2) to determine their position stability, and 3) to assess the affect of structure on the ICRF2 positions. Finding the core components for each of the four sources involved somewhat different combination of most of the following properties: (1) The most compact component with 0.3-mas resolution; (2) The component with the flattest spectral index; (3) The component at one end of the emission region; (4) The component that is stationary with respect to the radio cores in other sources. The use of these four criteria will become clear in the following discussions.
The four sources that have been chosen, although relatively compact, according to the ICRF2 catalog, have significantly different structural properties with sub-mas resolution imaging. The two sources that appear to be core-dominated are 0547+234 and 0556+238, which was used as the phase calibrator. On the other hand, the other two sources have sufficiently complex structure so that the location of the radio core within the emission is not obvious from the images in Fig. 7 and Fig. 8. The multi-frequency, multi-session observations of these two sources were needed to “find” their radio core.
5.2 The Structure and Evolution
of 0556+238
The source 0556+238 is nearly point-like at all frequencies and sessions, which is the main reason that it was used as the phase reference calibrator. The last session at 43 GHz shows a faint extension of the emission to the south-west. The VLBA images were fit to a single elliptical Gaussian component, labeled 0 in Fig. 5, and its parameters are listed in Table 3. Column 1 gives the session data and the next five columns give the component total flux density, peak flux density and the estimated error of the peak, and the offset of the component X (east) and Y (north) with error estimates, all at 43 GHz. The next five columns give the same intensity and position estimates at 23 GHz. The ratio of the total flux density to the peak flux density, slightly above unity, can be caused by the remaining small phase errors (decorrelation) or from a non-zero angular size of the component which corresponds to a full width at half-power diameter of about 0.2 mas. Over the experimental period of about one year, the flux density of the radio core increased 46% at 43 GHz and 18% at 23 GHz, with the spectral index, (where flux density ), changing from to .
5.3 The Structure and Evolution
of 0547+234
The source 0547+234 is dominated by a compact component toward the east. At 43 GHz, the source structure was fit with an elliptical Gaussian component for component 0 (clearly the radio core), and with a point component for component 1 (it is too weak for an angular size to be determined). At 23 GHz the bright component radio core and the fainter component 1 were each fit with point source. An additional component 2, located about 1.2 mas to the west, was added to the source model in order to fit the more extended emission that is seen in Fig. 6. The parameters associated with components 1 and 2 are relatively inaccurate since they are not particularly discrete features and appear to change quickly with time, but are included in the fit in order to remove any interaction of their parameters with that of the radio core. These parameters have not been included Table 4. Observations of the source at 23 GHz in Aug 2005 show a similar structure with a dominant core and a faint component about 1 mas to the east (Charlot et al, 2010).
The parameters for the radio core for the five VLBA sessions at 43 GHz and 23 GHz are shown in Table 4, with the same format as that for Table 3. The component 0 flux density reaches a minimum for the 08-Jun-2009 session at both 43 and 23 GHz, when components 1 and 2 are near their maximum, about 15% of the flux density of the radio core, and the component spectral index is about -0.6. It is offset from the phase center by about X=-0.18 and Y=+0.21 mas. The most surprising property of component 0 is its proper motion to the south at 23 GHz and 43 GHz, approximately mas/yr.! Slight motion to the west may also occur. The cause of this apparent motion is discussed below.
5.4 The Structure and Evolution
of 0554+242
The contour plots of 0554+242 in Fig. 7 show two major components. The emission was fit with a two-component elliptical Gaussian model for all sessions and at 43 and 23 GHz, and the parameters are shown in Table 5. Component 0 is only slightly resolved since the total to peak flux density is about 1.1, corresponding to an angular size mas. There is no significant variability over the year experiment. The X-position of this component shows a small motion to the west, but, as with 0547+234, this component is moving to the south by about 0.09 mas over the year.
Component 1 is clearly extended with the total flux density to peak flux density ratio about 1.9 at 43 GHz and 1.3 at 23 GHz. This ratio corresponds to an angular size of about 0.8 mas at both frequencies. The spectral index of the two components are significantly different. For component 0, ; for component 1, . It is, thus, extremely likely that the radio core of 0554+242 is component 0 because it is more compact and has a flatter spectrum than component 1.
The relative proper motion between the two components (component 1 - component 0 is mas/yr and mas/yr, or mas/yr in position angle ; but it is only marginally detected. The component separation in June 2009 is 0.782 mas in position angle which is fortuitously in the same direction as the possible motion. Observations at 23 GHz with the VLBA in 2005 August show a separation of the two components of 0.75 mas in position angle with flux densities 0.29 (NE) and 0.10 (SW-core) (Charlot et al, 2010). Earlier observations at 8.6 GHz from the 1990’s also suggest a similar separation of two major components. Thus, the two components are barely if at all separating, with an ejection time that was at least 20 years in the past.
5.5 The Structure and Evolution of
0601+245
The 43 GHz images of 0601+245 suggest that the source is composed of three major components. There are two close components in the eastern part of the source and an extended component to the west (see Fig. 8). The location of a radio core, perhaps corresponding to one of these components, cannot be easily deduced from this display without deeper analysis.
Table 6 lists the parameters for the three components. The two components to the east were modeled as point sources (when two components overlap, determination of their individual angular sizes is not reliable), but the western component was fit to an elliptical Gaussian component, and it is clearly extended. The component flux densities are relatively stable at 43 GHz, but appear to be slowly decreasing at 23 GHz. Component 0 has the flattest spectral index with with , component 1 has a steep index of , and the western, extended component 2 has .
Component 0 shows a similar proper motion as the radio cores in 0547+234 and 0554+242 with mas/yr, mas/yr. Again, this anomalous proper motion is discussed in the next sections. This component is likely the radio core since it also has the flattest spectral index, is compact, and is at one end of the radio emission.
Component 2 is moving with mas/yr, mas/yr, or mas/yr in position angle . The separation of component 2 from 0 is , , 1.253 mas in position angle , which extrapolates to an ejection time of component 2 from component 0 about 6.5 years ago. Observations at 23 GHz with the VLBA in 2005 August shows the presence of only one component, which is consistent with these measurements (Charlot et al, 2010).
The motion of component 1 away from 0 is mas/yr, mas/yr, and is formally not detected. Although the separation is in the sense that component 1 is moving away from 0, the blending of the two components, even at 43 GHz, makes determining their separation uncertain.
6 Anomalous Position Behavior
for 0556+238
6.1 Consistency of Target Core Apparent Proper Motions
The radio cores in 0547+234, 0554+242 and 0601+245 have been tentatively identified. For 0547+234 this association was straight-forward since the emission is dominated by a single component. For 0554+242 and 0601+245 the 23 GHz and 43 GHz high resolution images were both needed to determine the core location: it was the most compact component, and with the flattest spectral index. What is surprising is that cores in the three target sources have nearly the same proper motion, mainly to the south!
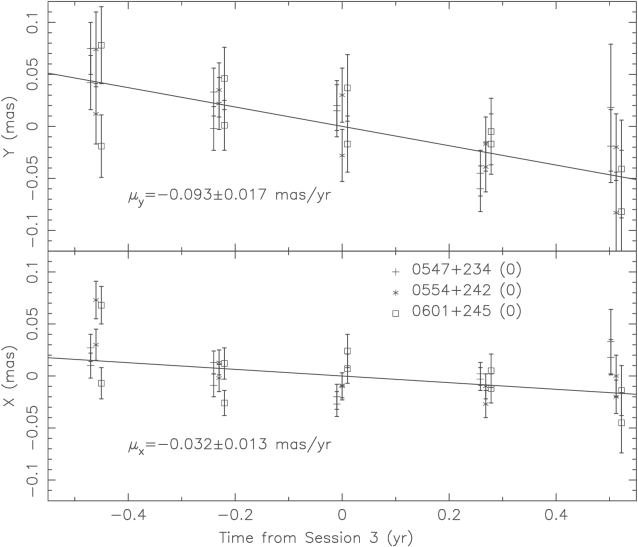
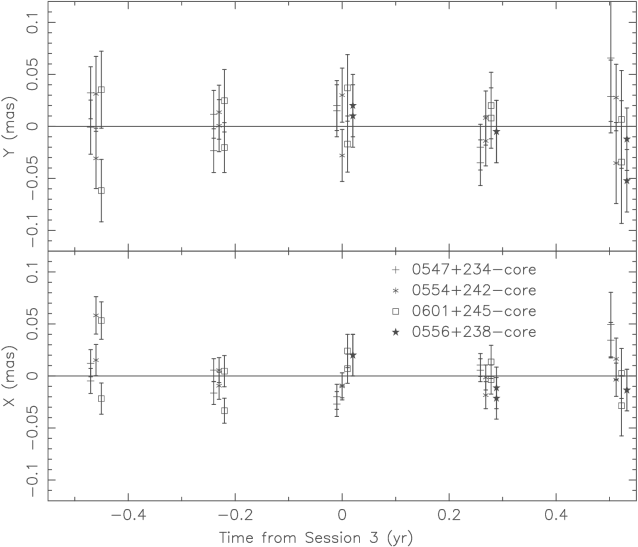
To investigate these proper motions in more detail, the positions measured for the core components from Tables 4,5 and 6 are plotted in Fig. 10. Both the 43 GHz and 23 GHz core positions were used, although there could be a small separation between them, but this should not bias the proper motion fit. The relative offset of the cores from their phase center has been removed, so the motions of the three sources could be overlapped. These core offsets were: 0547+234 (X=-0.171, Y=+0.194) mas; 0554+242 (X=-0.454, Y=-0.429) mas; 0601+245 (X=+0.772, Y=+0.270) mas. The first session and the last session points show larger scatter than the middle three sessions, as suggested from the contour plots for these two sessions in Fig. 5-8.
The proper motion fit to the core positions of the three target sources are mas/yr, mas/yr, and all three cores are consistent with this motion. Thus, the relative separation among them remained constant to the measurement error of about 0.02 mas, as indicated by the scatter of the points around the best fit proper motion line in Fig. 10. The similar core motion for the three target sources strongly implies that the emission peak of 0556+238, which defines the location of its apriori position, is moving with respect to the other three cores. In the next section, super-resolution imaging and modeling of the emission from 0556+238, will show how internal changes in this source structure have mimicked a proper motion during the experimental period.
6.2 Super-resolution Imaging of 0556+238
Although 0556+238 is nearly a point source with the nominal resolutions at 23 GHz and 43 GHz, the source intensity does vary significantly, with a change in spectral index, over the year experiment. Hence, there is some indication of internal changes, even within the resolution of the 43 GHz observations. The source has been well-observed for decades in the ICRF-programs with little indication of extended structure. The derived positions from the hundreds of ICRF experiments are stable at the 0.2 mas level, although this is the typical position error for any one ICRF session. It has a structure index of 1, meaning that it has no significant structure outside of the core. It is one of the 295 ICRF2 sources used to define the celestial reference frame.
Errors in the data processing and analysis that could produce the apparent motion of 0556+238 are unlikely. Unexpected astrometric and tropospheric errors should produce errors that are functions of the calibrator target separation-and orientation, rather than a constant offset for all targets. An error in the data processing and the correlator model in which an anomalous proper motion was inserted in the position of 0556+238 over the year experiment has not occurred.
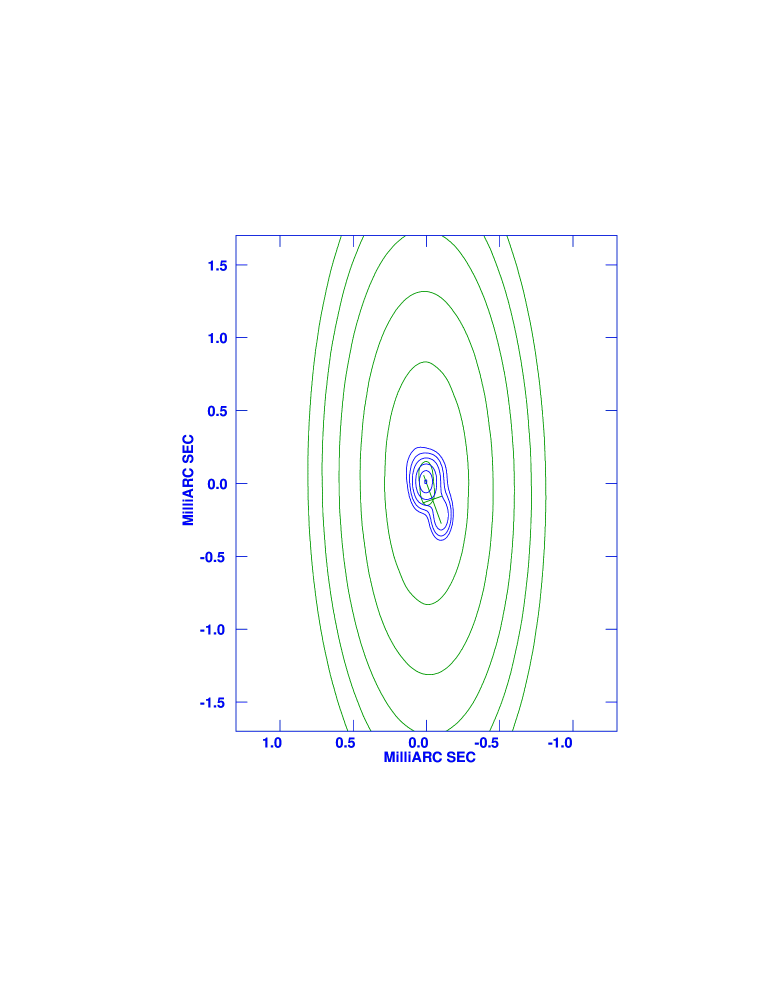
The 43 GHz and 23 GHz data for 0556+238, after editing and self-calibration in AIPS, were transferred to the Caltech interferometric package, Difmap (Person et al, 1994). The visibility data were then fit with one or two Gaussian components. For the first two sessions when the source was small in angular size, only one extended Gaussian was fit; but for the three final sessions, when the source became more extended, a double point model was used. These parameters are shown in Table 7 and the images, with a restoring beam of mas at both frequencies, are displayed in Fig. 11. This resolution is about a factor of 2 smaller than the conservative one used for previous image display at 43 GHz and a factor of 3 at 23 GHz in Fig. 5.
The NE component is the brighter than the SW component by a factor of three at 43 GHz and five at 23 GHz, with the spectral index of the NE and SW components and , respectively. At both frequencies the total flux density of the source at both frequencies increased by about 50% from Dec 2008 to Dec 2009. The ’+’ in the contour images of 0556+238 in Fig. 11 shows the location of the assumed apriori position for the source. The location is determined by the self-calibration algorithm and is usually within 0.005 mas of the peak brightness. Since the NE component is much brighter than the SW component, the apriori phase center is virtually coincident with the NE component.
The source contains two components that are moving apart. From the model fits the component separations are 0.15, 0.19, 0.24 mas for the June, Sep and Dec 2009 sessions, with good agreement between the 23 and the 43 GHz results. Using the ratio of peak to integrated flux densities for the first two sessions as a measure of the separation of the two components, we obtain about 0.10 mas for both sessions. Thus, to the accuracy of these fits, the proper motion between the two components is about mas/yr in position angle . For comparison, the average proper motion of the three cores in the target sources (See Fig. 10) is mas/yr in position angle . If these three cores are assumed to be stationary in the sky, then a stationary point in the images for 0556+238 over the sessions is shown by the ’box’. It is clear that the SW component is not moving significantly with respect to the other three target radio cores.
The conclusion is that the south-west component is the stationary radio core of 0556+238. The brighter component is a new jet component, moving to the north-north east with a proper motion of about 0.12 mas/yr. It appears fortuitous that this motion is quasi-linear because the first session occurred somewhat after the jet ejection, and the jet component velocity has remained relatively constant over the year period, a typical behavior of many jet components just after their formation (Lister et al, 2009).
6.3 Super-resolution Imaging of Other Sources
The visibility data were also analyzed for the other sources, using similar super-resolution techniques that were described above. The cores for the three target sources were compact for all of the sessions, and were sufficiently far from the additional extended emission, so that their position could be unambiguously determined to an accuracy of 0.02 mas. The unusual circumstances affecting the interpretation of the structure of 0556+238—the ejection of a new component from the core during the experiment period, and the intensity of this component significantly greater than that of the core—did not occur for the other three sources.
7 Comparison with the ICRF2 and the 8.6 GHz Positions
The Jan 2010 VLBA session observed the four sources in phase-reference mode at 8.6 GHz for two main reasons: First, to obtain the 8.6 GHz structures and positions that are relatively co-temporaneous to the 23 and 43 GHz images in Dec 2009, so that time variability is not a serious problem for their comparison. Second, to assess the ICRF2 positions with the detailed structure information obtained for the four sources.
7.1 ICRF2 Registration of Images using 0556+238
An overlay of 0556+238 of the 43-GHz image in Dec 2009 and the 8.6-GHz in Jan 2010 image is shown in Fig. 12. The observations were taken 45 days apart, so the slight variability or motion in the source should not be a contributing factor in the image differences.
However, the 43 GHz and 8.6 GHz grid frames could be displaced. This is unlikely because the assumed phase center (same for all three frequencies) is virtually located at the position of the peak brightness, and the NE component is much brighter than the SW component at 8.6, 23 and 43 GHz. Thus, the Dec 2009 23 and 43 GHz images and Jan 2010 8.6 GHz images are on the same reference grid to better than 0.1 mas. This means that the comparison of the 8.6 GHz and 43 GHz images for the other sources will also be accurately registered since these are all tied to that of 0556+238, the phase reference calibrator.
7.2 Where is the ICRF2 Position of 0556+238?
The ICRF2 position of 0556+238, one of the 295 sources that are used to define the ICRF quasi-inertial reference frame, is with an estimated error of 0.04 mas in both coordinates. This improved position is 0.026 mas east and 0.068 mas north of the assumed phase center (see Table 1), that was taken from the previous ICRF catalog, and the ICRF2 position is 0.07 mas displaced in the same direction as that between the NE and SW components!
An estimate of the evolution of the structure of this source structure can be made from VLBA observations at 23 and 43 GHz in Dec 2002, Sep 2003 and from 23 GHz and 8.6 GHz from Aug 2005 (Lanyi et al, 2010; Charlot et al, 2010). Over-resolved images of the source for these observations show two components that were separated between 0.1 and 0.3 mas in a position angle roughly . The relative flux density between the two components was not fixed, but the southern component had a flatter spectral index in two of the three experiments, which supports the contention that the radio core is indeed the south-west component. The time-scale of the formation and motion this jet component cannot be ascertained.
The location of the ICRF2 position of 0556+238 could lie anywhere between the NE and SW components, although at 8.6 GHz, the NE component is probably the stronger of the two components and the ICRF2 position may favor this position. The error cross in Fig. 12 is a conservative estimate of the range of the location of the ICRF2 position in Dec 2009 to Jan 2010. This error box will be transferred to the target sources in order to compare their 23 and 43 GHz images with the 8.6 GHz images and with the ICRF2 position.
7.3 0547+234 at 8.6 GHz
A comparison of the 23 GHz Jun 2009 and and 8.6 GHz Jan 2010 VLBA images is given in Fig. 13. The June 2010 session at 23 GHz was used since it shows best the extended emission to the west. (The motion of the radio core between June and Dec 2009 was less than 0.1 mas which does not affect the registration of the two images.) Two anomalies are apparent. First the ICRF2 position is significantly south of the peak emission at all frequencies. This source has been observed in only about 23 ICRF sessions over the years, and the formal ICRF2 position error is 0.3 mas. Hence, the offset of the ICRF2 position could be consistent with the images.
The second anomaly, the displacement of the peak brightness at 8.6 GHz and 43 GHz (and all of the high-frequency images), is significant. As seen in Fig. 6, the faint emission to the west comes and goes over 2009, at both 23 and 43 GHz. A radio image at 8.6 GHz in Aug 2005 shows even more extended structure to the west of the peak (http://rorf.usno.navy.mil/RRFID/) than that in Jan 2010. An explanation for this discrepancy is that there is significant diffuse and variable radio emission emanating north and west of the radio core. This emission may be optically thick within 1 mas of the core and, is thus, barely detected at 23 and 43 GHz. Thus, the change of position of the core between 43 GHz and 23 GHz may be the so-called frequency dependent core-shifts, see for some other radio sources (Kovalev et al, 2009), which is typically about 0.2 mas between 23 GHz and 8.6 GHz. This is the only one of the four sources which has extended emission near the radio core. Nearly all of the emission in the other three sources are confined to discrete components and such core-shifts are not apparent.
7.4 0554+242 at 8.6 GHz
A comparison of the 43 GHz Dec 2009 and and 8.6 GHz Jan 2010 VLBA images is given in Fig. 14. The 8.6 GHz image, which shows a slight asymmetry to the west, can be modeled with two Gaussian components that nearly coincide with the 43 GHz component positions. The NE component at 8.6 GHz contains 0.73 Jy, compared with 0.10 and 0.24 Jy at 43 and 23 GHz, respectively. The SW component at 8.6 GHz contains 0.13 Jy, compared with 0.07 and 0.13 Jy at 43 and 23 GHz, respectively. Hence the steep spectrum of the NE component and the flat spectrum of the SW component are supported by the 8.6 GHz model. Thus, the position (peak brightness) of the radio source in Jan 2010 is the NE component which is now 0.8 mas north east of the core.
The ICRF2 position of 0554+242 is located between the two components, although somewhat closer to the NE component, but is still 0.6 mas from the core position. Although no significant motion between the two components has been detected over the last ten years, the present ICRF2 position (generated from more than 20 years of data) is consistent with earlier periods when the NE component may have been closer to the core, or reflects on the different intensity ratios between the two components.
7.5 0601+245 at 8.6 GHz
A comparison of the 43 GHz Dec 2009 and and 8.6 GHz Jan 2010 VLBA images is given in Fig. 15. The source structure is complicated, but analysis of the 23 and 43 GHz images suggests that the radio core is associated with the component at the eastern part of the emission. The peak of the 8.6 GHz image (hence its position) is near the middle component which has a relatively steep spectral index and would dominate the emission at the lower frequency. The western component can be see in the 8.6 GHz image.
The ICRF2 position is displaced significantly to the east, more than 1.0 mas from the radio core, and about 0.6 mas east of the present 8.6 GHz position. The western component that has a proper motion of about 0.19 mas/yr which extrapolates to a lifetime of about 6 years if the motion has remained the same. There are few good quality observations of this source over the last five years at 8.6 GHz; however, if this western jet component was stronger in the past, the ICRF2 position would then have been dominated by this moving component.
8 Discussion
The four ICRF2 sources chosen in this study appeared relatively simple from the 8.6 GHz ICRF monitoring over several decades. Their emission was dominated by a compact component and the position error estimates ranged from 0.05 to 0.15 mas. The observations at 23 and 43 GHz, reported here, show that the situation is much more complicated, even for these high-quality ICRF2 sources.
Although this high resolution, accurate astrometric, multi-frequency, multi-epoch set of observations covered only four sources, some general conclusions about the accuracy of the 8.6 GHz ICRF and the properties of radio cores can be inferred.
8.1 An Evaluation of the ICRF 8.6 GHz Positions and Structures
A comparison of the ICRF 8.6 GHz positions and images with those obtained with the present observations for each of the sources can be summarized as follows:
-
0556+238: The structure and evolution of this source, one of the 295 defining objects of the ICRF2, is not simple even though over 90% of the emission is contained with an angular size of 0.5 mas. Many years of observations show virtually no extended emission at 8.6 GHz and perhaps a slight extension at 2.3 GHz to the north and west (http://rorf.usno.navy.mil/RRFID/). During the course of this experiment, however, a strong jet component moved from 0.1 to 0.2 mas from the weaker, but optically thick, radio core. Since the source was used as the phase reference calibrator, it produced initially what were anomalous properties of the three target sources: their radio cores were moving in the sky!. This type of structure variation within a region of 0.3 mas for this source was corroborated by analyzing several other experiments over the last seven years. A lesson learned from the results of this source, is that structure changes of angular scale 20% of the resolution can occur, and are particularly injurious in determining accurate radio positions.
-
0547+234: This source contains about 80% of its emission in a compact component between 8.6 and 43 GHz. However, the position at 8.6 GHz lies about 0.3 mas of the radio core at 23 and 43 GHz. The faint emission, observed at all frequencies toward the west of the core, may be a diffuse component that becomes progressively optically thick at lower frequencies. Unlike the other three sources, this extended emission is not confined to well-defined components, but is more ephemeral in time and space. This radio core separation between the 8.6 GHz and 43 GHz frequencies is similar to that seen for other radio cores (Kovalev et al, 2009). However, the other three radio sources contain most of their emission in well-confined components and similar core shifts associated with an optically thick diffuse emission extending from the core do not occur.
-
0554+242: The source structure is relatively simple from the 23 GHz and 43 GHz observations, containing a compact, radio core to the south-west and a (possibly) slow moving jet component to the north-east. The present 8.6 GHz location coincident with the jet component since it is the brighter component at 8.6 GHz. Thus, the present position is displaced currently (Jan 2010) about 0.8 mas from the core. The cataloged ICRF2 position (based on 10 to 15 year average position ) is located somewhat closer to the radio core for two possible reasons: The NE components was closer to the core 15 years ago, and/or the flux density of the radio core was more dominant.
-
0601+245: The source is relatively large and complex, and even the 8.6 GHz-images show an extension to the west. Only with the 43 GHz VLBA observations could the radio core be identified as the most eastern component of the three. The present 8.6 GHz position is dominated by the bright, steep-spectrum component that is about 0.5 mas west of the core. The ICRF2 positions is further displaced by 0.7 mas to the west. Unfortunately, there are no previous observations for which an accurate structure at 8.6 GHz be obtained. It is suggested that the western component, which is moving 0.2 mas to the west, was much brighter ten years ago and this component influenced the ICRF2 position much more than presently.
Several conclusions from the study of the four sources are: First, the position of the source at 8.6 GHz (whether from the VLBA Jan 2010 observation or the ICRF2) for these relatively compact sources is displaced 0.2 to 1.0 mas from the radio core. The displacement is usually in the direction of the more extended structure. Thus, the 8.6 GHz radio positions, often with an estimated error of mas, will often not include the position of the radio core. The offset may be caused by the optical depth affect of a relatively smooth jet connected with the radio core (0547+234 may be an example) and is usually designated as a core-shift. However, for the other three sources, the 8.6 GHz position is influenced by the strong emission from a discrete component that is not the radio core.
Second, the components that are associated with the 8.6 GHz positions may move away from the core, and hence the 8.6 GHz positions also change with time. This change was noted for two of the sources where the 8.6 GHz positions measured in Jan 2010 significantly differ from those of the ICRF2 that are average positions for a source over the last 10 to 15 years. Similar changes (small linear motions) in the position of ICRF sources have been observed for many ICRF2 sources over the decades of monitoring (Feissel-Vernier, M., 2003), and the present observations suggest that such position changes are structure-induced, rather than intrinsic to the radio source (i.e. radio core) position.
8.2 Identifying the Radio Cores
From analysis of 43 and 23 GHz VLBA phase-referenced images of four source observed over a year, the location of their radio cores have been ascertained. The core component for each of the four sources had some or all of the following properties: the following properties: (1) The most compact component with 0.3-mas resolution; (2) The component with the flattest spectral index; (3) The component at one end of the emission region; (4) The component that is stationary with respect to the radio cores in other sources.
These criteria could be evaluated by observing the sources in the following way:
-
43 GHz Resolution of 0.3 mas: The long VLBA baselines at 43 GHz were crucial in resolving and determining the radio cores. The resolution of 0.3 mas is needed to separate close components or to resolve out the inner jet. For two of the sources the VLBA resolution at 23 GHz was not sufficient. A second reason for observing at 43 GHz is that the emission, even from the core region of most AGN’s, is becoming optically thin (Lanyi et al, 2010; Charlot et al, 2010). Thus, at 43 GHz little emission is expected to be contained in opaque components that produce structure changes with frequency. This is supported by the spectral index of -0.7 for several of the radio cores, although a few had flat spectral indices.
-
23 GHz Observations: A second observing frequency is needed to determine the spectral index of each component, as well as producing more accurate images than at 43 GHz (better SNR and less tropospheric contamination), albeit with less resolution. The two frequencies should not be separated by more than a factor of two in frequency in order to lessen resolution effects in the determination of the component spectral index and position. The spectrum of a component is one of the indicators of radio core or non-radio core emission. The cores have a spectral index while the other components tend to have steeper spectra.
-
Multiple Session: Multiple sessions, separated by months to a few years, are needed to determine which components have significant motion. This clearly aids in the interpretation of the source structure and can be used among several sources in order to determine which components in several sources are mutually stationary.
-
Phase Referencing: The most accurate method to determine the relative positions between different sources to about 0.02 mas (e/w) and 0.03 mas (n/s) is with the phase referencing. The gain in positional accuracy is because the large tropospheric delay variations cancel among closely-space sources. Unfortunately, phase referencing cannot be used for sources more than several degrees apart because of the tropospheric refraction that varies linearly with source-pair separation. Group-delay referencing can be done over a much larger region of the sky, but the positional accuracy over a session is likely to be about 0.1 to 0.2 mas, limited by the large-scale tropospheric refraction. As described above, the combination of high resolution and the ability to measure the relative position of components that were in different sources several degrees apart was crucial in finding which of the components in the four sources had separations that were stable to the 0.02 mas level. This was strong evidence that they were stationary in the sky since there is little reason for the components in four independent sources to be precisely co-moving.
8.3 Radio Core Stability
The measured radio core position stability for the four sources is illustrated in Fig. 16. The plot contains the data points from Fig. 10, after removing the proper motion of the reference grid caused by the motion of the strong jet component in 0556+238. The data for the SW-component of 0556+238 from Table 7, when blending with the jet component was minimal, was also included. The rms scatter among the sessions and the sources is dominated by the tropospheric refraction residuals of about 4 psec (0.02 mas). The scatter for the first session (20Dec2008 + 22Dec2008 sessions combined) and the last session is some larger than the middle three sessions because of lower sensitivity observations in Dec 2008 and unusually poor weather at many VLBA locations in Dec 2009. The normalized is 0.7 and 1.6 for the n/s and e/s offsets, suggesting that the n/s estimated errors are a factor 0.8 too high and the e/w estimated errors are a factor 1.3 too low.
There is no significant relative motion for any of the radio cores, and the rms scatter per point (one radio core for one session) is about 0.02 mas e/w and 0.03 mas n/s. These sources are separated by an average of , so a position stability of 0.02 mas of about one part in was achieved.
Radio cores are believed to be located at the base of the jet which may be about 2 au from the massive object and accretion disk near the nucleus of the galaxy. This separation is about 0.003 mas for the four sources, assuming a redshift of 1.0. Whether the radio core position (and the jet base position) are functions of time is not known, and one of the goals of these observations are to determine such changes over time. At present, the radio cores appear stable to about 0.02 mas over one year. Clearly, further observations of these four sources are needed to determine the longer term stability of radio cores. Phase referencing of other sets of sources are also needed to enlarge the sample of ICRF sources in which the location of the radio core is known with some assurance.
8.4 The Source Structure Effect On the ICRF
The ICRF has determined the position of several hundred sources from the location of the emission peak associated with compact radio sources at 8.6 GHz. The comparison of detailed observations of four sources at higher resolution and frequency than that of the ICRF showed that the positions are often displaced up to 0.5 mas from the radio core, and could vary in position by 0.3 mas/yr. The ubiquity of these changes, determined from only four sources, cannot be securely extrapolated to the defining sources in the ICRF2 catalog as a whole, but these four sources were among the most compact and brightest of the ICRF source list. However, the ICRF2 grid averages the foibles of each of the 295 sources, so that the average offset or motion to the inertial grid is decreased by about 15 from any average source anomaly. This suggests a stability of 0.02 mas/yr in the orientation of the grid, and a possible displacement of 0.03 mas in the absolute position of the grid should be obtained even if the position of many of the sources are displaced from the radio core in a similar manner to the four sources studied here. Hence, the cumulative effect of source structure induced changes in the ICRF2 grid are comparable to the errors suggested from the residual tropospheric refraction residuals that affect the current best modeling of the radio source positions and other related astrometric/geodetic parameters.
When dealing with individual sources, the estimated errors associated with the ICRF2 positions are determined from the scatter of many 24-hour session position determinations over several decades. Some of the scatter are caused by VLBI network problems and troposphere modeling errors and tend to be random over periods of months to years. On the other hand, the apparent position offset of the ICRF2 position and the radio core, as suggested in this paper, are generally biased in the direction toward the inner jet which is remains at the same orientation with the core over many years for most radio sources. Thus, the estimated ICRF position errors reflect the more random changes and can be as small as 0.04 mas for sources that have many observations. Thus, the offset between the apparent 8.6 GHz position and the radio core has a systemic component so the offset can be significantly larger than the estimate position error. (Feissel-Vernier, M., 2003).
In order to resolve the radio core and to understand the evolution of an individual radio source, higher frequency observations are needed to avoid the regions of high optical depth at 8.6 GHz which hide the location of the true core, and sufficiently high resolution to resolve and recognize the radio core from other components. Hence, imaging the sources in the ICRF2 defining list at 43 GHz (even without phase referencing) is recommended in order to determine the internal structure and changes that are often hidden with the 8.6 GHz observations because of limited resolution and optical depth effects. These observations would also aid in weeded out some of the 295 defining sources which have the largest position instability.
8.5 An ICRF at 23 or 43 GHz
Phase referencing techniques can determine the accurate structure and relative position of sources, but only over a small angular region of several degrees. Hence, its extension to the entire sky would take a long period of time and the coupling of phase referencing results over a few degrees into a whole sky reference frame would probably add zonal systematic errors that would be hard to remove.
Recently, observations to determine an all-sky catalog at 23 and 43 GHz were initiated. Part of the motivation was to establish a catalog of source positions for future spacecraft tracking (at 33 GHz), and part was to determine if improved accuracy could be obtained at 33 GHz compared with 8.6 GHz. The results are given in (Lanyi et al, 2010; Charlot et al, 2010), with most of the observations were made at 23 GHz. The basic observable was the group delay, and similar reduction and analysis techniques, as that for the ICRF, were used.
Although images were made for each source for the twelve observing sessions, they were not analyzed as completely as those in this paper. Many sources were dominated by a strong compact component with the source position given as the peak location of this component. However, some of these components could be resolved into sub-components, one of which might be the radio core that could be displaced more than 0.1 mas from the cataloged position. Nevertheless, these results strongly suggest that observations at 23 and/or 43 GHz will likely produce images for which a radio core can be identified. The analysis of the group delay can then be modified to remove the structure effects and determine the position for the radio core component and not simply the position of the maximum emission. However, until the tropospheric modeling can be significantly improved, it will be the main limitation to positions derived at 32 GHz for any single session, and with somewhat minimal gains even with incorporating the imaging information.
8.6 VLBI2010
The project VLBI2010 (Niell et al, 2010) is the next generation radio array that will be used primarily to determine the celestial and terrestrial reference frames significantly more accurately than the present frame. Two improvements in observing technique will be used: First, the telescopes in the array will be small so that they can slew over large areas of sky very quickly. This will permit a more accurate determination of the tropospheric refraction model over the sky more quickly and with more angular dependence. Since the troposphere is the major limitation to the present ICRF, this alone will produce a significant gain in accuracy, perhaps by a factor of two.
The second improvement will be to observe in a continuous band from 2.5 to 15 GHz and with sufficient SNR in order to convert the measured group delays into unambiguous phase delays. Because of the significant ionospheric refraction component and the changing structure and resolution of the sources with frequency, the fitting of the phase delays from these multi-frequency observations will be complicated. In other words, the basic observable, the delay (linear phase slope with frequency) will be contaminated by the ionosphere delay (phase versus inverse frequency) and the frequency-dependent source structure phase. This phase change will consist of the apparent shifting of the source position with frequency as well as changes of its internal structure. Because the highest planned observing frequency is 15 GHz, it is likely that there will not sufficient resolution to resolve the radio core within the observed structure. The multi-frequency images may help to determine which part of the source has the flattest spectral index which could possible identify the radio core.
It is recommended, as it is with the current 8.6 GHz ICRF, that occasional observations with the VLBA be made at 43 GHz in order to assess the radio structure at the level of 0.2 mas to better determine the true position of the radio core. Another choice may be the VERA+KVN array, with seven 20-m telescopes, that will begin operation at 43 GHz by 2012. The use of the EVN is somewhat limited in its 43-GHz capabilities at the present
8.7 The Future of the ICRF
The ICRF as defined by the ICRF-Ext2 (Fey et al, 2004), and improved with the ICRF2 (Fey et al, 2010), is the realization of the International Reference System using extragalactic sources (quasars) to establish a quasi-inertial grid at radio wavelengths. This is the primary frame to which the positions of all celestial objects are referenced. The 295 objects which define the ICRF2 system are somewhat sparsely distributed over the sky. Since these objects are typically fainter than 16-mag, the primary optical catalog, Hipparcos, is referenced to the radio frame through a few bright quasars and secondarily with fainter radio stars that are accurately tied to the ICRF-grid (Lestrade et al, 1998). The gaia mission will measure the positions of starts as faint at 20-mag visual magnitude and will detect over 100,000 quasars in order to produce a large quasar reference frame (LQRF) (Andrei et al, 2009).
Gaia is a scanning instrument that will use quasars to determine the parallax zero point, the frame spin, and the ICRF frame tie. It is estimated that the mission accuracy will be better than 0.025 mas for stars brighter than 16-mag in the visual, but decreasing to 0.2 mas for 20-mag objects. With the large number of quasars, Gaia’s measurement should define the inertial reference frame axes to 0.0001 to 0.001 mas. Since the radio core positions in the ICRF catalog may be in error by 1 mas, the frame defined by Gaia may be superior to that of the radio.
The number of precise radio positions has increased dramatically with the use of the Very Large Array (VLA)222http://www.vla.nrao.edu/astro/calib/manual/ and the VLBA (Petrov et al, 2008). When combined with the ICRF catalog, there are over three thousand reference points in the sky. These catalogs gives a good densification in the northern hemisphere, and is now increasing in the south (Petrov et al, 2009). With this radio densification, comparison of the Gaia inertial frame with the radio frame may detect zonal errors in either or both frames.
9 Conclusions
Using VLBA phase referencing on four close ICRF2 sources at 23 and 43 GHz for five sessions over one year, we have identified the radio cores and determined the radio structure of each source with 0.3-mas resolution, found the spectral index of the radio components, and measured the motion of the radio components in each source. The accuracy of the relative positions of the four sources (through their radio cores) was about 0.02 mas. The fours cores showed no relative motion over the year within the astrometric accuracy. The sources contained several other components, some of which were moving up to 1.2 mas/yr from the radio core.
With one VLBA 8.6 GHz session and the ICRF2 positions for these radio sources, the ICRF2 position determination and stability were assessed. We found that the ICRF2 position can be dominated by a jet component, rather than the radio cores that were detected at 43 GHz. Thus, the ICRF2 position may be offset from the radio core by up to 0.5 mas. Since many of the jet components are moving, the ICRF2 positions will also change, perhaps by 0.2 mas/yr, until the jet component becomes less intense than the radio core or becomes sufficiently separated (typically by 1.0 mas). Such motions have been seen in the ICRF data base, and all can be attributed to source structure.
Until significantly better tropospheric modeling of ICRF-type observations can be made, it will be the dominant source of error, even with these astrometric errors noted in this paper. Recent VLBA 23 GHz ICRF-type observations have obtained similar accuracies to the 8.6 GHz ICRF2, but more accurate imaging and analysis are needed to find the radio cores within the brightest components. The VLBI2010 project shows promise in increasing the accuracy of the reference frame and other astrometric parameters, but should consider extending their highest frequency of 15 GHz to 23 or 43 GHz in order to determine the stable radio core location with more confidence.
References
- Andrei et al (2009) Andrei, A. H., Souchay, J., Zacharias, N., Smart, R. L., Vieira Martins, R., et al. 2009, A&A, 505, 385
- Charlot et al (2010) Charlot, P., Boboltz, D. A., Fey. A. L, Fomalont, E. B., Geldzahler, B. J., Gordon, D., Jacobs, C. S., Lanby, G. E., Ma. C, Naudet, C. J. et al 2010, AJ, 139 1695
- Cornwell & Fomalont (1999) Cornwell, Tim & Fomalont, Ed 1999 ASP Conference Proceedings, 180, 187
- Feissel-Vernier, M. (2003) Feissel-Vernier, M. 2003, A&A, 403, 105
- Fey et al (2004) Fey, A. L., Ma, C., Arias, E. F., Charlot, P., Feissel-Vernier, M., Gontier, A.-M., Jacobs, C. S., Li, J. & MacMillan, D. S. 2004, AJ 127, 3609
- Fey et al (2010) Fey, Alan L., Gordon, David, & Jacobs, Christopher S. 2010, IERS / IVS Working Group, “The Second Realization of the International Celestial Reference Frame by Very Long Baseline Interferometry”,IERS Technical Note No. 35: http://www.iers.org/IERS/EN/Publications /TechnicalNotes/tn35.html
- Fomalont (2005) Fomalont, E. 2005 ASP Conference Proceedings, 340, 460
- Greisen (2003) Greisen, E. 2003, “Processing and archiving of AIPS, the VLA, and the VLBA” In: Heck A (ed) Information handling in astronomy— Historical vistas. Kluwer, Dordrecht. ISBN 1-4040-1178-4, Astro-phys and Space Sci Lib, 285, 109 http://www.aoc.nrao.edu/ egreisen/aips.ps.gz
- Hardwick & Schade (1990) Hartwick, F. D. A. & Schade, D. 1990 Annu. Rev. Astron. Astrophys, 28, 437
- Honma, Tamura & Reid (2008) Honma M., Tamura, Y. & Reid M. J. 2008, PASJ, 60, 951
- Kovalev et al (2009) Kovalev, Y. Y., Lobanov, A. P., Pushkavev, A. B. & Zensus, J. A. 2008, A&A, 483, 759
- Lestrade et al (1998) Lestrade, J.-F, Preston, R. A., Jones, D. L., Phillips, R. B., Rogers, A. E. E., Titus, M A., Reynolds, J. E., Jauncey, D. L., Gabuzda, D. C., Rioja, M. J., Guirado, J. C. & McCulloch, P. M. 1998, IAU Col. 164, ASP Conf Series, 144
- Lanyi et al (2010) Lanyi, G. E., Boboltz, D. A., Charlot, P., Fey, A. L., Fomalont, E. B., Geldzahler, B. J., Gordon, D., Jacobs, C. S., Ma, C, Naudet, C. J. et al 2010, AJ, 139, 1695
- Lister et al (2009) Lister, M. L., Cohen, M. H., Homan, D. C., Kadler, M., Kellermann, K. I., Kovalev, Y. Y., Ros, E., Savolainen, T. & Zensus, J. A. 2009, AJ, 128, 1874
- Honma et al (2008) Honma, M., et al 2008, Astrophysics and Space Science Proc., I, 27
- Marscher (2006) Marscher, A., ‘Relativistic Jets in Active Galactic Nuclei and their relationship to the Central Engine,’ Proc. of Science,VI Microquasar Workshop: Microquasars & Beyond, Societa del Casino, Como, Italy, 18-22 Sep 2006
- Mioduszewski & Kogan (2009) Mioduszewski A. & Kogan, L 2010, AIPS memo 110 ftp://ftp.aoc.nrao.edu/pub/software/aips/ TEXT/PUBL/AIPSMEM110.PS
- Niell et al (2010) Niell, A. et al 2010, http://www.haystack.mit.edu /geo/pubs/IAG2005VLBI2010rev1.pdf
- Person et al (1994) Pearson, T. J., Shepherd, M. C., Taylor, G. B., & Myers, S. T. 1994, BAAS, 26, 1318 http://www.astro.caltech.edu/ tjp/citvlb/
- Petrov et al (2008) Petrov., L, Kovalev, Y. Y., Fomalont, E .B. & Gordon, D. 2006, AJ, 136, 580
- Petrov et al (2009) Petrov, L., Phillips, C., Bertarini, A., Deller, A., Pogrebenko, S & Mujunen, A. 2009, Astro. Soc. Aust. 26, 75
- Reid et al (2009) Reid, M. J., Menten, K. M., Brunthaler, A., Zheng, X. W., Moscadelli, L. & Xu, Y., 2009, ApJ, 693, 397


| Correlated Flux Density | |||||
|---|---|---|---|---|---|
| Name | RA | DEC | 8.6 GHz | 23 GHz | 43 GHz |
| J2000 | S1 L1 | S L | S L | ||
| 0547+234 | 05:50:47.39090 | 23:26:48.1769 | 0.28, 0.25 | 0.24, 0.21 | 0.18, 0.15 |
| 0554+242 | 05:57:04.71358 | 24:13:55.2986 | 0.74, 0.24 | 0.49, 0.27 | 0.22, 0.09 |
| 0556+238 | 05:59:32.03313 | 23:53:53.9267 | 0.56, 0.42 | 0.32, 0.30 | 0.19, 0.17 |
| 0601+245 | 06:04:55.12138 | 24:29:55.0364 | 0.80, 0.34 | 0.43, 0.21 | 0.10, 0.06 |
Note. — 1: S = 200 km baseline; L = 5000 km baseline
| Array | Obs. Date | Freq (GHz) | Resol. e/wn/s (mas) |
|---|---|---|---|
| VERA | 18-Apr-2008 | 23 | |
| VERA | 24-May-2008 | 23 | |
| VLBA | 20-Dec-2008 | 23,43 | |
| VLBA | 22-Dec-2008 | 23,43 | |
| VERA | 17-Jan-2009 | 23 | |
| VLBA | 16-Mar-2009 | 23,43 | |
| VERA | 20-Apr-2009 | 23 | |
| VLBA | 08-Jun-2009 | 23,43 | |
| VLBA | 14-Sep-2009 | 23,43 | |
| VLBA | 12-Dec-2009 | 23,43 | |
| VLBA | 31-Jan-2010 | 8.6 |
| Session | 43 GHz | 23 GHz | ||||||
|---|---|---|---|---|---|---|---|---|
| Intensity [Jy] | Position [mas] | Intensity [Jy] | Position [mas] | |||||
| Total | Peak | X | Y | Total | Peak | X | Y | |
| 21-Dec-2008 | 0.143 | 0.291 | ||||||
| 16-Mar-2009 | 0.178 | 0.324 | ||||||
| 08-Jun-2009 | 0.192 | 0.320 | ||||||
| 14-Sep-2009 | 0.205 | 0.352 | ||||||
| 12-Dec-2009 | 0.217 | 0.342 | ||||||
| Session | 43 GHz | 23 GHz | ||||||
|---|---|---|---|---|---|---|---|---|
| Intensity [Jy] | Position [mas] | Intensity [Jy] | Position [mas] | |||||
| Total | Peak | X | Y | Total | Peak | X | Y | |
| 21-Dec-2008 | 0.187 | 0.330 | ||||||
| 16-Mar-2009 | 0.164 | 0.265 | ||||||
| 08-Jun-2009 | 0.128 | 0.199 | ||||||
| 14-Sep-2009 | 0.162 | 0.227 | ||||||
| 12-Dec-2009 | 0.199 | 0.284 | ||||||
| Session | 43 GHz | 23 GHz | ||||||
|---|---|---|---|---|---|---|---|---|
| Intensity [Jy] | Position [mas] | Intensity [Jy] | Position [mas] | |||||
| Total | Peak | X | Y | Total | Peak | X | Y | |
| Component 0 | ||||||||
| 21-Dec-2008 | 0.103 | 0.133 | ||||||
| 16-Mar-2009 | 0.087 | 0.148 | ||||||
| 08-Jun-2009 | 0.097 | 0.151 | ||||||
| 14-Sep-2009 | 0.089 | 0.146 | ||||||
| 12-Dec-2009 | 0.067 | 0.126 | ||||||
| Component 1 | ||||||||
| 21-Dec-2008 | 0.113 | 0.348 | ||||||
| 16-Mar-2009 | 0.117 | 0.333 | ||||||
| 08-Jun-2009 | 0.124 | 0.344 | ||||||
| 14-Sep-2009 | 0.115 | 0.325 | ||||||
| 12-Dec-2009 | 0.095 | 0.284 | ||||||
| Session | 43 GHz | 23 GHz | ||||||
|---|---|---|---|---|---|---|---|---|
| Intensity [Jy] | Position [mas] | Intensity [Jy] | Position [mas] | |||||
| Total | Peak | X | Y | Total | Peak | X | Y | |
| Component 0 | ||||||||
| 21-Dec-2008 | 0.053 | 0.139 | ||||||
| 16-Mar-2009 | 0.065 | 0.147 | ||||||
| 08-Jun-2009 | 0.068 | 0.127 | ||||||
| 14-Sep-2009 | 0.058 | 0.114 | ||||||
| 12-Dec-2009 | 0.039 | 0.092 | ||||||
| Component 1 | ||||||||
| 21-Dec-2008 | 0.070 | 0.190 | ||||||
| 16-Mar-2009 | 0.068 | 0.165 | ||||||
| 08-Jun-2009 | 0.061 | 0.175 | ||||||
| 14-Sep-2009 | 0.069 | 0.167 | ||||||
| 12-Dec-2009 | 0.052 | 0.156 | ||||||
| Component 2 | ||||||||
| 21-Dec-2008 | 0.056 | 0.136 | ||||||
| 16-Mar-2009 | 0.067 | 0.139 | ||||||
| 08-Jun-2009 | 0.064 | 0.125 | ||||||
| 14-Sep-2009 | 0.060 | 0.117 | ||||||
| 12-Dec-2009 | 0.047 | 0.114 | ||||||
| Session | 43 GHz | 23 GHz | ||||||
|---|---|---|---|---|---|---|---|---|
| Intensity [Jy] | Position [mas] | Intensity [Jy] | Position [mas] | |||||
| Total | Peak | X | Y | Total | Peak | X | Y | |
| One Component | ||||||||
| 21-Dec-2008 | 0.160 | 0.276 | ||||||
| 16-Mar-2009 | 0.208 | 0.306 | ||||||
| NE Component | ||||||||
| 08-Jun-2009 | 0.160 | 0.280 | ||||||
| 14-Sep-2009 | 0.180 | 0.270 | ||||||
| 12-Dec-2009 | 0.189 | 0.320 | ||||||
| SW Component | ||||||||
| 08-Jun-2009 | 0.070 | 0.045 | ||||||
| 14-Sep-2009 | 0.048 | 0.060 | ||||||
| 12-Dec-2009 | 0.070 | 0.060 | ||||||