Spontaneous motion of a droplet coupled with a chemical wave
Abstract
We propose a novel framework for the spontaneous motion of a droplet coupled with internal dynamic patterns generated in a reaction-diffusion system. The spatio-temporal order of the chemical reaction gives rise to inhomogeneous surface tension and results in self-propulsion driven by the surrounding flow due to the Marangoni effect. Numerical calculations of internal patterns together with theoretical results of the flow fields at low Reynolds number well reproduces the experimental results obtained using a droplet of Belousov-Zhabotinsky (BZ) reaction medium.
pacs:
82.40.Ck, 47.54.Fj, 47.63.mf, 68.03.CdSpatio-temporal patterns are widely seen in living systems; target, spiral, stripe, and dot patterns have been observed at various scales from the interior of a cell to a swarm of cells. Most of studies have been focused on patterns at larger scales, which can be successfully reproduced using reaction-diffusion dynamics pattern . In contrast, it is only recently that internal patterns in a single cell have been visualized. These patterns are expected to relate to cellular functions; examples include calcium ions for signal transduction Mathphys , Min proteins for cell division Min , and actin cytoskelton for mechanical properties Vicker . Although pattern formation in a cell is expected to be analyzed in the framework of a reaction-diffusion system, as demonstrated in in vitro experiments Min , sufficient understanding on the connection between pattern formation and cellular function is awaited. In this paper, we focus motility, as a typical aspect of cellular functions, arising from internal patterns.
Several artificial systems imitating cell motility have been proposed as self-propelled particles self-propulsion . Although no external force is exerted on the particles (force-free condition), the motion is induced by the asymmetric distribution of an electric field, concentration of chemicals, temperature, and so on. These asymmetric distributions are either a priori embedded in the asymmetry of the surface properties of the self-propelled objects asymmetry , or a posteriori created by nonlinear effects; motion itself destabilizes symmetric distribution, for instance, through advective flow bifurcation . In both cases, however, most studies have focused on motion under steady distributions.
In order to understand the dynamic features of cell motility, a system connecting dynamic pattern with motion is desirable. In fact, experimental and numerical evidence of chemo-mechanical coupling in such systems has been demonstrated Kitahata-JCP ; Yeomans . In this letter, we propose a theoretical framework for a chemical system exhibiting self-organized patterns, leading to spontaneous motion. We consider that the Marangoni effect is suitable for this purpose as it has been shown to drive an object under force-free conditions by an inhomogeneous interfacial tension arising from a gradient in chemical concentration Marangoni ; interface . In our system, the energy supply and consumption can generate a pattern in a droplet through nonlinear chemical kinetics, and the pattern at the interface of the droplet creates inhomogeneous interfacial tension. This generates a flow surrounding the droplet, resulting in motion.
We discuss a spherical droplet of incompressible fluid with a radius of in another fluid. We consider the Stokes equation under the approximation of low Reynolds number Brenner . The inertia term is also neglected where is fluid density. We will justify these assumptions later using experimental values. The concentration of chemical species, which determines the interfacial tension, obeys the reaction-diffusion-advection equation. The sets of governing equations are described as
| (1) | |||
| (2) | |||
| (3) |
where , , and are the flow velocity, pressure, and viscosity of the fluid, respectively. is a vector composed of concentrations of chemicals, corresponds to the reaction kinetics, and is a diffusion coefficient.
The flow velocity is coupled with the chemical reaction through interfacial tension at the droplet interface. This coupling is described as a force balance in a tangential direction at an interface interface ; Young : where is the stress tensor, and is the interfacial tension profile, which is dependent on .
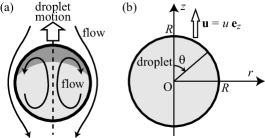
For simplicity, we only consider the axisymmetric system schematically shown in Fig. 1(a). Since the boundary condition is given at the droplet interface, it is convenient to set the spherical coordinates so that the droplet is fixed, as shown in Fig. 1(b). We have to adopt the boundary condition that and at and as , where is the distance from the droplet center, and is the droplet velocity in a laboratory system. The superscripts “(i)” and “(o)” correspond to the fluids inside and outside of the droplet, respectively. From the symmetric property, we aligned with positive ; i.e., . We also have to consider the condition that the force exerted on the droplet, , is zero; i.e.,
By solving Eqs. (1) and (2) with the above conditions, the droplet velocity is calculated as
| (4) |
where is the first-mode coefficient of the Legendre expansion of Young ; JCIS : , where is the Legendre polynominal of order . The higher modes () contribute only to deformation and are independent to the translational motion for small deformation. The detailed derivation on the solutions of the Stokes equation is shown in Supplemental Materials (SM) SM .
We focus on a specific system using the Belousov-Zhabotinsky (BZ) reaction, which is common in experimental systems that can exhibit spatio-temporal pattern formation, such as target and spiral patterns in a two-dimensional system BZ and a scroll ring in a three-dimensional system scroll . As a mathematical model for the BZ reaction, we adopt the Oregonator Oregonator , which is widely used due to its reliability as demonstrated in physico-chemical discussion on the elemental processes of chemical reactions. In the Oregonator, is composed of the two variables and , which corrrepond to the concentrations of HBrO2 and oxidized catalyst, also referred to as the activator and inhibitor, respectively. is described as:
| (5) |
where , , and are the parameters that determine the characterisitcs of the BZ reaction. The Oregonator model is nondimensionalized, so that the time unit in the calculation is set as .
The reaction-diffusion-advection equation (Eq. (3)) is numerically solved inside a droplet, which corresponds to the experimental conditions in which a droplet of BZ reaction medium (BZ droplet) is inside another fluid. Here, by taking the axisymmetry into consideration, the calculations can be performed in a two-dimensional field . We adopt a monotonous increasing function for the interfacial tension against :
| (6) |
This assumption is supported by the experimental measurements; the air/water interfacial tension in the ferroin-catalyzed BZ reaction medium is higher in the oxidized state than that in the reduced state BZ-surface ; inomoto . In addition, Marangoni flow was observed at the oil/water interface, as well as the air/water interface Kitahata-JCP . Note that the coefficient may include the effect due to the heat generation by reaction, which only reduces its absolute value.
The parameters for the Oregonator model were set as , , and , which correspond to the excitable condition, in which a chemical wave propagates only from the initiated point. In the numerical calculation, the velocity field was calculated by summing the modes of to . We confirmed that the cut-off modes did not critically affect the numerical results.
We performed numerical calculations under two typical sets of conditions; one is a single pulse that corresponds to a target pattern, and the other is a scroll ring scroll , which is a natural extension of a spiral wave in a three-dimensional medium.
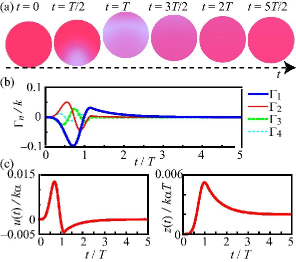
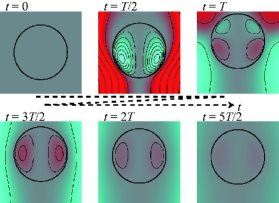
Figure 2 shows the results of numerical calculations for a single pulse. At , a chemical wave was initiated in the lower half of the droplet, and then a single chemical wave propagated isotropically. Figure 2 (a) shows snapshots of in a cross section of the droplet, and Fig. 2 (b) and (c) are the time series of , velocity and position of the droplet, respectively. The chemical wave arose from the lower part of the droplet, and propagated in a circular shape. When the wave reached the lower boundary of the droplet, the droplet began to move upward. When the chemical wave reached the upper boundary, the droplet moved back in the opposite direction. Nevertheless, there was a net motion in a cycle (see Fig. 2(c) and movies in SM SM .) Figure 3 shows snapshots of streamlines in a cross section inside a droplet from the droplet-fixed frame. The direction of the convective rolls was inverted at the moment the droplet moved back.
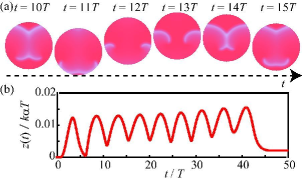
In the numerical calculation for a scroll ring, the pattern was prepared using the following standard procedure; a chemical wave was first initiated, and a part of the chemical wave was omitted by setting and as steady-state values at . The numerical results for the snapshots and time series of the position of the droplet are shown in Fig. 4. The droplet moved back and forth, gradually moving upward, coupling with the development of the scroll ring (see the movie in SM SM ). In Fig. 4(a), the chemical wave first reached the lower half of the droplet, which lead to upward motion. As the point of contact moved toward the upper half of the droplet, downward motion resulted. The droplet finally stopped, since the filament (alignment of the phase singularity points) shrank and disappeared due to its intrinsic instability scroll-instablity .
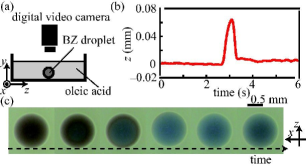
In order to compare the theoretical and experimental results, we undertook experiments on spontaneous motion of a BZ droplet inside an oil phase as schematically shown in Fig. 5(a). We put a droplet of BZ medium with a volume of 1 l into an oil phase (oleic acid), in a petri dish made of polytetrafluoroethylene to prevent the droplet from coming into contact with the bottom of the petri dish. We then observed the BZ droplet from above using a digital video camera (DCR-HC62, Sony, Japan) equipped with a close-up lens (CM-3500, Raynox, Japan). The composition of the BZ reaction medium was , , , and .
The experimental results are summarized in Fig. 5(b) and (c). The BZ droplet moves in a horizontal plane. The axis of the position in (b) is set so that the upper direction in (c) is positive. As the BZ reaction medium was prepared in an oscillatory condition, a chemical wave was initiated spontaneously from the point determined stochastically. In Fig. 5(c), a chemical wave was initiated in the lower half of the droplet. When the propagating chemical wave touched the lower interface, the droplet began to move upwards. It then moved back in the opposite direction when the chemical wave propagated over the entire droplet.
From the experimental results, the maximum droplet velocity was measured as . The viscosity of the BZ medium, , is and that of oleic acid, , is . The Reynolds number in the present experimental system is calculated with the kinetic viscosity, , as , which shows that the Stokes approximation is applicable. The relaxation of the velocity field is characterized by , while the time scale of the wave propagation is With these values, we confirm that the time-derivative in Eq. (1) does not qualitatively affect our results, but modifies Eq. (4) within 15% following the method in Laplace . Therefore, to the sake of simplicity, we assume the flow both inside and outside of the droplet rapidly changes following the changes in chemical concentration. Using these values and the results of the numerical calculations, the maximum difference in the interfacial tension between the oxidized and reduced conditions is estimated as . Although it is difficult to directly measure the interfacial tension at the oil/water interface in this particular system, at an air/water interface of the BZ medium is available inomoto . The value in the reference was ten times higher than our estimation for at an oil/water interface. In general, the interfacial tension of an oil/water interface is lower than that of an air/water interface Israelachvili , and thus the present estimation seems reasonable.
In summary, we studied droplet motion coupled with internal dynamic pattern formation through an interfacial tension gradient. The Stokes equation was adopted for a spherical droplet, and the motion of the droplet was calculated, which well reproduced the experimental results. Although we have not so far experimentally succeeded in generating scrolling rings in a BZ droplet, we expect this motion will be realized by using photosensitive BZ reaction. A similar model could also be applied to other types of motion; for example, rotational and oscillatory motion. It could further be extended to the motion of a nonspherical droplet.
The authors thank T. Ohta, K. Yoshikawa, M. Sano, H. Kori and T. Ichino for their helpful discussion. Y. S. and K. H. N. are supported by a JSPS fellowship for young scientists (No.21-3566 and No.23-1819 ).
References
- (1) K. Matsumoto, S. Takagi, and T. Nakagaki, Biophys. J. 94, 2492 (2008); S. Kondo and R. Asai, Nature 380, 678 (1996); J. D. Murray, Mathematical Biology (Springer-Verlag, Berlin, 1989); H. Meinhardt and P. A. J. de Boer, Proc. Nat. Am. Soc. 98, 14202 (2001); J. J. Tyson et al., Physica D 34, 193 (1989).
- (2) J. Keener and J. Sneyd, Mathematical Physiology (Springer-Verlag, New York, 1998).
- (3) M. Loose et al., Science 320, 789 (2008).
- (4) M. G. Vicker, Biophys. Chem. 84, 87 (2000).
- (5) S. J. Ebbens and J. R. Howse, Soft Matter 6, 726 (2010); W. F. Paxton et al., Angew. Chem. Int. Ed. 45, 5420 (2006).
- (6) W. F. Paxton et al., J. Am. Chem. Soc. 126, 13424 (2004); J. R. Howse et al. Phys. Rev. Lett. 99, 048102 (2007); H. R. Jiang, N. Yoshinaga, and M. Sano, ibid 105, 268302 (2010).
- (7) F. D. dos Santos and T. Ondarcuhu, Phys. Rev. Lett. 75, 2972 (1995); Y. Sumino et al., ibid 94, 068301 (2005); U. Thiele and E. Knobloch, ibid 97, 204501 (2006); K. Nagai et al., Phys. Rev. E 71, 065301 (2005); M. Nagayama et al., Physica D 194, 151 (2004).
- (8) H. Kitahata et al., J. Chem. Phys. 116 5666 (2002).
- (9) K. Furtado, C. M. Pooley, and J. M. Yeomans, Phys. Rev. E 78, 046308 (2008).
- (10) L. E. Scriven and C. V. Sternling, Nature 187, 186 (1960).
- (11) A. A. Nepomnyashchy, M. G. Velarde, P. Colinet, Interfacial Phenomena and Convection (Chapman & Hall/CRC, Boca Raton, 2002).
- (12) J. Happel and H. Brenner, Low Reynolds Number Hydrodynamics: with special applications to particulate media (Prentice-Hall, Englewood Cliffs, 1965).
- (13) N. O. Young, J. S. Goldstein, and M. J. Block, J. Fluid Mech. 6, 350 (1959).
- (14) M. D. Levan, J. Colloid. Interface Sci. 83, 11 (1981).
- (15) See supplementary material at http://cu.phys.s.chiba-u.ac.jp/ kitahata/BZdrop/.
- (16) R. Kapral and K. Showalter, Chemical Waves and Patterns (Kluwer Academic, Dordrecht, 1995).
- (17) A. T. Winfree, Scinece 181, 937 (1973).
- (18) J. P. Keener and J. J. Tyson, Physica D 21, 307 (1986).
- (19) K. Yoshikawa et al., Chem. Phys. Lett. 211, 211 (1993); H. Miike, S. C. Müller, and B. Hess, Phys. Rev. Lett. 61, 2109 (1988); M. Diewald et al., ibid 77, 4466 (1996); K. Matthiessen, H. Wilke, and S. C. Müller, Phys. Rev. E 53, 6056 (1996).
- (20) O. Inomoto et al. Phys. Rev. E 61, 5326 (2000).
- (21) A. T. Winfree and W. Jahnke, J. Phys. Chem. 93, 2823 (1989).
- (22) V. Galindo et al. Micrograv. Sci. Technol. 7, 234 (1994).
- (23) J. N. Israelachvili, “Intermolecular and surface forces”, (Academic Press, London, 1985).