Electromagnetically Induced Transparency and Slow Light with Optomechanics
Abstract
Controlling the interaction between localized optical and mechanical excitations has recently become possible following advances in micro- and nano-fabrication techniques Kippenberg2008 ; Favero2009 . To date, most experimental studies of optomechanics have focused on measurement and control of the mechanical subsystem through its interaction with optics, and have led to the experimental demonstration of dynamical back-action cooling and optical rigidity of the mechanical system Braginsky1977 ; Kippenberg2008 . Conversely, the optical response of these systems is also modified in the presence of mechanical interactions, leading to strong nonlinear effects such as Electromagnetically Induced Transparency (EIT) Weis2010 and parametric normal-mode splitting groblacher09a . In atomic systems, seminal experiments Hau1999 and proposals to slow and stop the propagation of light fleischhauer05 , and their applicability to modern optical networks Boyd2009 , and future quantum networks Kimble2008 , have thrust EIT to the forefront of experimental study during the last two decades. In a similar fashion, here we use the optomechanical nonlinearity to control the velocity of light via engineered photon-phonon interactions. Our results demonstrate EIT and tunable optical delays in a nanoscale optomechanical crystal device, fabricated by simply etching holes into a thin film of silicon (Si). At low temperature ( K), we show an optically-tunable delay of with near-unity optical transparency, and superluminal light with a signal advance. These results, while indicating significant progress towards an integrated quantum optomechanical memory Chang2010 , are also relevant to classical signal processing applications. Measurements at room temperature and in the analogous regime of Electromagnetically Induced Absorption (EIA) show the utility of these chip-scale optomechanical systems for optical buffering, amplification, and filtering of microwave-over-optical signals.
It is by now well known that the optical properties of matter can be dramatically modified by using a secondary light beam, approximately resonant with an internal process of the material system. As an example, an opaque object can be made transparent in the presence of a control beam, in what is referred to as “Electromagnetically Induced Transparency” (EIT). A remarkable feature of EIT is the drastic reduction in the group velocity of light passing through the material, achieved inside a practically lossless transparency window. This aspect of the effect has been utilized to conjure schemes whereby light may be slowed and stopped, making it an important building block in quantum information and communication proposals, as well as of great practical interest in classical optics and photonics. A simple upper-bound for the storage time in EIT-based proposals is the lifetime related to the internal processes of the material. These lifetimes can be extremely long in atomic gases, with storage times on the order of one second having been demonstrated Zhang2009 in Bose-Einstein Condensates. Part of the vision for future scalable quantum networks has involved extending the remarkable results achieved in atomic experiments to a more readily deployable domain.
In the solid state, EIT has been demonstrated in quantum wells, dots, and N-V centers Phillips2003 ; Santori2006 ; Xu2008 . The fast dephasing rates and inhomogeneous broadening of solid state electronic resonances, however, has led to a plethora of other methods and techniques. Elegant experiments with stimulated Brillouin scattering (SBS) in fibers Thevenaz2008 , and coherent population oscillations (CPO) Bigelow2003 have been used to delay intense classical light. Alternatively, for quantum storage and buffering, techniques based on photon-echo spectroscopy (e.g. CRIB Afzelius2009 and AFC Riedmatten2008 ) have been used successfully to achieve solid-state quantum memories. In chip-scale photonics, proposals for dynamically tunable arrays of cavities, displaying EIT, are an intriguing analogy to ensembles of atoms and provide a route to slowing and stopping light all-optically yanik04 . Generally, the elements in the arrays have consisted of coupled optical or plasmonic resonances, and have been demonstrated with couplings engineered to give rise to Fano-like interference Xu2006 . A significant limitation in these all-photonic systems, however, is the short optical resonance lifetime. With optomechanics, EIT arising from optically controlled interactions between engineered optical and mechanical modes provides the means for tunable delays on the order of the mechanical resonance lifetime, which due to the lower mechanical frequency, can be orders of magnitude longer than the lifetime of the optical mode. Such delays are attainable at any wavelength and in any material which is of high optical and mechanical quality (indeed, recent circuit cavity electromechanics experiments in the strong-coupling regime have demonstrated group velocity control at microwave frequencies Teufel2010a ). Additionally, the on-chip nature and Si compatibility of many optomechanical systems Li2008 suggest that arrays of such structures may be possible Notomi08 , allowing for the dynamic slowing and storage of light pulses Chang2010 .
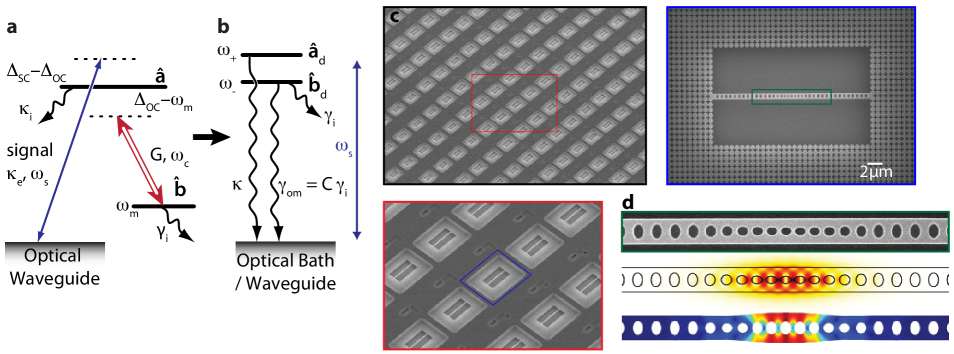
EIT in optomechanical systems can be understood physically as follows. The conventional radiation pressure interaction between a near-resonant cavity light field and mechanical motion is modeled by the nonlinear Hamiltonian , where and are the annihilation operators of photon and phonon resonator quanta, respectively, and is the optomechanical coupling rate corresponding physically to the shift in the optical mode’s frequency due to the zero-point fluctuations of the phonon mode. By driving the system with an intense red-detuned optical “control” beam at frequency , as shown in Fig. 1a, the form of the effective interaction changes (in the resolved sideband limit) to that of a beam-splitter-like Hamiltonian . Here, the zero-point-motion coupling rate is replaced by a much stronger parametric coupling rate between light and mechanics, where is the stored intracavity photon number induced by the control beam. Viewed in a dressed-state picture, with the control beam detuning set to , the optical and mechanical modes and become coupled (denoted and in Fig. 1b). The dressed mechanical mode, now effectively a phonon-photon polariton, takes on a weakly photonic nature, coupling it to the optical loss channels at a rate , where the optomechanical cooperativity is defined as for an optical cavity decay rate of .
The drive-dependent loss rate has been viewed in most previous studies as an incoherent, quantum-limited loss channel, and was used in recent experiments to cool the mechanical resonator close to its quantum ground state Rocheleau2010 . In the dressed mode picture, in analogy to the dressed state view of EIT fleischhauer05 , it becomes clear that a coherent cancellation of the loss channels in the dressed optical and mechanical modes is possible, and can be used to switch the system from absorptive to transmittive in a narrowband around cavity resonance. Much as in atomic EIT, this effect causes an extremely steep dispersion for the transmitted probe photons, with a group delay on resonance of (see Appendix A)
| (1) |
where is the optical coupling rate between the external optical waveguide and the optical cavity, and the delay is dynamically tunable via the control beam intensity through .
Nano- and micro-optomechanical resonators take a variety of forms, among which optomechanical crystals (OMC) have been used to demonstrate large radiation-pressure-induced interaction strengths between gigahertz mechanical and near-infrared optical resonances eichenfield09 . The nanobeam OMC cavity used in this study (Figs. 1c and 1d) utilizes a periodic free-standing Si structure to create high- co-localized optical and mechanical resonances. These devices can be printed and etched into the surface of a Si chip in large arrays (Fig. 1c), and are designed to operate optically in the telecom band () and acoustically at microwave frequencies (). The theoretical optomechanical coupling rate between co-localized photon and phonon modes is . By optimizing both the defect and crystal structure, an intrinsic optical decay rate of is obtained for the optical mode, placing the optomechanical system in the resolved sideband regime () necessary for EIT. The corresponding mechanical resonance is measured to have an intrinsic damping rate of ( K). Light is coupled into and out of the device using a specially prepared optical fiber taper, which when placed in the near-field of the nanobeam cavity couples the guided modes of the taper evanescently to the optical resonances of the nanobeam (see Appendix A for details of the optical cavity loading).
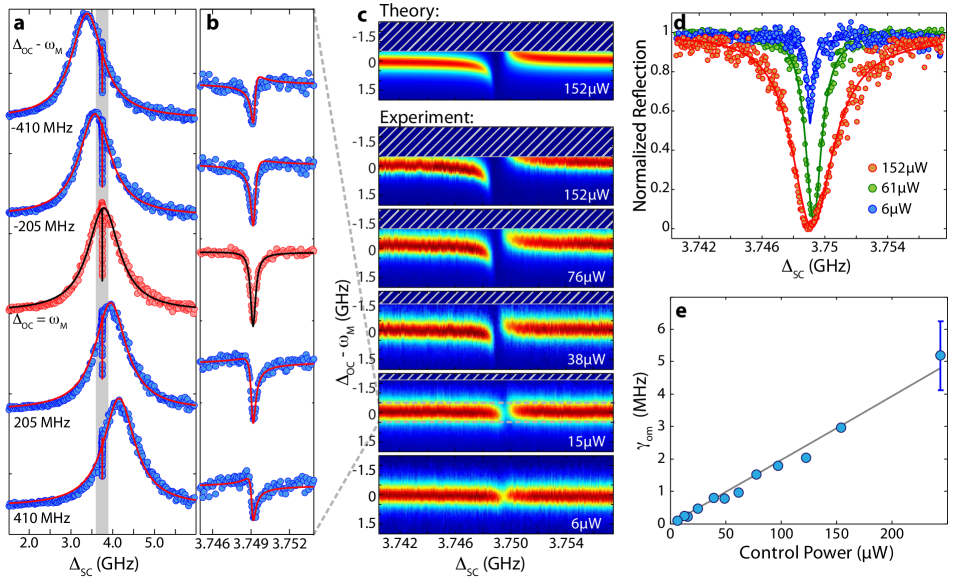
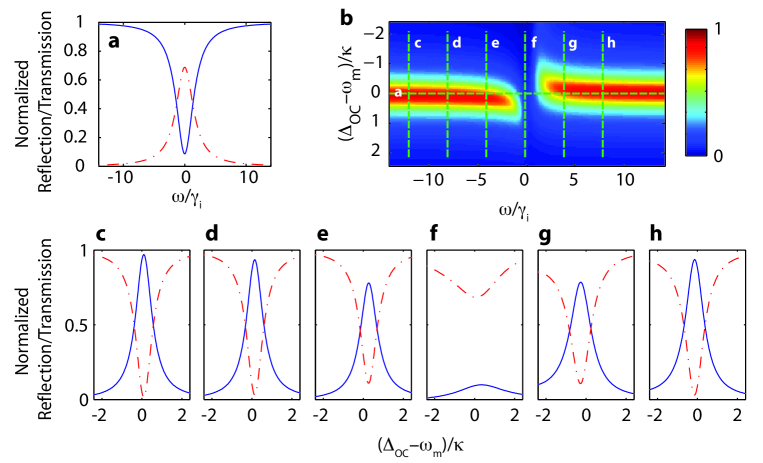
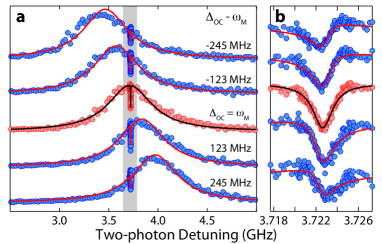
In order to characterize the near-resonance optical reflection of the cavity system, a sideband of the control beam is created using electro-optic modulation (see Methods and Appendix C), forming a weak signal beam with tunable frequency . The results of measurements performed at a cryogenic temperature of are shown in Fig. 2. Here, the control beam laser power was varied from () to nearly (). The frequencies of both the control and signal beams are swept in order to map out the system dependence upon control-cavity detuning, , and the two-photon detuning, . The resulting reflected optical signal intensity, separated from the control beam via a modulation and lock-in technique (see Methods and Appendix C), is shown in Fig. 2(a) for a series of control laser detunings. Visible in each of the plots is a broad resonance corresponding to the bare optical cavity response with loaded linewidth . A much narrower reflection dip feature, corresponding to the transparency window, can also be seen near the cavity line center. The position of the narrow reflection dip tracks with a two-photon detuning equal to the mechanical resonance frequency, . This region is shown in more detail in Fig. 2b, where the Fano-like structure of the optical response is apparent. Each curve in Figs. 2a and 2b is a horizontal slice of the data presented in Fig 2c, where the reflectivity is plotted as a function of both and . The transparency window is shown to be fully controllable via the appled light field, the window expanding and contracting with the control beam laser power (Fig. 2d). At the maximum stable control power (unstable regions due to a thermo-optic bistability induced by optical absorption are shown as hatched regions in Fig. 2c), a transparency window approaching is obtained.
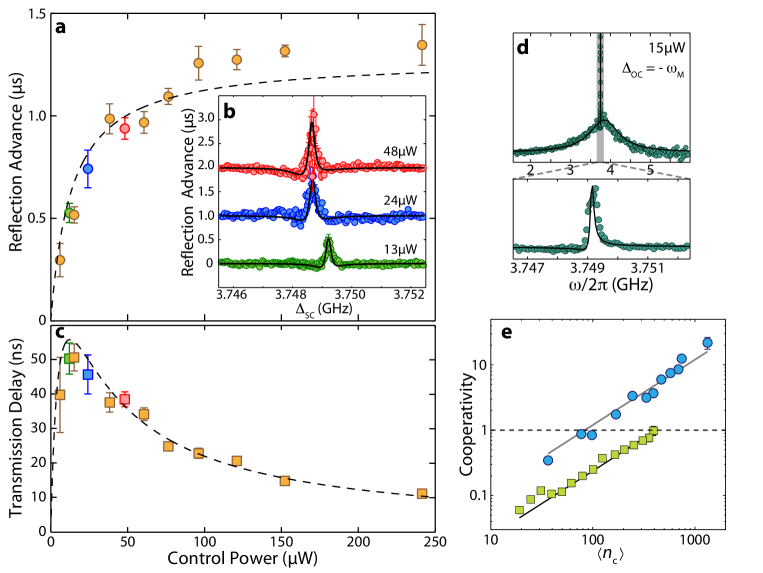
A model fit to the reflection spectra (see Appendix A) are shown as solid curves in Figs. 2a and 2b. The resulting fit values for for each control power are shown in Fig. 2e. A linear fit to the extracted data yields a value for the zero-point-motion coupling constant of , in agreement with the value obtained from independent optical transduction measurements of the thermal Brownian motion of the mechanical oscillator eichenfield09 . In addition to the intensity response of the optomechanical cavity there is the phase response, which provides a measure of the group delay of the modulated optical signal beam as it passes through the cavity. For the modulation of the signal beam used in our experiments, corresponding to a free-space signal wavelength of , phase shifts between the modulation sidebands and the signal carrier on the order of a fraction of a radian are measured in the region where is within a mechanical linewidth of . The measured phase-shifts for the reflected signal beam correspond to advances in time of the modulated signal, pointing to causality-preserving superluminal effects. A plot of the peak effective signal advance versus control beam power is plotted in Fig. 3a, ascertained from a fit to the reflection phase response spectra (Fig. 3b). For the highest control power, the reflected signal is advanced by , roughly 7000 times longer than the bare optical cavity lifetime.
The delay in transmission is directly related to the advance upon reflection through the bare cavity transmission contrast (measured independently; see Appendices A and C). As such, we plot the corresponding transmission group delay of the signal in Fig. 3c. The theoretical delay/advance of the modulated signal beam for system parameters given by fits to the EIT intensity spectra are shown as dashed curves in Figs. 3a and 3c, indicating good agreement with the measured phase response. As can be seen in this data, the maximum measured transmission delay is ns, which although corresponds to significant slowing of light to a velocity of m/s through the few micron long structure, is much smaller than the measured reflected signal advance or the limit set by the intrinsic mechanical damping ( s). This is due to the weak loading of the optical cavity in these experiments (see Appendix A), and the resulting small fraction of transmitted light that actually passes through the cavity.
In addition to the observed EIT-like behavior of the optomechanical system, a similar phenomena to that of Electromagentic Induced Absorption (EIA) Lezama1999 in atomic systems can be realized by setting the detuning of the control beam to the blue side of the optomechanical cavity resonance (). Under blue-detuned pumping, the effective Hamiltonian for the optical signal and mechanical phonon mode becomes one of parametric amplification, . The measured reflection spectrum from the OMC is shown in Fig. 3d, where the reflectivity of the cavity system is seen to be enhanced around the two-photon detuning , a result of the increased “absorption” (feeding) of photons into the cavity. As discussed further in the Appendix A, at even higher control beam powers such that , the system switches from EIA to parametric amplification, resulting in optical signal amplification, and eventually phonon-lasing.
Reflection spectroscopy at room temperature ( K) of the optomechanical cavity has also been performed (presented in the Appendix D), and yields similar results to that of the cryogenic measurements, albeit with a larger value of required to reach a given cooperativity (see Fig. 3e) due to the larger intrinsic mechanical dissipation at room temperature (). Beyond the initial demonstrations of EIT and EIA behaviour in the OMC cavities presented here, it is fruitful to consider the bandwidth and signal delay limits that might be attainable with future improvements in device material or geometry. For instance, the transparency bandwidth of the current devices is limited by two-photon absorption of the control beam in the silicon cavities; a move to larger bandgap dielectric materials, such as silicon nitride, should allow intra-cavity photon numbers of (limited by linear material absorption), resulting in a transparency window approaching (1 GHz). Also, recent research into low-loss GHz mechanic resonators Nguyen07 should enable slow light optical delays approaching s at room temperature, roughly a path length of a kilometer of optical fiber. Much like the acoustic wave devices used in electronic systems Lakin1995 , optomechanical devices with these attributes would enable chip-scale microwave photonic systems capable of advanced signal processing in the optical domain, such as that needed for emerging broadband wireless access networks or more specialized applications such as true-time delays in radar systems Boyd2009 .
The limiting factor for quantum applications of optomechanical systems is the re-thermalization time of the mechanical resonator, , which in the case of a quantum optical memory represents the average storage time of a single photon before excitation of the system by a thermal bath phonon. For the devices studied here, despite the small optically-cooled phonon occupancy of the resonator ( phonons from the measured cooperativity), the re-thermalization time is only ns at the measurement temperature of K ( ps at room temperature). Reducing the operating temperature further to a value below mK (routinely attained in a dilution refigerator), would not only increase the re-thermalization time through a lower bath temperature, but should also result in a significant increase in the mechanical -factor. Taken together, the resulting re-thermalization time in the current OMC devices at mK is likely to be on the order of s, which although not nearly as long as what has been achieved in atomic systems Zhang2009 , still represents a substantial storage time compared to the realizable GHz bandwidth of the system. Additionally, optomechanical processes similar to the EIT behavior measured here have also been proposed Stannigel2010 ; Safavi-Naeini2010a to provide an optical interface between, for instance, atomic and superconducting circuit quantum systems, enabling the formation of hybrid quantum networks.
Acknowledgements
The authors would like to thank Keith Schwab for providing the microwave modulation source used in this work. This work was supported by the DARPA/MTO ORCHID program through a grant from AFOSR, and the Kavli Nanoscience Institute at Caltech. ASN gratefully acknowledges support from NSERC.
Methods
Fabrication: The nano-beam cavities were fabricated using a Silicon-On-Insulator wafer from SOITEC (- cm, device layer thickness nm, buried-oxide layer thickness m). The cavity geometry is defined by electron beam lithography followed by inductively-coupled-plasma reactive ion etching (ICP-RIE) to transfer the pattern through the silicon device layer. The cavities were then undercut using solution to remove the buried oxide layer, and cleaned using a piranha/HF cycle. The dimensions and design of the nano-beam will be discussed in detail elsewhere.
Experimental Set-up: We demonstrate EIT via reflection measurements of the optically pumped system at varying . Using the experimental setup shown in Appendix C, a laser beam at (the control beam) is sent through an electro-optical modulator (EOM) with drive frequency , creating an optical sideband at frequency (the signal beam), which is amplitude modulated at . Since the control beam is detuned from the cavity by , it is effectively filtered when looking in reflection, while the modulated signal beam at (where the sign is that of ), is near-resonance with the optical cavity and is reflected. The reflected signal beam is detected using a 12 GHz New Focus PIN photo-diode, with the output electrical signal sent to a lock-in amplifier where the component related to the modulated tone ( kHz) is amplified and sent to an oscilloscope. By scanning both the laser frequency and the two-photon detuning , a full map of the reflectivity is obtained. Additionally, by using a lock-in amplifier, the phase of the modulated signal sidebands relative to the carrier can be measured, giving a direct measurement of the group delay imparted on the optical signal beam by the optomechanical cavity.
References
- (1) Kippenberg, T. J. & Vahala, K. J. Cavity optomechanics: Back-action at the mesoscale (2008).
- (2) Favero, I. & Karrai, K. Optomechanics of deformable optical cavities (2009).
- (3) Braginsky, V. B. Measurement of Weak Forces in Physics Experiments (Univ. of Chicago Press, Chicago, 1977).
- (4) Weis, S. et al. Optomechanically induced transparency. Science science.1195596 (2010).
- (5) Gröblacher, S., Hammerer, K., Vanner, M. & Aspelmeyer, M. Observation of strong coupling between a micromechanical resonator and an optical cavity field. Nature 460, 724–727 (2009).
- (6) Hau, L. V., Harris, S. E., Dutton, Z. & Behroozi, C. H. Light speed reduction to 17 metres per second in an ultracold atomic gas (1999).
- (7) Fleischhauer, M., Imamoglu, A. & Marangos, J. P. Electromagnetically induced transparency: Optics in coherent media. Rev. Mod. Phys. 77, 633–673 (2005).
- (8) Boyd, R. W. & Gauthier, D. J. Controlling the velocity of light pulses (2009).
- (9) Kimble, H. J. The quantum internet (2008).
- (10) Chang, D., Safavi-Naeini, A. H., Hafezi, M. & Painter, O. Slowing and stopping light using an optomechanical crystal array. ArXiv e-prints (2010). eprint 1006.3829.
- (11) Zhang, R., Garner, S. R. & Hau, L. V. Creation of long-term coherent optical memory via controlled nonlinear interactions in bose-einstein condensates. Phys. Rev. Lett. 103, 233602 (2009).
- (12) Phillips, M. C. et al. Electromagnetically induced transparency in semiconductors via biexciton coherence. Phys. Rev. Lett. 91, 183602– (2003).
- (13) Santori, C. et al. Coherent population trapping of single spins in diamond under optical excitation. Phys. Rev. Lett. 97, 247401– (2006).
- (14) Xu, X. et al. Coherent population trapping of an electron spin in a single negatively charged quantum dot. Nat Phys 4, 692–695 (2008).
- (15) Thevenaz, L. Slow and fast light in optical fibres. Nat Photon 2, 474–481 (2008).
- (16) Bigelow, M. S., Lepeshkin, N. N. & Boyd, R. W. Superluminal and slow light propagation in a room-temperature solid. Science 301, 200–202 (2003).
- (17) Afzelius, M., Simon, C., de Riedmatten, H. & Gisin, N. Multimode quantum memory based on atomic frequency combs. Phys. Rev. A 79, 052329– (2009).
- (18) de Riedmatten, H., Afzelius, M., Staudt, M. U., Simon, C. & Gisin, N. A solid-state light-matter interface at the single-photon level (2008).
- (19) Yanik, M. F., Suh, W., Wang, Z. & Fan, S. Stopping Light in a Waveguide with an All-Optical Analog of Electromagnetically Induced Transparency. Phys. Rev. Lett. 93, 233903 (2004).
- (20) Xu, Q. et al. Experimental realization of an on-chip all-optical analogue to electromagnetically induced transparency. Phys. Rev. Lett. 96, 123901– (2006).
- (21) Teufel, J. D. et al. Circuit cavity electromechanics in the strong coupling regime. aXiv:1011.3067 (2010).
- (22) Li, M. et al. Harnessing optical forces in integrated photonic circuits (2008).
- (23) Notomi, M., Kuramochi, E. & Tanabe, T. Large-scale arrays of ultrahigh-Q coupled nanocavities. Nature Photon. 2, 741–747 (2008).
- (24) Rocheleau, T. et al. Preparation and detection of a mechanical resonator near the ground state of motion (2010).
- (25) Eichenfield, M., Chan, J., Camacho, R. M., Vahala, K. J. & Painter, O. Optomechanical Crystals. Nature 462, 78–82 (2009).
- (26) Lezama, A., Barreiro, S. & Akulshin, A. M. Electromagnetically induced absorption. Phys. Rev. A 59, 4732– (1999).
- (27) Nguyen, C. T.-C. Mems technology for timing and frequency control. IEEE Trans. on Ultrasonics, Ferroelectrics, and Frequency Control 54, 251–270 (2007).
- (28) Lakin, K., Kline, G. & McCarron, K. Development of miniature filters for wireless applications. MTT, IEEE 43, 2933–2939 (1995).
- (29) Stannigel, K., Rabl, P., Sørensen, A. S., Zoller, P. & Lukin, M. D. Opto-mechanical transducers for long-distance quantum communication. Phys. Rev. Lett. 105, 220501– (2010).
- (30) Safavi-Naeini, A. H. & Painter, O. Proposal for an optomechanical traveling wave phonon-photon translator ArXiv e-prints (2010). eprint 1009.3529.
Appendix A Theory of Optomechanical EIT, EIA and Parametric Amplification
Here we provide a theoretical treatment of some of the main aspects of EIT agarwal10 ; Weis2010 ; fleischhauer05 ; lukin03 , EIA Lezama1999 and parametric amplification Louisell1961 ; Yariv1965 ; Mollow1967 in optomechanical systems. Modeling the optomechanical system with the Hamiltonian
| (2) |
it is possible to linearize the operation of the system, under the influence of a control laser at , about a particular steady-state given by intracavity photon amplitude and a static phonon shift . The interaction of the mechanics and pump photons at with secondary “probe” photons at with two-photon detuning can then be modeled by making the substitutions
| (3) |
Assuming that the pump is much larger than the probe, , the pump amplitude is left unaffected and the equations for each sideband amplitude are found to be
| (4) | |||||
| (5) |
We have defined as the pump detuning from the optical cavity (including the static optomechanical shift, ), and . In these situations it is typical to define , as the effective optomechanical coupling rate between a sideband and the mechanical subsystem, mediated by the pump.
A.1 Red-detuned pump: Electromagnetically Induced Transparency
With the pump detuned from the cavity by a two-photon detuning , the spectral selectivity of the optical cavity causes the sideband populations to be skewed in a drastic fashion. It is then an acceptable approximation to neglect one of these sidebands, depending on whether the pump is on the red or blue side of the cavity. When the pump resides on the red side (), the is reduced and can be neglected. This is the rotating wave approximation (RWA) and is valid so long as .
Then Eqs. (4-5) may be solved for the reflection and transmission coefficients and of the side-coupled cavity system. We find that
| (6) | |||||
| (7) |
A.1.1 Group Delay
For the red-detuned system, the existence of an effective transparency on transmission makes the group delay imparted on the pulse an interesting quantity. To calculate the reflection and transmission group delays we consider a pulse
| (8) |
where most of the spectrum is confined to a small window () about a central signal frequency . Then the transmitted signal may be written as
The last line implies that , where
| (10) |
The reflection group delay may also be defined analogously,
| (11) |
With the signal sent at a two-photon detuning , we find
| (12) |
where the cooperativity is a measure of the coupling between the mechanical oscillator and the optical bath. Under the same conditions we find that group delay for reflection is given by
| (13) |
resulting in the limit
| (14) |
A quantity of interest, the delay-bandwidth product can be calculated for the transmitted signal, by taking the product of the signal delay , and the bandwidth , to give us .
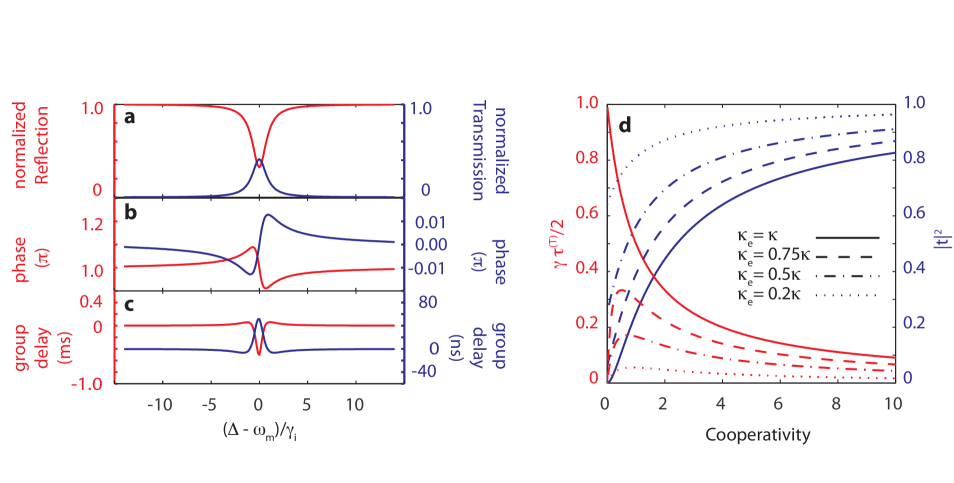
Using equations 12 and 6 we can estimate the maximum delay for our system. The reflection and transmission coefficients at resonance () are given by
| (15) |
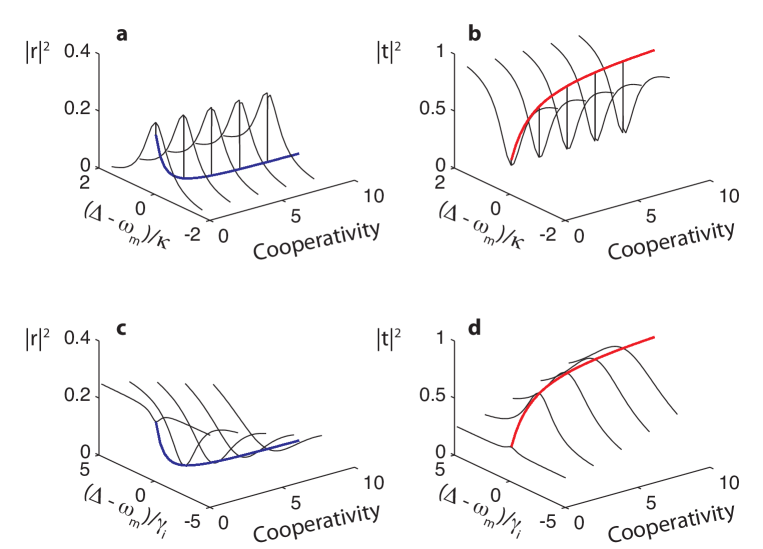
For the case where intrinsic optical losses are negligible, i.e. , the equations for delay and transmission coefficient contrast can be written as
| (16) |
and are plotted in Fig. 6.
A.2 Blue-detuned pump: Electromagnetically Induced Absorption and Amplification
By placing the pump at a mechanical frequency away from cavity, on the blue side () we may ignore the sideband of the intracavity photons. The reflection in this case is calculated to be
| (17) |
and . The linearization which leads to this equation from the full dynamics of the system, only holds below the phonon lasing threshold, , and so we limit ourselves to the case where . The effective interaction Hamiltonian of the system which is obtained after making the rotating wave approximation to remove terms counter-rotating at the mechanical frequency, is given by Aspelmeyer2010
| (18) |
This is also the Hamiltonian of a parametric oscillator, whose quantum theory has been known for some time Louisell1961 ; Mollow1967 . The only distinction with our system, is that we consider and measure mainly the reflection and transmission properties of the parametric oscillator, as opposed to its internal dynamics. Using the expression in eqn. (17) we find
| (19) |
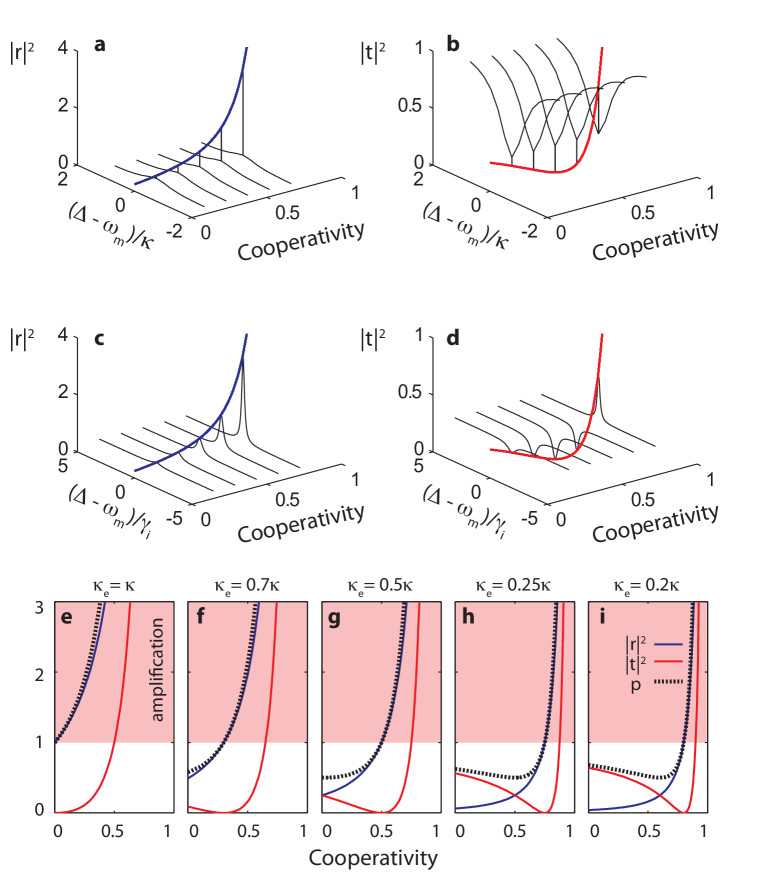
These expressions are plotted in Fig 7a-d for a range of cooperativities. The ratio between the power leaving the cavity through the waveguide to the input power is the sum of the reflection and transmission coefficient amplitudes, . As the base-line value, we take for which the emitted power is .
A.2.1 Weak-Coupling: Electromagnetically Induced Absorption
At small cooperativities and weak cavity-waveguide coupling , the behaviour of our system is analogous to what has been observed in atomic gases, and been called Electromagnetically Induced Absorption (EIA) Lezama1999 . Under these conditions, is less than , and more of the incoming photons are now absorbed than in the case with . As such, the reflection will exhibit an absorption peak, and the transmission an absorption dip. As long as , there will always be a value of such that absorption is enhanced, as experimentally demonstrated in this paper. In systems where , we find for any finite . Plots of the transmission, reflection, and are shown as a function of cooperativity in Fig. 7e-i. It can be seen that the slope of at goes from positive to negative as over-takes . Even with weak cavity-waveguide coupling, at sufficiently high C, the system changes from absorptive to amplifying with becoming much larger than and 1, as can be seen in the shaded region of Fig. 7e-i.
A.2.2 Amplification
As suggested by the effective Hamiltonian of the system in eqn. (18), parametric amplification is always possible, and occurs at . It is important to note that at perfect coupling, , amplification will occur for any finite . This can be seen in Fig. 7, which shows that the transmission is always greater than unity for finite .
A.2.3 Group Delay
Following a derivation similar to that in the previous section we arrive at values for maximum group delay , given by
| (20) | |||||
| (21) |
Note that as increases, and the system switches at from absorptive to amplifying, and the sign of the group delay on transmission changes from from positive to negative. For systems with strong cavity-waveguide coupling, , both and are negative, pointing to causality-preserving superluminal light.
Appendix B Fabrication
The nano-beam cavities were fabricated using a Silicon-On-Insulator wafer from SOITEC (- cm, device layer thickness nm, buried-oxide layer thickness m). The cavity geometry is defined by electron beam lithography followed by inductively-coupled-plasma reactive ion etching (ICP-RIE) to transfer the pattern through the silicon device layer. The cavities were then undercut using solution to remove the buried oxide layer, and cleaned using a piranha/HF cycle Borselli2006 . The dimensions and design of the nano-beam will be discussed in details elsewhere.
Appendix C Data Measurement and Analysis
C.1 Experimental Setup
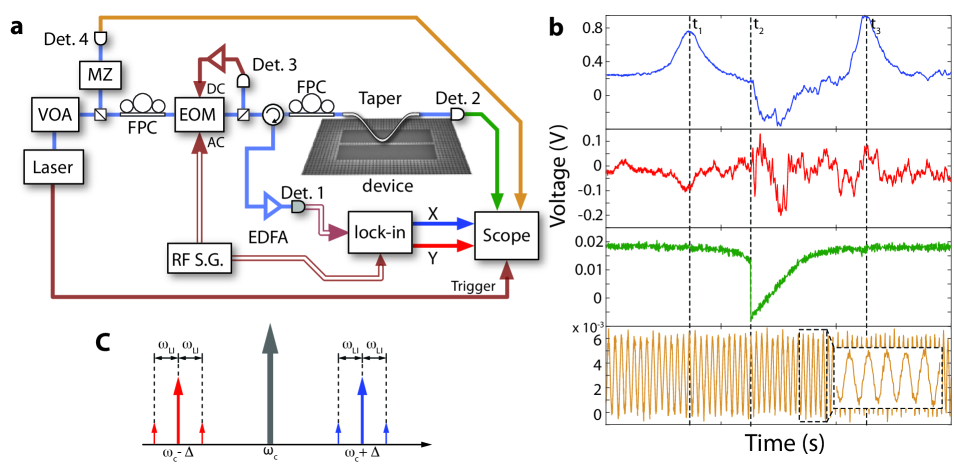
The detailed experimental setup used to measure the EIT window and delay properties of the optomechanical crystal is shown in Fig. 8(a). The setup is designed to record simultaneously the reflected signals from a probe sideband while scanning and recording the pump laser transmission.
As a light source we use a fiber-coupled tunable infrared laser, (New Focus Velocity, model TLB-6328) spanning approximately nm, centered around nm, which has its intensity controlled by a variable optical attenuator (VOA). A small percentage () of the laser intensity is sent to a custom-made fiber coupled Mach-Zehnder (MZ) interferometer and has its intensity detected by a photodetector (Det.4, New Focus Nanosecond Photodetector, model 1623) for further wavelength calibration. To minimize polarization dependent losses on the electro-optical-modulator (EOM), a fiber polarization controller (FPC) is placed before it.
The AC signal used for the electro-optical modulator (EOM) comes from the radio-frequency signal generator (RF S.G., Rohde-Schwarz, SMA-100A). There, a rf-signal carrier at the two-photon detuning frequency (GHz) has its amplitude modulated at the Lock-in detection frequency ( kHz). As a result, the EOM modulation produces two probe sidebands at , where each of them have a small modulation at the lock-in frequency (see Fig. 8(c)).
A small portion of the signal from the EOM output () is used (Det. 3) as a DC control signal to control for any low frequency power drift during the experiment, by keeping the EOM level locked. The remaining laser light is passed through a circulator, a FPC and then couple to a tapered and dimpled optical fiber (Taper) which has its position controlled with nanometer-scale precision (although vibrations and static electric forces limit the minimum stable spacing between the fiber and device to about 50 nm).
The transmitted light through the taper is detected (Det. 2) and recorded on the oscilloscope (Scope, Agilent, DSO80204B). Any reflected signal coming from the Taper/device is optically amplified by a Erbium-Doped-Fiber-Amplifier (EDFA) and detected by a high-speed photoreceiver (Det. 1, New Focus model, 1554-B) with a maximum transimpedance gain of V/A and a bandwidth ( dB rolloff point) of GHz. The rf-signal from the photoreceiver is sent to a Lock-in amplifier (L.I., SRS-830). The output from the in-phase and quadrature signals from the L.I. are also recorded on the same oscilloscope. The recorded signal on the oscilloscope is triggered by the sweeping frequency on the pump laser.
Since the pump is detuned from the cavity by , it is filtered on reflection, while the modulated sidebands at (where the sign is that of ) are reflected and sent to a lock-in amplifier, where the component related to the modulated sideband is amplified and sent to an oscilloscope. Using a lock-in amplifier allows us to measure the phase-shift on the signal modulated at , giving a direct measurement of the group delay imparted on the signal.
Fig. 5(b) shows a sample of the resulting raw data measured on the oscilloscope for the in-phase (blue curve) and out-phase (red curve) reflected signal detected by the lock-in amplifier; the pump transmission spectra (green curve); and the Mach-Zehnder interferometer pattern (yellow curve) used to calibrate the wavelength for the transmission and reflection data. The probe reflection is normalized based upon the transmission contrast for the pump laser at low input power, where the cavity line-shape is not distorted by thermal nonlinearities.
C.2 Data Analysis
Here we will show how the amplitude modulation of the signal sideband is used to measure the reflection () and delay () of the signal reflected from the cavity. The output of the EOM can be written as:
| (22) |
where the input field amplitude , , is the EOM-modulation index and is amplitude modulation index on the rf signal at . For the measurements shown in the main text . In this case one can write the field of the EOM output (cavity input) in the time domain as:
| (23) | |||||
Fig. 8(c) shows a schematic of the cavity input fields in the frequency domain. The reflected signal is filtered by the cavity dispersion and considering the case where the pump is on the red-side of the cavity () the reflected field is:
| (24) |
First we assume that is roughly constant over a range of which is true for . This implies that the smallest transparency window we could measure is on the order of the lock-in detection frequency, which corresponds to the smallest input power for the low and room temperature data.
We can now write the time average detected power spectral density on the photoreceiver (Det. 1 on Fig. 8a) by taking the absolute square value of the reflected field and keeping only the terms with frequency smaller than the detector bandwidth. In this case:
where A/V is the detector responsivity, V/A is the detector gain and is the load resistance.
This signal is then sent to the lock-in which can measure independently the in-phase () and quadrature () power spectral densities at :
| (25) |
It is then easy to see the reflection amplitude and phase are given by
From the imparted change in the phase the signal delay is then calculated as:
where () represent a delay (advance) on the signal.
Here we have neglected the gain provided by the lock-in, which is important to determine the absolute value of . To account for that we calibrate the channel by a normalized transmission curve taken with low input power. Our assumption is that the cavity-taper coupling is not affected by the input power. A analogous result can be found for the case where the control laser is on the blue side of the cavity ().
Appendix D Room-temperature Electromagnetically Induced Transparency
Reflection spectroscopy of the system at 296 K results in the spectra shown in Fig. 9. Due to the larger intrinsic mechanical damping rate at room temperature (), higher power is required to reach a given cooperativity. Additionally, the nanobeam optomechanical system is thermally sensitive and responds at a rate faster than the 89 kHz modulation signal used. As such, part of the phase response is thermal in nature. This added effect masks the small coherent phase-shifts imparted by the optomechanical cavity on the modulated signal sidebands. Nonetheless, the Fano resonances measured (See Fig. 9b) are a direct indication of coherent interference between the excitation of the optical cavity and the mechanical phonon.
References
- (1) Agarwal, G. S. & Huang, S. Electromagnetically induced transparency in mechanical effects of light. Physical Review A 81, 041803 (2010).
- (2) Weis, S. et al. Optomechanically induced transparency. Science science.1195596 (2010).
- (3) Fleischhauer, M., Imamoglu, A. & Marangos, J. P. Electromagnetically induced transparency: Optics in coherent media. Rev. Mod. Phys. 77, 633–673 (2005).
- (4) Lukin, M. D. Colloquium: Trapping and manipulating photon states in atomic ensembles. Rev. Mod. Phys. 75, 457–472 (2003).
- (5) Lezama, A., Barreiro, S. & Akulshin, A. M. Electromagnetically induced absorption. Phys. Rev. A 59, 4732– (1999).
- (6) Louisell, W. H., Yariv, A. & Siegman, A. E. Quantum fluctuations and noise in parametric processes. i. Phys. Rev. 124, 1646– (1961).
- (7) Yariv, A. Quantum theory for parametric interactions of light and hypersound. Quantum Electronics, IEEE Journal 1, 28–36 (1965).
- (8) Mollow, B. R. & Glauber, R. J. Quantum theory of parametric amplification. I. Phys. Rev. 160, 1076– (1967).
- (9) Aspelmeyer, M., Gr blacher, S., Hammerer, K. & Kiesel, N. Quantum optomechanics throwing a glance [invited]. J. Opt. Soc. Am. B 27, A189–A197 (2010).
- (10) Borselli, M., Johnson, T. J. & Painter, O. Measuring the role of surface chemistry in silicon microphotonics (2006).