Measurements of Hadron Production at CMS
Abstract:
Measurements of hadron production in collisions at = 0.9, 2.36 and 7 TeV recorded with the CMS detector are reported. Transverse momentum, pseudorapidity and multiplicity distributions of charged hadrons are presented. For non-single-diffractive collisions, the average charged-hadron transverse momentum and pseudorapidity density reveal an increase in production rate not well matched by theory and models. Measured spectra of identified strange particles, \PKzS, \PgL, \PagL, \PgXm and \PagXp, reconstructed based on their decay topology, are also presented. The production rates for strange particles are observed to be in excess of those predicted by Monte Carlo models by up to a factor of three.
1 Introduction
Measurements of particle production are an essential early step in the understanding of proton-proton collisions at the LHC. Particle spectra provide a testing ground for the interplay of soft and hard QCD interactions and fragmentation models at the unprecedented collision energies of the LHC. They also provide valuable information for the tuning of Monte Carlo (MC) models for future measurements.
CMS is a general purpose experiment at the Large Hadron Collider [1]. The inner detector contains a silicon tracker composed of pixel layers at radii less than 15 cm and strip layers out to a radius of 110 cm. The central region has 3 layers of pixels and 10 layers of strips. The cylindrical geometry of the central region changes to disks in the plane for the forward region. Each side of the interaction region contains two endcap pixel layers and up to 12 layers of strips. The tracker, PbWO4 electromagnetic calorimeter, and brass-scintillator hadron calorimeter are all immersed in a 3.8 T axial magnetic field.
The results presented here rely on the excellent performance of the tracking system [2] and come from data collected in 0.9 and 2.36 TeV pp collisions in December 2009 and from 7 TeV collisions in early 2010. To preferentially select non-single-diffractive (NSD) events, activity on both sides of the interaction region was required using either Beam Scintillation Counters covering or the forward calorimeter covering . Beam-halo and beam background events were also removed.
2 Charged hadron production
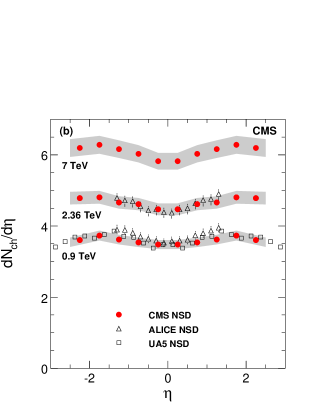
CMS has measured the distribution of charged particles versus pseudorapidity with three independent methods. The first method uses counts of pixel clusters, requiring that the cluster shape be consistent with originating from the interaction region, to measure the number of charged particles with as low as 30 MeV/. The second method uses tracks found in the pixel system with a minimum of 50 MeV/. The third method uses the full silicon system to reconstruct tracks and is able to reconstruct tracks as low as . After correcting for acceptance and efficiency, the three methods give consistent results and are averaged to obtain the final result [3, 4].
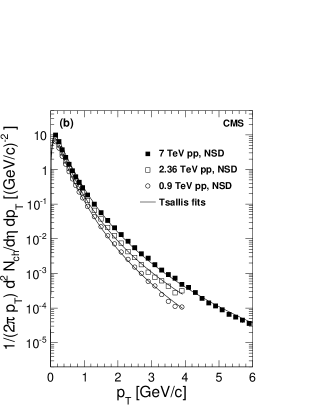
Figure 1 shows the distribution for NSD events for = 0.9, 2.36 and 7 TeV. The results are shown to be in good agreement with measurements from other experiments. The full tracking method also provides a measurement of track . The distributions for NSD events are also shown in Fig. 1 and demonstrate the characteristic sharply falling distribution as a function of .
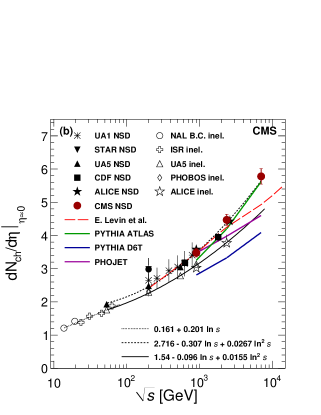
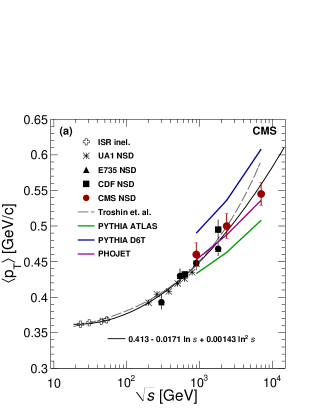
The observed increase in multiplicity and versus center-of-mass energy is seen clearly in Fig. 2 where at (left) and average (right) are plotted versus . While parametrizations of the behavior of and versus are possible, the current Phojet [5, 6] and Pythia [7] curves are unable to account for both results.
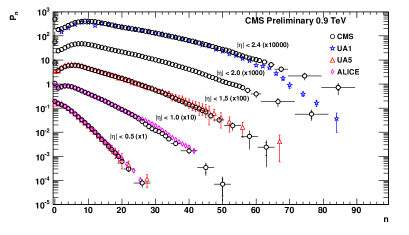
The charged particle multiplicity distribution for non-single-diffractive events has also been measured [8]. The data are corrected for the trigger and event selection efficiency and the effects of tracking inefficiency and secondary tracks originating from the decay of long lived particles and products of interactions with the beam pipe and the detector material.
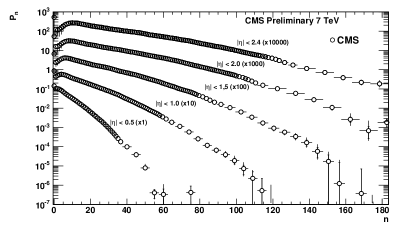
Figure 3 shows the multiplicity distributions for and 7 TeV for various domains of pseudorapidity up to . The multiplicity distribution at TeV is in agreement with previous experiments. At higher energies, a strong increase of the mean multiplicity with is observed, which is underestimated by most Monte Carlo models. The measurement of higher order moments of the multiplicity distribution confirms the violation of KNO scaling that has been observed at lower energies.
3 Strange particle production
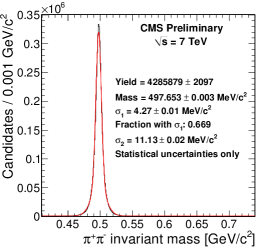
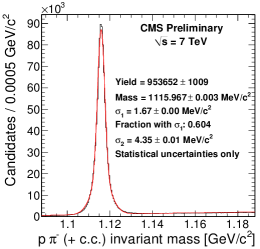
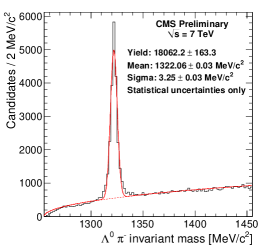
Long-lived, strange particles, \PKzS, \PgL, \PagL, \PgXm and \PagXp, have been reconstructed and identified based on their decay topology in decays to the final states , and , respectively [9], with charge conjugates implied throughout. \PKzS and \PgL particles are reconstructed by fitting oppositely charged tracks that are displaced from the primary interaction vertex to a common secondary vertex that is also required to be displaced from the primary. \PgXm particles are reconstructed by combining a \PgL candidate with a third displaced charged track. Figure 4 shows the reconstructed invariant mass distributions for \PKzS, \PgL and \PgXm from 7 TeV data.
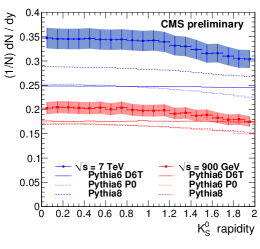
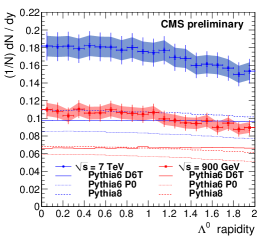
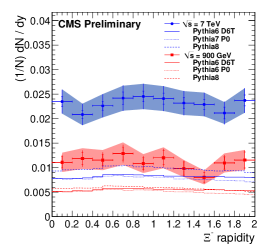
The reconstruction efficiency for each particle species is determined from MC simulation and is used to scale the reconstructed particle yields to measure the production distributions as functions of rapidity, , and . The MC is observed to be a poor representation of the data in both track multiplicity and and for the strange particles and is reweighted to match the data. The particle yields are corrected for trigger and event selection efficiency, non-prompt and single diffractive contributions to measure and for NSD events for each particle species. The measured distributions for are shown in Fig. 5. The expected production rates from various Pythia models are also shown, and are found to be significantly lower than measured in the data, up to a deficit of a factor of three for \PgXm production at 7 TeV.
4 Conclusion
Charged track and strange particle production rates have been measured as functions of transverse momentum and (pseudo)rapidity in CMS data at values of 0.9, 2.36 and 7.0 TeV. The rise in charged particle production rate with is not well modeled, nor is the overall rate of strange particle production, which is observed to exceed predictions from Pythia by up to a factor of three.
References
- [1] The CMS Collaboration, JINST 3, S08004 (2008).
- [2] The CMS Collaboration, arXiv:1007.1988.
- [3] The CMS Collaboration, JHEP 1002, 041 (2010), arXiv:1002.0621.
- [4] The CMS Collaboration, Phys. Rev. Lett. 105 022002 (2010), arXiv:1005.3299.
- [5] Engel, R., Z. Phys. C66 203-214 (1995).
- [6] Engel, R. and Ranft, J., Phys. Rev. D54 4244-4262 (1996),arXiv:hep-ph/9509373
- [7] Sjostrand, Torbjorn and Mrenna, Stephen and Skands, Peter Z., JHEP 05, 026 (2006), arXiv:hep-ph/0603175.
- [8] The CMS Collaboration, CMS Physics Analysis Summary QCD-10-004, http://cdsweb.cern.ch/record/1279343, (2010).
- [9] The CMS Collaboration, CMS Physics Analysis Summary QCD-10-007, http://cdsweb.cern.ch/record/1279344, (2010).