Departamento de Física Teórica, and Instituto de Física Teórica UAM/CSIC,
Universidad Autónoma de Madrid, Cantoblanco, E-28049, Madrid, Spain
Istituto Nazionale di Fisica Nucleare, Sez. Roma Tor Vergata, Roma, Italy
Measurement of anisotropies in the large-scale diffuse gamma-ray emission
Abstract
We have performed the first measurement of the angular power spectrum in the large-scale diffuse emission at energies from 1-50 GeV. We compared results from data and a simulated model in order to identify significant differences in anisotropy properties. We found angular power above the photon noise level in the data at multipoles greater than for energies GeV. The excess power in the data suggests a contribution from a point source population not present in the model.
1 Introduction
The Fermi Gamma-Ray Telescope, launched on June 11th 2008 from Cape Canaveral, performs gamma-ray measurements over the whole celestial sphere. Its main scientific instrument the Large Area Telescope (LAT) measures the tracks of the electron and positron that result when an incident gamma-ray undergoes pair conversion in a thin, tungsten foil, and measures the energy of the subsequent electromagnetic shower that develops in the telescope’s calorimeter. Some Fermi-LAT specifications are: Energy range from 20MeV to 300GeV, angular resolution 0.1 deg above 10 GeV, field of view (FoV) 2.4sr, and uniform sky exposure of 30 minutes every 3 hours. Detailed descriptions of the Fermi-LAT telescope can be found in [1].
One of the key science targets of the Fermi mission is diffuse gamma-ray emission. Its main component is correlated with Milky Way structures, the galactic emission, arising from interactions of high-energy cosmic rays with the interstellar medium and the interstellar radiation field. A fainter component considered to have an isotropic or nearly isotropic distribution on the sky, the so-called extragalactic emission, has been observed. This observation is based on the modelization of galactic component, detected Fermi-LAT sources and the solar gamma-ray emission [2]. Also there is a contribution from populations of sources, of various kinds, including blazars, pulsars, SNR, and possibly dark matter (DM) structures, not yet detected due to Fermi-LAT spatial resolution and photon statistics. The angular distribution of photons in the diffuse gamma-ray background contains information about the presence and nature of these unresolved source populations (USP). Fluctuations on small scales may originate from USP if they are different from those expected from the Poisson noise due to finite statistics.
Recent studies have predicted the contributions to the angular power spectrum (APS) from extragalactic and galactic DM annihilation or decay, e.g. [3, 4, 5, 6, 7, 8, 9, 10]. A detailed Fermi-LAT sensitivity study of anisotropies from DM annihilation has been presented in [11].
I present the results of an anisotropy analysis of the diffuse emission measured by the Fermi-LAT. We calculate the angular power spectrum of the emission from months of Fermi data and of the emission from a simulated model (galactic diffuse emission, 11-month sources from Fermi catalog and isotropic emission), and compare the results from the data and model in order to identify significant differences in anisotropy properties.
2 The angular power spectrum (APS) as a metric for anisotropy
We consider the APS of intensity fluctuations,
| (1) |
where is the intensity in the direction . The APS is given by , where are determined by expanding (1) in spherical harmonics,
The statistical uncertainty in the measured APS is given by
| (2) |
where exp is the window function of a Gaussian beam of width . is the fraction of the sky observed and multipole bins. The noise power spectrum is the Poisson noise, , where is the number of photons observed.
3 Method
-
•
Select regions of the sky which are relatively clean
-
-
mask sources in the 11-month catalog within a 2 deg radius
-
-
mask the galactic plane deg
-
-
-
•
Calculate angular power spectrum of the data in several energy bins using the HEALPix package [14].
-
•
Focus on multipoles greater than 100 (angular scales ), because the contamination from Galactic diffuse is likely to be small.
-
•
Compare results from data and simulated model to identify significant differences in anisotropy properties.
-
•
Error bars on points indicate statistical uncertainty in the measurement; systematic uncertainties are NOT included.
Data from months of diffuse class events in the energy range 1GeV to 50GeV were analyzed. We used P6_ V3 instrument response, for data and simulations. Maps have been binned into order 9 HEALPix.
The simulated data are produced using the gtobssim routine, part of the Fermi Science Tools package. We used current background models released by the Fermi collaboration111http://fermi.gsfc.nasa.gov/ssc/data/access/lat/BackgroundModels.html and 1-year point source catalog222http://fermi.gsfc.nasa.gov/ssc/data/access/lat/1yr_ catalog/.
4 Results and conclusions
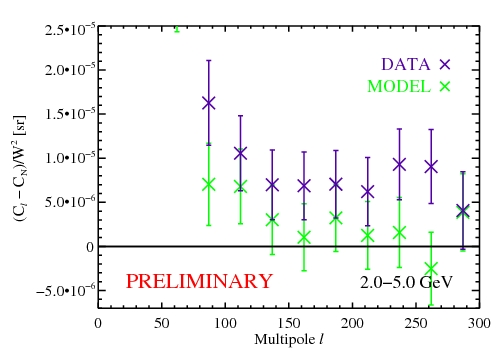
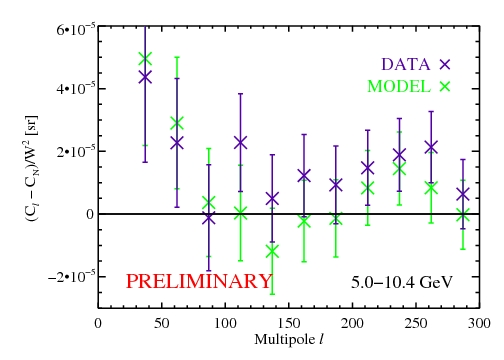
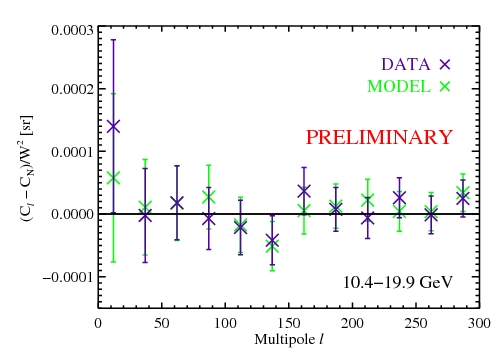
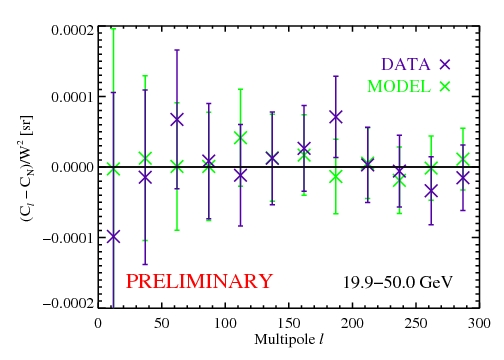
Plots of Fig. 1. show the APS of the data and the default model (Galactic diffuse model + 11 month source catalog + isotropic) in different energy ranges. These figures show at what energy ranges and multipole ranges the APS of the data and the model differ, as well as where each of these is consistent with the photon noise level.
We have found that at multipoles greater than the excess power in the data suggest a contribution from a point source population not present in the model. Also, at large angular scales () angular power above the noise is seen in the data and model, probably due to contamination from the galactic diffuse.
Due to decreasing photon statistics, the amplitude of anisotropies detectable by this analysis decreases with increasing energy. For this reason, the non-detection of power above the noise level at - GeV does not exclude the presence of anisotropies at the level of those detected at - GeV.

Acknowledgements.
The Fermi-LAT Collaboration acknowledges support from a number of agencies and institutes for both development and the operation of the Fermi-LAT as well as scientific data analysis. These include NASA and DOE in the United States, CEA/Irfu and IN2P3/CNRS in France, ASI and INFN in Italy, MEXT, KEK, and JAXA in Japan, and the K. A. Wallenberg Foundation, the Swedish Research Council and the National Space Board in Sweden. Additional support from INAF in Italy and CNES in France for science analysis during the operations phase is also gratefully acknowledged. G.G.V thanks the support of the Spanish MICINN’s Consolider-Ingenio 2010 Programme under grant MultiDark CSD2009-00064, MICINN under grant FPA2009-08958, the Community of Madrid under grant HEPHACOS S2009/ESP-1473, and the European Union under the Marie Curie-ITN program PITN-GA-2009-237920.References
- [1] Atwood W. B. et al. [Fermi-LAT Collaboration] Astrophys. J. 697 (2009) 1071
- [2] Abdo A. A. et al. [The Fermi-LAT collaboration] Phys. Rev. Lett. 104 (2010) 101101
- [3] Ando S. and Komatsu E. Phys. Rev. D 73 (2006) 023521
- [4] Ando S., Komatsu E., Narumoto T. and Totani T. Phys. Rev. D 75 (2007) 063519
- [5] Siegal-Gaskins J. M. JCAP 0810 (2008) 040
- [6] Siegal-Gaskins J. M. and Pavlidou V. Phys. Rev. Lett. 102 (2009) 241301
- [7] Ando S. Phys. Rev. D 80 (2009) 023520
- [8] Fornasa M., Pieri L., Bertone G. and Branchini E. Phys. Rev. D 80 (2009) 023518
- [9] Zavala J., Springel V. and Boylan-Kolchin M., arXiv:1001.3307 [astro-ph.CO].
- [10] Taoso M., Ando S., Bertone G. and Profumo S., Phys. Rev. D 79 (2009) 043521
- [11] Cuoco A., Sellerholm A., Conrad J. and Hannestad S. [arXiv:1005.0843].
- [12] Ando S., Komatsu E., Narumoto T. and Totani T. Mon. Not. Roy. Astron. Soc. 376 (2007) 1635
- [13] Ando S. and Pavlidou V. Mon. Not. Roy. Astron. Soc. 400 (2009) 2122
- [14] Gorski K. M., Hivon E., Banday A. J., Wandelt B. D., Hansen F. K., Reinecke M. and Bartelman M. Astrophys. J. 622 (2005) 759