Mid-infrared colour gradients and the colour-magnitude relation in Virgo early-type galaxies
Abstract
We make use of Spitzer imaging between 4 and and near-infrared data at to investigate the nature and distribution of the mid-infrared emission in a sample of early-type galaxies in the Virgo cluster. These data allow us to conclude, with some confidence, that the emission at in passive ETGs is stellar in origin, consistent with previous work concluding that the excess mid-infrared emission comes from the dusty envelopes around evolved AGB stars. There is little evidence for the mid-infrared emission of an unresolved central component, as might arise in the presence of a dusty torus associated with a low-luminosity AGN.
We nonetheless find that the emission is more centrally peaked than the near-infrared emission, implying a radial stellar population gradient. By comparing with independent evidence from studies at optical wavelengths, we conclude that a metallicity that falls with increasing radius is the principal driver of the observed gradient.
We also plot the mid-infrared colour-magnitude diagram and combine with similar work on the Coma cluster to define the colour-magnitude relation for absolute K-band magnitudes from -26 to -19. Because a correlation between mass and age would produce a relation with a gradient in the opposite sense to that observed, we conclude that the relation reflects the fact that passive ETGs of lower mass also have a lower average metallicity. The colour-magnitude relation is thus driven by metallicity effects.
In contrast to what is found in Coma, we do not find any objects with anomalously bright emission relative to the colour-magnitude relation. Although there is little overlap in the mass ranges probed in the two clusters, this may suggest that observable “rejuvenation” episodes are limited to intermediate mass objects.
keywords:
galaxies:elliptical and lenticular cD, galaxies:evolution, galaxies:clusters:general, galaxies:photometry, infrared:galaxies.1 Introduction
The mid-infrared emission of even the most passive early-type galaxies (ETGs) shows an excess of emission longward of over that which is expected from purely photospheric emission. This excess emission was detected by Impey et al. (1986) using ground-based observations and was subsequently studied using ISO (e.g. Bressan et al. 2001). The excess has now been observed in the central regions of bright ETGs in the Virgo cluster (Bressan et al. 2006) using Spitzer-IRS. Although some ETGs show a mid-infrared excess that is evidently caused by warm dust in a star forming inter-stellar medium (Panuzzo et al. 2007) the excess in passive objects can be explained as the integrated emission from the hot dust in the envelopes of evolved AGB stars. However, hot dust emission could also arise from the dusty torus around a central active galactic nucleus (AGN) of low luminosity.
Although there is evidence that the emission at is extended in Coma cluster galaxies (Clemens et al. 2009a) the weight of evidence for this is far from conclusive. In the present article we discuss Spitzer-IRS peakup imaging at of ETGs in the Virgo cluster that permit the investigation of the spatial distribution of the excess mid-infrared emission. In order to isolate the effects of the mid-infrared excess caused by AGB stars we also use IRAC images at 4.5 and because these are relatively unaffected by the excess and sample the purely photospheric component at the longest possible wavelength. We will argue that the excess is stellar in origin, as has been previously suggested (Bressan et al. 1998, Athey et al. 2002, Xilouris et al. 2003).
The stellar origin of the excess mid-infrared emission makes it a particularly useful age/metallicity diagnostic because the contribution of the mid-infrared excess to the integrated spectrum varies with age and metallicity in a different way to optical diagnostics (Bressan, Granato & Silva 1998). As a stellar population gets younger and/or the metallicity increases the mid-infrared excess increases. However, the optical H index becomes larger (optical colours bluer) as the age decreases and/or the metallicity decreases. The opposite behavior of optical indices (colours, narrow band indices and spectral shape) and mid-IR excess with respect to age and metallicity variations, means that the mid-infrared spectral region, in combination with optical data, can disentangle age-metallicity effects in early-type galaxies. Mid-infrared observations, then, can provide without the need of accurate modeling the explanation of the origin of the colour-magnitude relation in clusters of galaxies. This can be understood by considering the two following extremes.
-
•
If galaxies are coeval and the bluer colours toward the less luminous sources are due to lower average metallicity (e.g. Arimoto & Yoshii, 1986) we expect the mid-infrared excess to become relatively less pronounced at decreasing luminosity.
-
•
If the galaxies have the same average metallicity and the bluer colours toward less luminous sources are due to a younger age (the alternative explanation allowed in principle by optical diagnostics) we expect the mid-infrared excess to become relatively more pronounced at decreasing luminosity.
Although most studies tend to find that both age and metallicity vary as a function of galaxy luminosity or velocity dispersion (e.g. Nelan et al. 2005, Thomas et al. 2005, Clemens et al. 2006, 2009b) it is not clear which is the main driver of the colour-magnitude relation in the cluster environment. Here we attempt to address this question using a multi-wavelength appraoch.
In Clemens et al. (2009a) we used Spitzer-IRS peakup imaging at to populate the luminous part of the mid-infrared colour magnitude diagram for the Coma cluster. In Coma, galaxies with K-band magnitudes only as faint as -22 could be studied. In the present paper we repeat the analysis for fainter objects in the Virgo cluster in order to extend the colour-magnitude relation to fainter magnitudes.
2 Data analysis
The aperture photometry for both the IRAC and IRS-peakup images is based on post basic calibration data (PBCD).
The , blue peakup images are background dominated and the background often shows fluctuations on spatial scales similar to the source sizes. Background subtraction techniques that attempt to model the background as the smoothly varying component of an image thus either include extended emission from the galaxy as background or do not correct for the background fluctuations. This tends to cause an over-subtraction of the background in the vicinity of the galaxy. We therefore define the background level, at all wavelengths, to be the median value in an elliptical annulus, of width 1.5 pixels, centred on the galaxy, with semi-major axis and position angle as given by the mean optical diameter catalogued in “Hyperleda”111http://leda.univ-lyon1.fr. Thus we sample the background at twice the radius of the galaxy. This is actually the background estimation technique recommended for IRAC images of extended sources222http://ssc.spitzer.caltech.edu/irac/iracinstrumenthandbook/33/.
Confusing sources, normally in the background, can be problematic, especially at . For meaningful aperture aperture photometry they need to be removed. In some cases the contaminating sources were too close or bright to attempt removal (e.g. vcc 0951). In some cases the detections themselves were not at the catalogued position and so were taken as “suspect” background sources and discarded (e.g. NGC 4366). For the remaining objects that showed nearby contaminating sources we applied an algorithm to remove them which analyzed the pixel distribution in a series of annuli with axis ratio and position angle equal to that of the galaxies. Pixels that deviated by more than a fixed number of standard deviations from the median value were replaced by the median value. The threshold for source removal was varied between two and four standard deviations and was sometimes applied iteratively to achieve the best results. In all cases the results were carefully checked by eye.
Integrated fluxes were taken as the total flux within the background annulus. We stress that these fluxes are measured only for the purposes of determining the mean colour of the galaxies. Given the way in which the background is determined, they are not a good measure of the true integrated fluxes of the objects. The colours of the objects, however, should be robustly determined. When we come to plot the colour-magnitude diagram we will use the total K-band magnitude of the galaxies as given in the 2MASS catalogue, rather than our measurement from the 2MASS K-band image.
Radial colour profiles were determined using a series of elliptical annuli with axis ratios and position angles as given in “Hyperleda”. Before fluxes were measured the two images were first convolved to identical resolutions. This was achieved by convolving each image with the measured PSF of the other. For example, when considering the K-[16] colour the 2MASS K-band image was convolved with the Spitzer blue peakup PSF and the image was convolved with the 2MASS K-band PSF. Instrumental resolutions (FWHM) are 26, 17, 19 and 36 for 2MASS, IRAC 4.5 and and respectively.
The error on the derived fluxes was taken as the quadrature sum of the rms variation within the aperture or annulus and the calibration error, which was taken as 5% for the blue peakup data and 10% for the IRAC data (see the respective instrument handbooks).
All aperture photometry was performed using a custom pipeline written in idl and use was made of the IDL Astronomy User’s Library (Landsman 1995).
3 Results
| Source ID | Type | Ks | |||
|---|---|---|---|---|---|
| vcc0490 | dS0 | -20.1 | |||
| ngc4318 | E | -21.2 | |||
| ngc4322 | dE | -19.4 | |||
| ngc4352 | S0 | -21.4 | |||
| ngc4366 | dE | -19.8 | |||
| vcc0786 | dE | -19.2 | |||
| ngc4387 | E | -22.1 | |||
| vcc0856 | dE | -20.1 | |||
| vcc0940 | dE | -19.4 | |||
| vcc0951 | dE | -19.8 | |||
| ngc4431 | dS0 | -20.9 | |||
| ngc4436 | dE | -20.5 | |||
| vcc1073 | dE | -20.4 | |||
| vcc1087 | dE | -20.3 | |||
| vcc1122 | dE | -19.4 | |||
| ngc4458 | E | -21.8 | |||
| ngc4464 | E | -21.7 | |||
| ngc4467 | E | -20.2 | |||
| vcc1254 | dE | -20.1 | |||
| ngc4482 | dE | -20.7 | |||
| ngc4479 | S0 | -21.5 | |||
| vcc1308 | dE | -18.5 | |||
| vcc1348 | dE | -18.6 | |||
| vcc1422 | E | -20.6 | |||
| vcc1453 | dE | -19.9 | |||
| ngc4515 | E | -21.3 | |||
| ngc4516 | S0 | -21.4 | |||
| vcc1491 | dE | -19.2 | |||
| ngc4406 | E | -25.1 | |||
| ngc4442 | S0 | -23.9 | |||
| ngc4621 | E | -24.5 | |||
| ngc4636 | E | -24.7 |
3.1 Contribution from a central point source in the mid-infrared?
Most ETGs in our sample show negative radial gradients in the K-[16] colour, indicating that the mid-infrared emission is more centrally concentrated than the K-band light. The IRS-spectroscopy of Bressan et al. (2006) has already shown this emission to be extended. However, at there are roughly similar contributions from the photospheric and dusty envelope components (See figure 1 of Clemens et al. 2010) so it remains possible that only the stellar component is extended, while the dusty, excess, component is unresolved. This might be expected if these galaxies contained a dusty torus at their centre, associated with a low luminosity AGN.
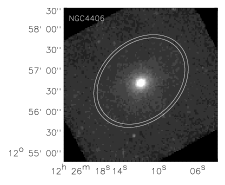
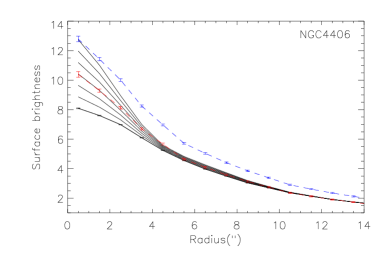
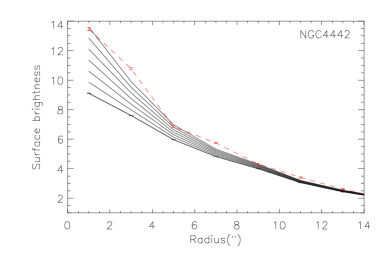
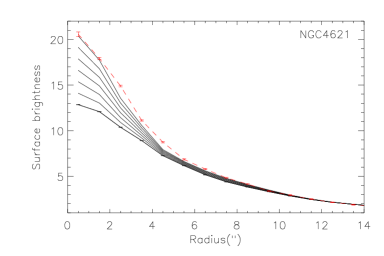
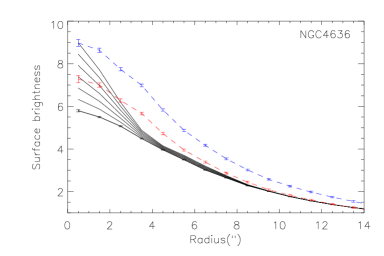
Using HST images, Carollo et al. (1997) interpreted the central dip in the optical surface brightness of NGC 4406 within 04 as evidence of a nuclear dust ring. NGC 4636 is classified as a LINER/Sy 3 and has radio jets at 1.4 and 4.8 GHz (Stanger & Warwick, 1986). Both of these objects, then, show evidence of AGN activity. So is there any emission from a dusty torus at ?
Although Clemens et al. (2009a) found no evidence for central point sources at for the galaxies of Coma, based on effective radii estimates, the spatial resolution was insufficient to investigate this possibility in detail.
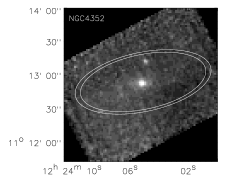
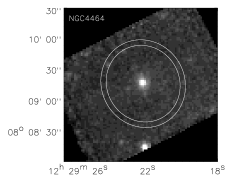
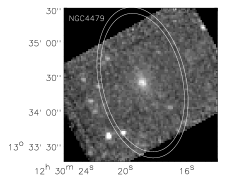
In order to test this possibility we created model images based on the K-band images for the four large galaxies in our sample. We first convolved the K-band images to the same resolution as the observed images, and then added a central point source in the form of the psf. We then measured the radial surface brightness profiles for point sources of various strengths and compared with the observed profiles. The results are illustrated in Fig. 2.
We normalized the models in two different ways. Firstly, to the observed surface brightness at a radius of , so as to be far from any significant PSF effects, and secondly so that the observed central surface brightness was equal to that of the model with a 60% contribution from a point source. The choice of 60% is based on model fits to Spitzer-IRS profiles of passive early-type galaxies that show that approximately this fraction of the emission comes from the dusty circumstellar envelopes of AGB stars (Bressan et al. 2006). If the colour gradient is due to a population gradient involving AGB stars then this would be a sensible upper limit to the extent to which the colour of the nucleus might differ from that at larger radii.
Fig. 2 shows that the observed profiles tend to have shallower gradients than one would expect if a central point source were the cause of the observed colour gradients. Nonetheless, the limited signal-to-noise ratio and spatial resolution of the images means that a central point source is permitted at some level. The most interesting case is NGC 4636 because this contains a radio loud AGN. The observed profile in Fig. 2 is clearly much shallower than would be expected if there were a significant contribution from a central point source. At least for this galaxy, there is no evidence of a significant contribution to the mid-infrared emission from warm dust in a central torus. The observed colour gradient is therefore due to a stellar population gradient. If this is so for an ETG with a known AGN, there seems little evidence that the colour gradients in the other galaxies are due to anything else. A similar conclusion was actually reached for the mid-infrared emission of M 87, where the only excess over purely stellar emission is synchrotron emission from the radio loud nucleus (Buson et al. 2009, Baes et al. 2010).
3.2 Radial colour gradients
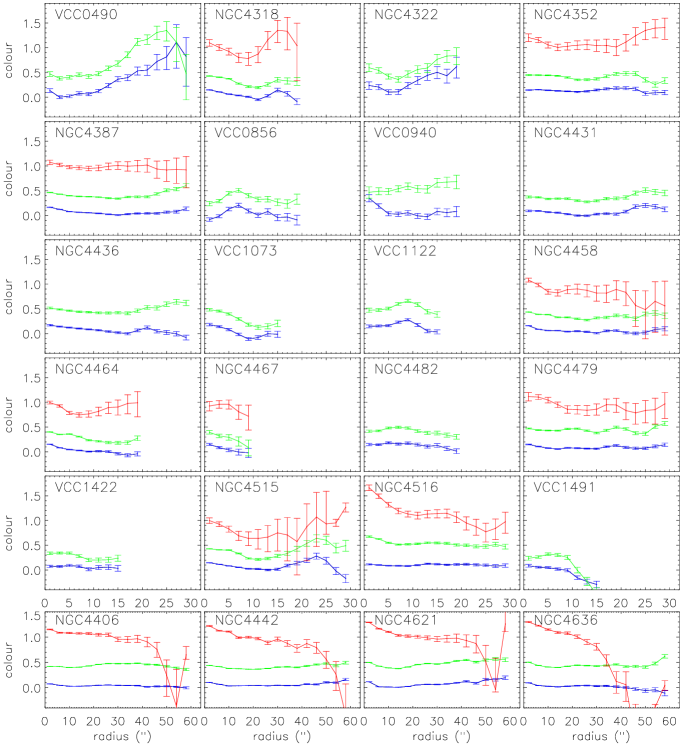
Fig. 3 shows the radial mid-infrared colour profiles, K-[4.5], K-[8] and K-[16]. The signal-to-noise ratio of the images limits the number of galaxies for which the K-[16] colour profile can be plotted, and in general, profiles are truncated before noise becomes dominant. In addition, any objects that had nearby confusing sources have been excluded from the analysis. The 4 brightest galaxies are separated in the figure and have profiles that are well measured within a radius of . We place more emphasis on these objects in the following discussion as the profiles are the most reliable.
For the 4 brightest objects, and for the majority of the fainter galaxies, at least at radii less than , the K-[16] colour shows a negative radial gradient that is steeper than that of either the K-[4.5] or K-[8] gradients. We also see that (with the exception of NGC 4516) the K-[4.5] and K-[8] profiles are very nearly parallel. In several cases, including the brightest galaxies, these profiles are almost flat.
With reference to the model fits to mid-infrared Spitzer-IRS spectra (Bressan et al. 2006) we expect both the 4.5 and micron fluxes to be dominated by emission from stellar photospheres. However, at this changes, with approximately of the emission coming from the hot dusty envelopes around evolved AGB stars. This offers a very natural explanation for the observed difference between the mid-infrared colour profiles, suggesting that the radial distribution of dusty AGB stars is more centrally concentrated than that of the general stellar population.
3.3 Colour–magnitude diagram
Table 1 gives the mid-infrared colours of our sample galaxies determined within the optical radius, as described in section 2.
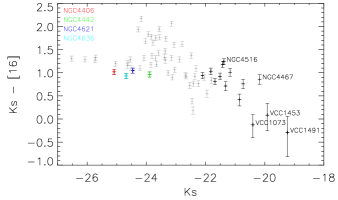
In Fig. 4 we show the mid-infrared colour-magnitude diagram for those Virgo galaxies for which the K-[16] colour could be reliably determined. In light grey we reproduce the values obtained for the Coma cluster by Clemens et al. (2009a). The galaxies observed in the Virgo cluster allow this diagram to be extended to fainter magnitudes than was possible for the Coma cluster alone, with objects down to an absolute K-band magnitude of -19.23.
The colour magnitude relation of the Coma cluster showed a trend for bluer K-[16] colours towards fainter magnitudes. The addition of the fainter Virgo galaxies shows that this trend continues to fainter magnitudes. There appears to be a slight offset between the Coma and Virgo data. Although this could be caused by an error in the relative distance of the two clusters (taken to be 97 and 17 Mpc respectively) it may also be due to the fact that the colours were determined within larger apertures for the Coma cluster. The sense of the offset (Virgo objects appearing with slightly higher than expected K-[16]) is consistent with the colour gradients described in section 3.2.
We also note that the 4 bright Virgo galaxies lie on the low boundary of values of K-[16] found in the Coma cluster. There is no obvious data analysis effect that could have caused such a bias.
4 Discussion
Both age and metallicity can effect the strength of the integrated emission from the dusty envelopes of the AGB population. Younger stellar populations, for example, should have a larger contribution from dusty AGB stellar envelopes. However, in order to separate the effects of age and metallicity we will compare our results with those of studies at optical wavelengths. As discussed in section 1, the different responses of observables in the optical and infrared, to changes in metallicity and age, can be used to resolve the degeneracy between these two parameters.
4.1 Radial colour gradients
As discussed in section 3.1 it seems likely that the radial gradients in the K-[16] colour are due to a population gradient of AGB stars relative to the general stellar population. The redder K-[16] colours toward the centre of the galaxies could be due to younger ages, higher metallicities or both.
Clemens et al. (2009b) have used optical line strength indices of a sample of 14,000 ETGs from the Sloan Digital Sky Survey (SDSS) to determine age and metallicity as a function of mass, environment and also galactic radius. They find negative radial metallicity gradients for all masses. Although they also find positive radial age gradients for massive galaxies this trend is less apparent at intermediate masses and may even invert for low mass galaxies. The 4 bright galaxies in our Virgo cluster sample have central velocity dispersions in the range 170-. In this case little or no age gradient is expected, at least on a statistical basis. Although it must be borne in mind that the results based on the SDSS are statistical in nature, and not necessarily applicable to any individual object, these results would favour metallicity effects over age effects as the cause of the mid-infrared colour gradients.
Negative metallicity gradients and negligible age gradients have, in fact, been found by other studies of ETGs both in the field (Annibali et al, 2007) and cluster (Rawle et al. 2008, Mehlert et al. 2003, Peletier et al. 1999) using optical line strength indices.
4.2 Colour-magnitude relation
Since the work of Bower, Lucey & Ellis (1992) the colour-magnitude relation (its slope and narrowness) has been open to two interpretations. One is that ETGs are all very old and the slope of the colour-magnitude relation reflects a trend for lower mass galaxies to be less metal-rich. The narrowness results from a small dispersion in the formation epoch with respect to the age of the system. In the second interpretation, if the luminosity weighted “average age” is allowed to vary, the only way to maintain a small dispersion is to invoke a synchronization mechanism, in such a way that lower mass ETGs appear younger.
For many years, the metallicity trend had been favoured partly because of its simplicity and partly because of lack of evidence for a relation between mass and age (e.g Kodama et al. 1998). However, recently, numerous studies have found evidence for a so-called “downsizing” effect (e.g. Cimatti, Daddi & Rezini, 2006), which is nothing less than such a relation, in the sense that star formation is more prolonged in galaxies of lower mass. The evidence of the presence of a mechanism that links the mean age of an object to its mass restores some of the original doubt concerning the cause of the narrow colour-magnitude relation.
Studies at optical wavelengths, based on line strength indices, find that less massive galaxies tend to be younger and less metal rich (Bressan et al. 1996, Kuntschner et al. 2001, Thomas et al. 2005, Nelan et al. 2005, Clemens et al. 2006, Smith et al. 2007), both in the field and in the cluster environment. If the age trend holds also for the galaxies in our sample (both in Virgo and in Coma) then for a fixed metallicity, we would expect lower mass galaxies to have more emission per K-band flux relative to the more massive objects, because of the greater importance of the dusty AGB phase. That is, low luminosity objects should have higher values of K-[16] if age were the dominant effect. The observed colour-magnitude relation, however, shows the opposite trend, with lower mass systems having lower K-[16] colours. Metallicity, then, drives the mid-infrared colour-magnitude relation such that stellar populations with lower metallicity emit less flux per unit stellar mass than their more metal-rich and more massive counterparts. In addition, population synthesis modelling of the K-[16] vs V-K colour plane shows that the optical colour-magnitude relation is also driven by a dominant metallicity effect (see Fig.6 of Clemens et al. 2009a). Thus, Spitzer shows that the cluster colour-magnitude relation is a sequence of metallicity rather than age.
Therefore, although a relation between mass and age could exist for our sample galaxies this effect is dominated by a mass-metallicity trend that defines the colour-magnitude relation. Thus, “downsizing”, if present, is of secondary importance in passive ETGs.
The colour-magnitude diagram of the Coma cluster shows several objects that have high fluxes relative to the colour-magnitude relation. None of the ETGs in the present Virgo sample show this. Although the statistics are rather poorer for the Virgo sample and in Virgo we do not sample the luminosity range where these anomalous colours are seen in Coma, this may nonetheless indicate that the rejuvenation events that can be detected in the mid-infrared due to the increased emission, are limited to intermediate mass objects.
5 Conclusions
We have observed a sample of low-luminosity ETGs in the Virgo cluster using the blue peakup detector of Spitzer-IRS. Our aperture photometry of the spatially resolved images can be used to draw the following conclusions.
-
1.
The emission that is in excess of that from stellar photospheres is extended. This emission is therefore consistent with an association with the dusty circumstellar envelopes around evolved AGB stars, rather than from a dusty torus around a low luminosity AGN. This is a more robust conclusion than earlier evidence based on Spitzer-IRS spectroscopy (Bressan et al. 2006).
-
2.
Mid-infrared colour gradients tend to show that the emission is more centrally concentrated than the K-band light. Much shallower colour gradients involving bands dominated by photospheric emission, K-[4.5] and K-[8], imply a population gradient in the AGB stellar population. Comparison with independent studies at optical wavelengths implies that this is a metallicity effect.
-
3.
The mid-infrared colour magnitude relation, that we define over 8 magnitudes by combining with similar data for the Coma cluster, is driven by metallicity. Less massive objects are less metal rich.
-
4.
If there is a relation between galaxy mass and age in these clusters the effect is masked by the dominant metallicity effect. Thus, the mid-infrared colour-magnitude relation, together with optical studies, shows no evidence for so-called “downsizing” in the cluster environment.
-
5.
The lack of objects with K-[16] colours that place them well-above the colour-magnitude relation of passive ETGs in the present Virgo sample, and for the most massive objects in the Coma sample of Clemens et al. (2009a), may be evidence that observable rejuvenation episodes are limited to intermediate mass objects.
Acknowledgments
MC, AB and RR acknowledge support from contract ASI/INAF I/016/07/0.
We acknowledge the usage of the HyperLeda database (http://leda.univ-lyon1.fr).
This work is based on observations made with the Spitzer Space Telescope, which is operated by the JPL, Caltech under a contract with NASA.
We make use of data products from the Two Micron All Sky Survey, which is a joint project of the University of Massachusetts and the Infrared Processing and Analysis Center/California Institute of Technology, funded by the National Aeronautics and Space Administration and the National Science Foundation.
This research has made use of the GOLD Mine Database.
References
- Annibali et al. (2007) Annibali F., Bressan A., Rampazzo R., Zeilinger W. W., Danese L., 2007, A&A, 463, 455
- Arimoto & Yoshii (1986) Arimoto N., Yoshii Y., 1986, A&A, 164, 260
- Athey et al. (2002) Athey A., Bregman J., Bregman J., Temi P., Sauvage M., 2002, ApJ, 571, 272
- Baes et al. (2010) Baes M., et al., 2010, arXiv, arXiv:1010.0787
- Bower, Lucey, & Ellis (1992) Bower R. G., Lucey J. R., Ellis R. S., 1992, MNRAS, 254, 601
- Bressan, Chiosi, & Fagotto (1994) Bressan A., Chiosi C., Fagotto F., 1994, ApJS, 94, 63
- Bressan, Chiosi, & Tantalo (1996) Bressan A., Chiosi C., Tantalo R., 1996, A&A, 311, 425
- Bressan et al. (2006) Bressan A., et al., 2006, ApJ, 639, L55
- Bressan, Granato, & Silva (1998) Bressan A., Granato G. L., Silva L., 1998, A&A, 332, 135
- Buson et al. (2009) Buson L., et al., 2009, ApJ, 705, 356
- Carollo et al. (1997) Carollo C. M., Franx M., Illingworth G. D., Forbes D. A., 1997, ApJ, 481, 710
- Cimatti, Daddi, & Renzini (2006) Cimatti A., Daddi E., Renzini A., 2006, A&A, 453, L29
- Clemens et al. (2006) Clemens M. S., Bressan A., Nikolic B., Alexander P., Annibali F., Rampazzo R., 2006, MNRAS, 370, 702
- Clemens et al. (2009) Clemens M. S., Bressan A., Panuzzo P., Rampazzo R., Silva L., Buson L., Granato G. L., 2009a, MNRAS, 392, 982
- Clemens et al. (2009) Clemens M. S., Bressan A., Nikolic B., Rampazzo R., 2009b, MNRAS, 392, L35
- Clemens et al. (2010) Clemens M. S., et al., 2010, arXiv, arXiv:1005.3056
- Impey, Wynn-Williams, & Becklin (1986) Impey C. D., Wynn-Williams C. G., Becklin E. E., 1986, ApJ, 309, 572
- Kodama et al. (1998) Kodama T., Arimoto N., Barger A. J., Arag’on-Salamanca A., 1998, A&A, 334, 99
- Kuntschner (2000) Kuntschner H., 2000, MNRAS, 315, 184
- Kuntschner et al. (2001) Kuntschner H., Lucey J. R., Smith R. J., Hudson M. J., Davies R. L., 2001, MNRAS, 323, 615
- Landsman (1995) Landsman W. B., 1995, ASPC, 77, 437
- Mehlert et al. (2003) Mehlert D., Thomas D., Saglia R. P., Bender R., Wegner G., 2003, A&A, 407, 423
- Nelan et al. (2005) Nelan J. E., Smith R. J., Hudson M. J., Wegner G. A., Lucey J. R., Moore S. A. W., Quinney S. J., Suntzeff N. B., 2005, ApJ, 632, 137
- Panuzzo et al. (2007) Panuzzo P., et al., 2007, ApJ, 656, 206
- Rawle et al. (2008) Rawle T. D., Smith R. J., Lucey J. R., Swinbank A. M., 2008, MNRAS, 389, 1891
- Smith, Lucey, & Hudson (2007) Smith R. J., Lucey J. R., Hudson M. J., 2007, MNRAS, 381, 1035
- Stanger & Warwick (1986) Stanger V. J., Warwick R. S., 1986, MNRAS, 220, 363
- Thomas et al. (2005) Thomas D., Maraston C., Bender R., Mendes de Oliveira C., 2005, ApJ, 621, 673
- Trager et al. (2000) Trager S. C., Faber S. M., Worthey G., González J. J., 2000, AJ, 119, 1645
- Worthey (1994) Worthey G., 1994, ApJS, 95, 107