Detection of saturated absorption spectroscopy
at high sensitivity with displaced crossovers
Jun Duan, Xianghui Qi, Xiaoji Zhou and Xuzong Chen∗
Institute of Quantum Electronics, School of Electronics Engineering
Computer Science,
Peking University, Beijing 100871, P. R.
China
∗Corresponding author: xuzongchen@pku.edu.cn
Abstract
We present an unconventional experimental approach for detecting the saturated absorption spectroscopy. Using this approach, crossover peaks are displaced, leaving out peaks corresponding to atom’s natural resonant frequencies. Sensitivity of detection could also be enhanced. Consequently the spectrum could reflect energy structure of atoms more explicitly. Without harmful influence from crossovers, locking range of the error signal is significantly increased and symmetry of the dispersion line shape is perfectly reserved, so reliability of frequency stabilization could be improved.
OCIS codes: 300.6210, 300.6260, 020.2930, 140.3425.
Saturated absorption spectroscopy (SAS) is a widely used technique in laser frequency stabilization and atomic physics[1, 2, 3, 4]. Crossovers in such spectrum refer to extra peaks in the middle of those indicating atom’s natural resonant frequencies. They are useful under certain circumstances[5] but can also be undesired in other cases. For instance, in an optical pumped cesium beam frequency standard, the pumping laser is stabilized on the SAS of transitions of 133Cs D2 hyperfine structure. The transition of is the most suitable for obtaining an optimal pumping efficiency[6], but it is near to the crossover of the and the transitions, with a separation of about only 25MHz[7, 8]. This fact brings negative influence for laser frequency stabilization. In general, the smaller energy splitting between upper levels is, the more obvious influence of crossovers is.
In this Letter, we demonstrate a method to avoid the influence of crossovers on spectrum detection and frequency stabilization. We use diode lasers at 780nm to excite transitions of 85Rb D2 hyperfine structure as an example. Crossovers are displaced from their original position to prevent them from overlapping with peaks which indicate atom’s natural resonant frequencies. At the same time more atoms contribute to the amplitude of these peaks. So the spectrum could show energy structure of atom more directly and distinctly in comparison with conventional SAS. Furthermore, error signals obtained from such spectrum have larger locking range and preserve better symmetry of the dispersion line shape. Usage of these error signals could make laser frequency stabilization more reliable.
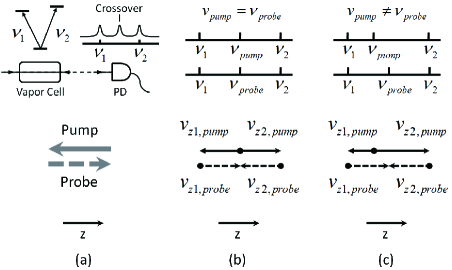
To illustrate the displacement of crossovers in our experiment, we can use a simple model of atom including only two excited states corresponding to resonant frequencies and respectively (FIG. 1(a)). The pump beam and the probe beam pass through the absorbing sample (vapor cell) in opposite directions, we take direction of the probe beam as reference direction.
Peak of crossover appears right at the middle of and in the spectrum. Due to Doppler effect, when the probe beam is tuned at frequency (FIG. 1(b), (c)), it employs atoms with velocity class
| (1) |
to resonate with and atoms with velocity class
| (2) |
to resonate with , where .
In a conventional SAS (FIG. 1(b)), the pump beam and the probe beam come from the same laser, so they always have the same frequency. When the probe beam is tuned at , the pump beam is at this frequency, too. It employs atoms with velocity class
| (3) |
to resonate with and atoms with velocity class
| (4) |
to resonate with . Atoms with velocity classes of which are used by the probe beam are also used by the pump beam, so a peak of crossover appears.
In our approach (FIG. 1(c)), two diode lasers are used to serve as the probe beam and the pump beam independently and frequency of the pump beam is stabilized. They don’t always have the same frequency any more. For example, if , the pump beam employs atoms with velocity class
| (5) |
to resonate with and atoms with velocity class
| (6) |
to resonate with . Atoms used by the probe beam are not used by the pump beam any more, this time when the probe beam is tuned at , no peak will appear at this frequency. In fact, there are still 3 saturated absorption peaks on the probe spectrum, but they appear at different positions, and they are much more distant from each other (detailed discussion will be presented later). In other words, crossover is displaced.
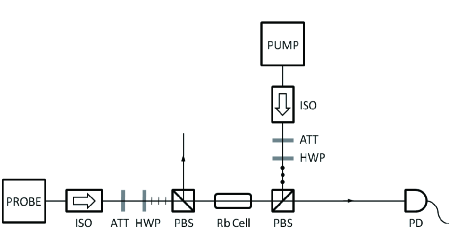
In our experiment (FIG. 2), frequency of the pump beam is stabilized on the peak of transition of 85Rb D2 hyperfine structure which is only little affected by crossovers (the rightmost peak in FIG. 3(a)) using a conventional SAS. Frequency of the probe beam is scanned to get its absorption spectrum. Since the pump laser is stabilized using conventional SAS, this method relies on the stability of not only the probe laser, but also the pump laser. Incident powers into the vapor cell are 0.4 for the probe beam and 48 for the pump beam. Diameters of the two beams are both approximately . Spectrum of the transitions and error signals obtained from the spectrum are presented in FIG. 3. To make a comparison, we present both results obtained from conventional SAS - spectrum (FIG. 3(a)) and its error signals (FIG. 3(b)) and results obtained from our method - spectrum (FIG. 3(c)) and its error signals (FIG. 3(d)). In our experiment, crossovers don’t appear on their original places as previous analysis.
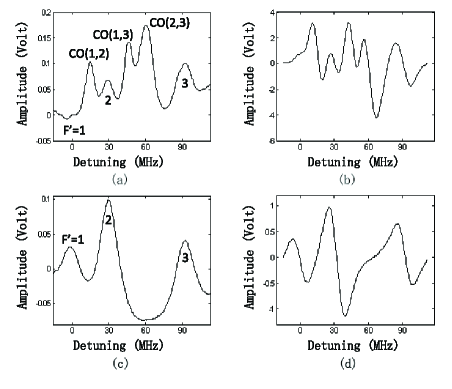
Quality of the spectrum is significantly improved. For example, in a conventional SAS, the peak of transition (the leftmost one in FIG. 3(a)) usually looks far more weak than others[7]. Two reasons lead to this phenomenon. The first reason is that this peak overlaps with the crossover of and (the second one in FIG. 3(a), CO(1,2)). The second reason is that transition probability for this transition is relatively smaller. With our method this problem could be overcame due to the following reasons.
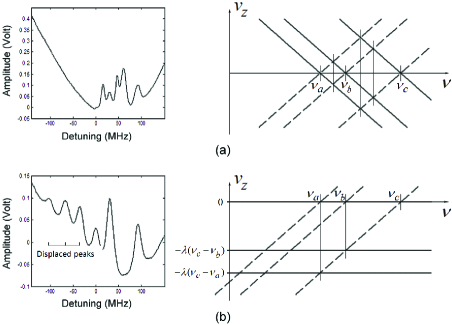
First, the overlap is prevented because there is no crossover in the vicinity of this peak. We can use , and to represent the three natural resonant frequencies in transitions and plot velocity classes of the atoms employed in FIG. 4. Dashed lines represent velocity classes of atoms employed by the probe beam and solid lines represent those of the pump beam. The probe beam employs atoms with velocity classes of either in conventional SAS or in our experiment. The pump beam employs atoms with velocity classes of in conventional SAS (FIG. 4(a)), but because its frequency is fixed to in our experiment, only three velocity classes (corresponding to states with ) of atoms could be excited (FIG. 4(b)). In FIG. 4(a), solid lines and dashed lines have opposite slope because the pump and the probe beam have opposite directions and always the same frequency. Wherever these two types of lines having different intercept on the axis ’cross over’ each other, in other words, when two beams having different resonant frequencies use atoms with the same velocity class, crossover appears. However, In FIG. 4(b) frequency of the pump beam is stabilized so solid lines become horizontal, which lead to the displacement of crossovers from their original place to the left of the spectrum.
Second, more atoms are employed to enhance the sensitivity of detection. When , in FIG. 4(b), the pump beam and the probe beam both use atoms with as well as
| (7) |
where 93MHz is the separation between and [6]. However in FIG. 4(a) only atoms with are used. So roughly twice as many atoms contribute to the peak, compensating the relatively small transition probability. Additionally, is the energy splitting of the upper level, the smaller it is, the more likely overlaps with crossovers take place in conventional SAS. But at the same time smaller splitting leads to smaller velocity in Eq. (7). According to Maxwell velocity distribution, when this velocity is smaller, larger quantity of extra available atoms or larger signal could be attained.
Mechanisms discussed above displace peaks of crossovers and enhance peaks which indicate atom’s natural resonant frequencies, making the spectrum able to show atom’s energy structure directly and distinctly.
Quality of the error signals is also improved. In conventional SAS, three crossovers lead to partial overlaps of the six peaks, consequently locking range of each dispersion line shape is diminished and symmetry of dispersion line shape is destroyed. In our experiment, first the locking range of every dispersion line shape is considerably enlarged (FIG. 3(b), (d)), especially the first two in FIG. 3(d) which once seriously suffered from overlaps with crossovers in conventional SAS. But merely this is not quite enough to make better reliability of frequency stabilization. The locking range can be efficiently used without waste only if symmetry of the line shape is guaranteed, and this is just our second improvement (FIG. 3(d)).
In conclusion, we demonstrated an approach for detecting SAS different from conventional scheme. We use two independent diode lasers as the pump beam and the probe beam to move crossovers and to enhance the sensitivity. The spectrum shows energy levels of atom more explicitly in comparison with conventional SAS, making it helpful for observing peaks usually overlapped with crossovers or peaks corresponding to relatively weak transitions. So this method could be seem as an experimental aid to discover weak transitions submerged in crossovers and to observe incompletely analyzed atoms. Conventional SAS is used to stabilize the pump laser, so usage of this spectrum and corresponding error signal couldn’t lead to better frequency stability than conventional SAS. Fortunately the quality improved error signals could provide larger locking range and symmetry of dispersion line shape, which would significantly enhance the robustness of frequency stabilization.
The authors thank Thibault Vogt’s help with English language. This work is supported by the National Fundamental Research Program of China under Grant No. 2011CB921501, the National Natural Science Foundation of China under Grant No. 61027016, No.61078026, No.10874008 and No.10934010.
References
- [1] V. G. Minogin and V. S. Letokhov, Laser Light Pressure on Atoms (Gordon and Breach, 1987).
- [2] H. J. Metcalf and P. van der Straten, Laser Cooling and Trapping (Springer-Verlag, 1999).
- [3] S. Chu and C. Wieman, ”Laser cooling and trapping of atoms,” J. Opt. Soc. Am. B 6, 2020 (1989).
- [4] O. Schmidt, K.-M. Knaak, R. Wynands, and D. Meschede, ”Cesium saturation spectroscopy revisited: How to reverse peaks and observe narrow resonances,” Appl. Phys. B: Lasers Opt. 59, 167 (1994).
- [5] L. A. Bloomfield, H. Gerhardt, T. W. Hnsch, and S. C. Rand, ”Nonlinear UV-laser spectroscopy of the 2 3S-5 3P transition in 3He and 4He,” Opt. Commun. 42, 247 (1982).
- [6] Daniel A. Steck, ”Rubidium 85 D Line Data,” http://steck.us/alkalidata.
- [7] K. B. MacAdam, A. Steinbach, and C. Wieman, ”A narrow-band tunable diode laser system with grating feedback, and a saturated absorption spectrometer for Cs and Rb,” Am. J. Phys. 60, 1098 (1992).
- [8] Patrick, H. and C. E. Wieman, ”Using diode lasers for atomic physics,” Rev. Sci. Instrum. 62, 2593 (1991).
Informational Fourth Page
References
- [1] V. G. Minogin and V. S. Letokhov, Laser Light Pressure on Atoms (Gordon and Breach, 1987).
- [2] H. J. Metcalf and P. van der Straten, Laser Cooling and Trapping (Springer-Verlag, 1999).
- [3] S. Chu and C. Wieman, ”Laser cooling and trapping of atoms,” J. Opt. Soc. Am. B 6, 2020 (1989).
- [4] O. Schmidt, K.-M. Knaak, R. Wynands, and D. Meschede, ”Cesium saturation spectroscopy revisited: How to reverse peaks and observe narrow resonances,” Appl. Phys. B: Lasers Opt. 59, 167 (1994).
- [5] L. A. Bloomfield, H. Gerhardt, T. W. Hnsch, and S. C. Rand, ”Nonlinear UV-laser spectroscopy of the 2 3S-5 3P transition in 3He and 4He,” Opt. Commun. 42, 247 (1982).
- [6] Daniel A. Steck, ”Rubidium 85 D Line Data,” http://steck.us/alkalidata.
- [7] K. B. MacAdam, A. Steinbach, and C. Wieman, ”A narrow-band tunable diode laser system with grating feedback, and a saturated absorption spectrometer for Cs and Rb,” Am. J. Phys. 60, 1098 (1992).
- [8] Patrick, H. and C. E. Wieman, ”Using diode lasers for atomic physics,” Rev. Sci. Instrum. 62, 2593 (1991).