Orbital occupation and magnetic moments of tetrahedrally coordinated iron in CaBaFe4O7
Abstract
CaBaFe4O7 is a mixed-valent transition metal oxide having both Fe2+ and Fe3+ ions in tetrahedral coordination. Here we characterize its magnetic properties by magnetization measurements and investigate its local electronic structure using soft x-ray absorption spectroscopy at the Fe edges, in combination with multiplet cluster and spin-resolved band structure calculations. We found that the Fe2+ ion in the unusual tetrahedral coordination is Jahn-Teller active with the high-spin configuration having a -like electron for the minority spin. We deduce that there is an appreciable orbital moment of about caused by multiplet interactions, thereby explaining the observed magnetic anisotropy. CaBaFe4O7, a member of the ‘114’ oxide family, offers new opportunities to explore charge, orbital and spin physics in transition metal oxides.
pacs:
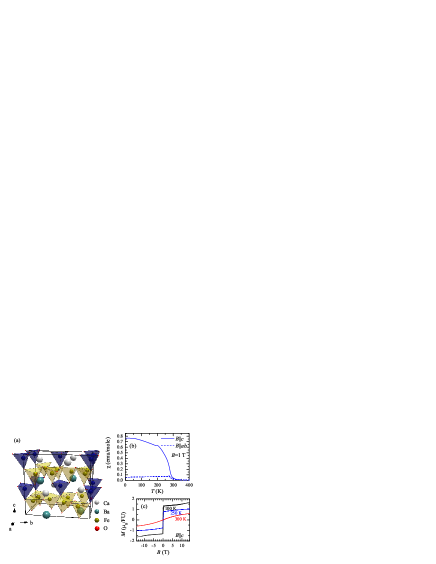
71.70.Ej, 71.70.Ch, 75.25.Dk, 75.30.GwTransition-metal oxides are well known for their strongly correlated electronic structure that brings orbital, spin, and lattice degrees of freedom into close interaction.Tsuda91 The resulting phenomena, among them high- and unconventional superconductivity, colossal magneto resistance, and various kinds of magnetic and orbital order, have been mostly studied in compounds that are based on the perovskite structure.Imada98 Recently, polycrystalline samples of the new material CaBaFe4O7 were synthesized,Raveau et al. (2008) a compound which belongs to the class of Swedenborgites or ‘114’ oxides.Valldor and Andersson (2002); Valldor (2004); Raveau et al. (2009) It is a mixed-valent system containing equal numbers of Fe2+ and Fe3+ ions. Both ions are tetrahedrally coordinated by oxygen atoms. This is especially very rare for an Fe2+ ion and only few materials containing such ions have been studied in detail recently for their physical properties, but these are sulfides.Park et al. (1999); Krimmel et al. (2005); Sarkar et al. (2010) The Fe ions in CaBaFe4O7 constitute a sublattice of alternating kagomé and trigonal layers as shown in Fig. 1 (a). Based on the shorter average Fe-O distances,Raveau et al. (2008) one may expect that the trigonal layers accommodate only Fe3+ ions, leaving the kagomé layers with a 2:1 ratio of Fe2+ and Fe3+ ions. It is not known whether or not there is charge ordering in these kagomé layers.
The orbitals in a tetrahedral FeO4 coordination are split into a low and a high level, and the Fe2+ ion in the high-spin state has an configuration. As one minority-spin electron resides in the two-fold degenerate orbital, the question arises whether or not this degeneracy will be lifted, and if so, which orbital is to be occupied. The presence of such Jahn-Teller activeJahn and Teller (1937); Jahn (1938) ions could lead to interesting orbital physics phenomena, influencing strongly the magnetic properties of the material.Kugel and Khomskii (1982); Tokura and Nagaosa (2000) In this work, we characterize the magnetic properties of CaBaFe4O7 by magnetization measurements and study the orbital and spin physics in the material using a combination of soft x-ray absorption spectroscopy (XAS) and multiplet cluster calculations, supported by additional spin-resolved band structure calculations.
We have succeeded to grow high quality single crystals of CaBaFe4O7 using the floating zone method. Details on the crystal synthesis will be given in a separate paper.valldor10a The XAS experiments were performed at the ID08 beam line at the ESRF in Grenoble, France. The energy resolution was eV at the Fe- edge, with a degree of linear and circular polarization each higher than 99%. The single crystals of CaBaFe4O7 were cleaved in situ in ultra-high vacuum in the low 10-10 mbar range. The Fe- XAS spectra were taken in total electron yield (TEY) mode. Additional measurements have been made on the O edge in the fluorescence yield (FY) mode. The close similarity found between the TEY and FY spectra is evidence that the TEY spectra are truly representative for the bulk material and that the cleaved surfaces are of high quality. Polycrystalline Fe2O3 was measured simultaneously as reference. A high-field magnet with T was used to measure the magnetic circular dichroism (XMCD) in the XAS spectra. The bulk magnetic susceptibility has been measured using a vibrating sample magnetometer in a Physical Properties Measurement System (PPMS) of Quantum Design.
The refinement of single crystal diffraction data yields that the crystal structure is orthorhombic (, with lattice parameters 6.3135 Å, 11.0173 Å, 10.3497 Å).valldor10a In the magnetic susceptibility we observe magnetic ordering at 270 K similar to the data published on polycrystalline samples in Ref. Raveau et al., 2008, but in addition the single crystals exhibit a second ordering temperature at 200 K indicated by a cusp in the curves (Fig. 1). The differences between field- and zero-field-cooled measurements are small, indicating the absence of magnetic degeneracy. The data also show a clear anisotropy with the magnetic easy axis along the direction of the crystal. The magnetic ordering may be described as ‘ferrimagnetic’ like Fe3O4, in the sense that the kagomé layer and the trigonal layer both show canted antiferromagnetic moments that do not compensate. The strong pinning of the moments along the axis seems surprising, as one would expect that the high-spin Fe ions with their half-filled shell (Fe3+ and Fe2+ ) should not carry an orbital moment. Yet we will show below that how the spin-obit coupling via multiplet interactions can generate an appreciable orbital moment, thereby explaining the observed magnetic anisotropy.
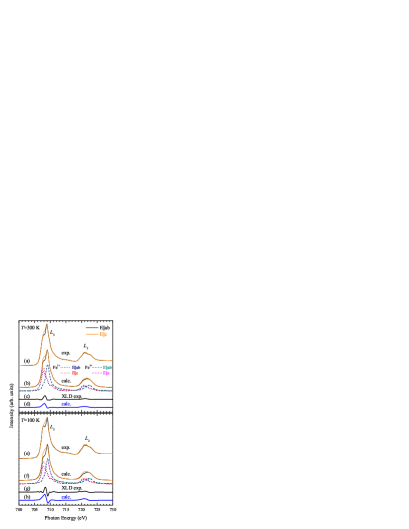
Fig. 2 shows the Fe- XAS spectra of CaBaFe4O7 taken with and . The top panel displays the spectra taken at 300 K, in the paramagnetic phase, while the bottom panel depicts the spectra at 100 K, in the magnetically ordered phase. There is a distinct polarization dependence, which is more pronounced for the magnetically ordered phase. For each temperature, the difference between the two polarizations, labeled XLD (x-ray linear dichroism), is also plotted.
The spectra in Fig. 2 are dominated by the Fe core-hole spin-orbit coupling (SOC) which splits the spectrum roughly in two parts, namely the ( 705-713 eV) and ( 718-725 eV) white line regions. The line shape strongly depends on the multiplet structure given by the Fe 3-3 and 2-3 Coulomb and exchange interactions, as well as by the local crystal fields and the hybridization with the O 2 ligands. Unique to soft XAS is that the dipole selection rules are very sensitive in determining which of the 23 final states can be reached and with what intensity, starting from a particular 23 initial state ( for Fe3+ and for Fe2+).de Groot (1994); Tanaka and Jo (1994); tho (1997) This makes the technique extremely sensitive to the symmetry of the initial state, e.g. the crystal field states of the ions.
The XAS process is furthermore charge sensitive, and the spectra of higher valencies appear at higher photon energies by about 1 eV per difference in electron occupation.Chen and Sette (1990); Mitra et al. (2003) We may therefore expect tentatively that the low-energy shoulder of the white line at 708 eV is due to predominantly the Fe2+, while the higher energy peak at 709 eV comes from the Fe3+ contribution. These tentative assignments are in fact consistent with the XLD observations. It is known that XLD can have its origin in an anisotropy of the orbital occupation and/or in an anisotropy of the spin orientation of the ions under study.tho (1997); Sziszar05 For a Fe3+ ion, however, the spherical high-spin configuration can only produce a significant XLD if macroscopically there is a net spin axis present.Kuiper93 Therefore, the absence of XLD for the 709 eV peak (Fe3+) at 300 K and its appearance at 100 K, are consistent with an XLD signal caused by a magnetic ordering of the Fe3+ ions in going from 300 K to 100 K.
To check the assignments made above, we performed quantitative simulations of the XAS spectra using the configuration-interaction cluster model that includes full atomic-multiplet theory.de Groot (1994); Tanaka and Jo (1994); tho (1997) In these simulations, the multipole parts of Coulomb interaction and the single-particle SOC constant were estimated from Hartree-Fock values that were reduced to 80%. For the monopole parts of the Coulomb interaction and , and the charge-transfer energy , typical values were used;Tanaka and Jo (1994) with the Slater-Koster formalismSlater and Koster (1954) and estimations from Harrison’s descriptionHarrison (1989) the hybridization between Fe and O was taken into account.Fepara The simulations have been carried out using the XTLS 8.3 program.Tanaka and Jo (1994)
The result for the simulations are displayed in Fig. 2. One can observe good general agreement between experiment and calculation: each individual spectrum is well reproduced, i.e., for each of the two polarizations as well as for both temperatures 300 K and 100 K. The XLD is also well described. The simulations confirm that the white line at 708 eV is due to the Fe2+, while the 709 eV peak comes from the Fe3+. We now discuss the origin of the polarization dependence and its implications for the orbital occupation and spin orientation.
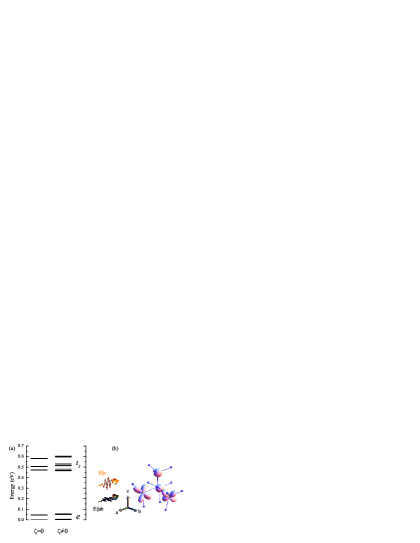
We start with the 300 K spectrum in which the high-spin Fe3+ ion with its spherical 3 configuration does not contribute to the linear dichroism since there is no magnetic ordering at this temperature. The polarization dependence is then caused by the Fe2+ ion only and is related to its anisotropic orbital occupation. This is revealed in Fig. 3 (a), where we display the total energy level diagram of the ion. Looking first at the calculation in which we artificially switch off the spin-orbit interaction , we can observe that there is a Jahn-Teller distortion which split the and manifolds. The lowest state consists of an configuration with the minority-spin electron occupying the local orbital, see Fig. 3 (b). The first excited state has a like symmetry and lies 50 meV higher, i.e. it will only be slightly occupied at 300 K. The XAS intensity will therefore be higher for the light polarization vector parallel to the crystallographic axis than for the perpendicular alignment as we are observing experimentally.
We have checked this order of energy levels by carrying out band structure calculations in the local-spin-density approximation using the Wien2K code.Blaha et al. Specifically, we have set up an impurity calculation by introducing one substitutional Mn2+ ion into one of the Fe2+ sites in the kagomé plane. This charge neutral substitution facilitates the interpretation since Mn2+ has the high-spin closed shell configuration that will not lead to possibly complex inter-orbital interactions as is in the case of Fe2+. Subsequently, we have determined the centers of gravity of the various orbitally-resolved partial densities of states of the Mn ion. The result is that the lowest lying orbital is of the type, with a -like orbital state lying about 50 meV higher energy. These calculations thus support our spectroscopic analysis described above.
The orbital character of the minority-spin electron in the level is not purely : two effects provide mixing with other orbitals. First, SOC mixes character into the levels. This can be seen in the energy-level diagram where multiplets that are degenerate without SOC, see Fig. 3 (a), are split up, see Fig. 3 (b). Second, mixing of orbital character is also caused by the low local symmetry at the Fe2+ site as the FeO4 tetrahedra are distorted with a symmetry lower than . In analyzing the spectra in the magnetically ordered phase at K in Fig. 2 (e), one can observe that the experimental XLD changes slightly at the position of the Fe2+ and that an additional dichroism is created at the Fe3+ peak. This is related to the x-ray magnetic linear dichroism (XMLD) that is induced by the magnetic ordering.Kuiper et al. (1993) In addition, the XMLD effect not only depends on the directional axis of the magnetic moment with respect to the polarization, but also with respect to the local coordination.Arenholz et al. (2007) The XMLD for Fe3+ can be reproduced well by assuming the moments to be canted by away from the axis, as seen in Fig. 2 (f) and (h). The orbital occupation is hardly affected by the magnetic ordering.
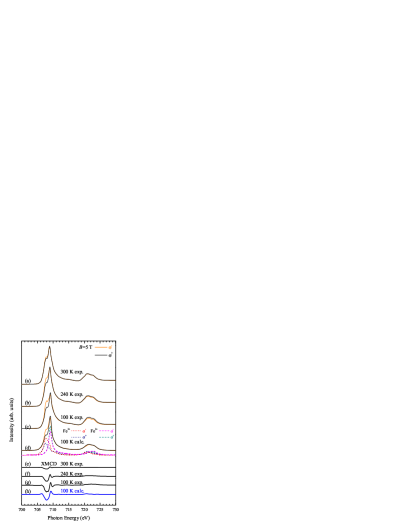
We have carried out XMCD measurements of the Fe- edge, which probe directly the local magnetism of the Fe ions.Thole et al. (1992); Carra et al. (1993); Chen et al. (1995) The external magnetic field was parallel to the axis. The temperature dependence of the XMCD signal (Fig. 4 (e)-(g)) follows clearly the magnetic susceptibility in Fig. 1 (a) and (b), with a strong increase in XMCD signal upon cooling below the first transition at 270 K, and a further increase in the second ordered phase at 100 K. Here, we can also make use of the charge sensitivity of the XAS process: the XMCD signal at around 708 eV is mostly of Fe2+ character, the signal at 709 eV mostly of Fe3+ character. The ‘ferrimagnetic’ ordering of moments is seen in the spectra: the sign of the signal of the two is reversed in respect to each other. From the small XMCD signal at 709 eV we can conclude that the two Fe3+ moments, one in the kagomé and one in the trigonal plane, do not compensate and yield a small net moment. Their net moment opposes the Fe2+ net moment, as can be seen by the sign reversal of the XMCD signal.
Full-multiplet calculations have also been carried out to analyze the XMCD data. We have used parameters identical to the ones used in the simulations of the XLD spectra described above. The results are shown in Fig. 4 (d) and (h). The agreement with the experiment is very satisfactory, confirming that we have obtained an accurate understanding of the local electronic structure of the Fe ions. From these calculations, we can also extract the magnetic properties in the form of the spin and orbital contributions to the local moment. Along the easy axis, the expectation value of the spin for the Fe2+ ions is , i.e. near the spin-only value of two. Interestingly, the Fe2+ ions each have also an additional orbital moment of . This is caused by the SOC mixing the and orbitals, which is not negligible since the energy difference between and orbitals is rather small in tetrahedral coordination as compared to octahedral coordination. The local distortion may cause a pronounced single ion anisotropy. As different Fe2+ sites have their respective easy magnetic axes, canting of the magnetic moments of Fe2+ can occur due to these single ion anisotropies.
In conclusion, we have determined experimentally the local electronic structure of CaBaFe4O7 using x-ray absorption spectroscopy. Detailed information have been obtained from the linear and magnetic circular dichroic signals in the spectra. From the simulations using the full-multiplet cluster model, we deduce that the Fe2+ with its high spin orbital occupation undergoes an Jahn-Teller distortion which stabilizes a local -like orbital state. The local distortion of the FeO4 tetrahedra and the spin-orbit coupling mix in some character into this -like state. This induces an orbital contribution to the local magnetic moment and causing magnetic anisotropy, which is in accordance to the bulk magnetic measurements. An arrangement of the magnetic moments was proposed.
We gratefully acknowledge the ESRF staff for providing us with beamtime. The research in Cologne is supported by the DFG through SFB 608. N. H. is further supported by the Bonn-Cologne Graduate School.
References
- (1) for a review see: Electronic Conduction in Oxides by N. Tsuda, K. Nasu, A. Yanase, and K. Siratori, Springer Series in Solid-State Sciences 94, (Springer Verlag, Berlin 1991)
- (2) for a review see: M. Imada, A. Fujimori, and Y. Tokura, Rev. Mod. Phys. 70, 1039 (1998)
- Raveau et al. (2008) B. Raveau, V. Caignaert, V. Pralong, D. Pelloquin, and A. Maignan, Chem. Mat. 20, 6295 (2008).
- Valldor and Andersson (2002) M. Valldor and M. Andersson, Solid State Sciences 4, 923 (2002).
- Valldor (2004) M. Valldor, Solid State Sciences 6, 251 (2004).
- Raveau et al. (2009) B. Raveau, V. Caignaert, V. Pralong, and A. Maignan, Z. Anorg. Allg. Chem. 635, 1869 (2009).
- Park et al. (1999) M. S. Park, S. K. Kwon, S. J. Youn, and B. I. Min, Phys. Rev. B 59, 10018 (1999).
- Krimmel et al. (2005) A. Krimmel, M. Mücksch, V. Tsurkan, M. M. Koza, H. Mutka, and A. Loidl, Phys. Rev. Lett. 94, 237402 (2005).
- Sarkar et al. (2010) S. Sarkar, T. Maitra, R. Valentí, and T. Saha-Dasgupta, Phys. Rev. B 82, 041105 (2010).
- Jahn and Teller (1937) H. A. Jahn and E. Teller, Proc. R. Soc. Lond. A 161, 220 (1937).
- Jahn (1938) H. A. Jahn, Proc. R. Soc. Lond. A 164, 117 (1938).
- Kugel and Khomskii (1982) K. I. Kugel and D. I. Khomskii, Sov. Phys. Usp. 25, 231 (1982).
- Tokura and Nagaosa (2000) Y. Tokura and N. Nagaosa, Science 288, 463 (2000).
- (14) N. Qureshi et al. (to be published).
- de Groot (1994) F. M. F. de Groot, Journal of Electron Spectroscopy and Related Phenomena 67, 529 (1994).
- Tanaka and Jo (1994) A. Tanaka and T. Jo, J. Phys. Soc. Jpn. 63, 2788 (1994).
- tho (1997) See the ‘Theo Thole Memorial Issue’, J. Electron. Spectrosc. Relat. Phenom. 86, 1 (1997).
- Chen and Sette (1990) C. T. Chen and F. Sette, Phys. Scr. T31, 119 (1990).
- Mitra et al. (2003) C. Mitra, Z. Hu, P. Raychaudhuri, S. Wirth, S. I. Csiszar, H. H. Hsieh, H.-J. Lin, C. T. Chen, and L. H. Tjeng, Phys. Rev. B 67, 092404 (2003).
- (20) S. I. Csiszar, M. W. Haverkort, Z. Hu, A. Tanaka, H. H. Hsieh, H.-J. Lin, C. T. Chen, T. Hibma, and L. H. Tjeng, Phys. Rev. Lett. 95, 187205 (2005).
- (21) P. Kuiper, B. G. Searle, P. Rudolf, L. H. Tjeng, and C. T. Chen, Phys. Rev. Lett. 70, 1549 (1993).
- Slater and Koster (1954) J. C. Slater and G. F. Koster, Phys. Rev. 94, 1498 (1954).
- Harrison (1989) W. Harrison, Electronic Structure and the Properties of Solids (Dover, New York, 1989).
- (24) Parameters for Fe3+ [eV]: , , ; for Fe2+: , , , .
- (25) P. Blaha, K. Schwarz, G. Madsen, D. Kvasnicka, and J. Luitz, http://www.wien2k.at.
- Kuiper et al. (1993) P. Kuiper, B. G. Searle, P. Rudolf, L. H. Tjeng, and C. T. Chen, Phys. Rev. Lett. 70, 1549 (1993).
- Arenholz et al. (2007) E. Arenholz, G. van der Laan, R. V. Chopdekar, and Y. Suzuki, Phys. Rev. Lett. 98, 197201 (2007).
- Thole et al. (1992) B. T. Thole, P. Carra, F. Sette, and G. van der Laan, Phys. Rev. Lett. 68, 1943 (1992).
- Carra et al. (1993) P. Carra, B. T. Thole, M. Altarelli, and X. Wang, Phys. Rev. Lett. 70, 694 (1993).
- Chen et al. (1995) C. T. Chen, Y. U. Idzerda, H.-J. Lin, N. V. Smith, G. Meigs, E. Chaban, G. H. Ho, E. Pellegrin, and F. Sette, Phys. Rev. Lett. 75, 152 (1995).