EUROPEAN ORGANIZATION FOR NUCLEAR RESEARCH
CERN-PH-EP-2010-051
22 November 2010
New measurement of the decay
The NA48/2 Collaboration 111Copyright CERN for the benefit of the
Collaboration.
Abstract
A sample of 3120 decay candidates with background contamination has been collected by the NA48/2 experiment at the CERN SPS, allowing a detailed study of the decay properties. The branching ratio was measured to be . The form factor , where , was parameterized according to several models. In particular, the slope of the linear form factor was measured to be . Upper limits of and on possible charge asymmetry and forward-backward asymmetry were established at CL. An upper limit was established at CL for the rate of the lepton number violating decay.
To be submitted for publication in Physics Letters B
The NA48/2 Collaboration
J.R. Batley,
G. Kalmus,
C. Lazzeroni 111University of Birmingham, Edgbaston, Birmingham,
B15 2TT, UK,
D.J. Munday,
M.W. Slater 111University of Birmingham, Edgbaston, Birmingham,
B15 2TT, UK,
S.A. Wotton
Cavendish Laboratory, University of Cambridge, Cambridge, CB3 0HE, UK 222Corresponding author, email: eg@hep.ph.bham.ac.uk
R. Arcidiacono 333Dipartimento di Fisica Sperimentale dell’Università e Sezione dell’INFN di Torino, I-10125 Torino, Italy, G. Bocquet, N. Cabibbo 444Università di Roma “La Sapienza” e Sezione dell’INFN di Roma, I-00185 Roma, Italy, A. Ceccucci, D. Cundy 555Istituto di Cosmogeofisica del CNR di Torino, I-10133 Torino, Italy, V. Falaleev, M. Fidecaro, L. Gatignon, A. Gonidec, W. Kubischta, A. Norton 666Dipartimento di Fisica dell’Università e Sezione dell’INFN di Ferrara, I-44100 Ferrara, Italy, A. Maier,
M. Patel 777Department of Physics, Imperial College, London, SW7 2BW, UK, A. Peters
CERN, CH-1211 Genève 23, Switzerland
S. Balev 888CERN, CH-1211 Genève 23, Switzerland, P.L. Frabetti, E. Goudzovski 222Corresponding author, email: eg@hep.ph.bham.ac.uk111University of Birmingham, Edgbaston, Birmingham, B15 2TT, UK, P. Hristov 888CERN, CH-1211 Genève 23, Switzerland, V. Kekelidze, V. Kozhuharov 999Faculty of Physics, University of Sofia “St. Kl. Ohridski”, 5 J. Bourchier Blvd., 1164 Sofia, Bulgaria, L. Litov, D. Madigozhin, E. Marinova 101010Sezione dell’INFN di Perugia, I-06100 Perugia, Italy, N. Molokanova, I. Polenkevich,
Yu. Potrebenikov, S. Stoynev 111111Northwestern University, 2145 Sheridan Road, Evanston, IL 60208, USA, A. Zinchenko
Joint Institute for Nuclear Research, 141980 Dubna, Moscow region, Russia
E. Monnier 121212Centre de Physique des Particules de Marseille, IN2P3-CNRS, Université de la Méditerranée, F-13288 Marseille, France, E. Swallow, R. Winston
The Enrico Fermi Institute, The University of Chicago,
Chicago, IL 60126, USA
P. Rubin 131313Department of Physics and Astronomy, George Mason
University, Fairfax, VA 22030, USA,
A. Walker
Department of Physics and Astronomy, University of Edinburgh, JCMB King’s Buildings, Mayfield Road, Edinburgh, EH9 3JZ, UK
W. Baldini, A. Cotta Ramusino, P. Dalpiaz, C. Damiani, M. Fiorini 888CERN, CH-1211 Genève 23, Switzerland, A. Gianoli, M. Martini, F. Petrucci, M. Savrié, M. Scarpa, H. Wahl
Dipartimento di Fisica dell’Università e Sezione dell’INFN di Ferrara, I-44100 Ferrara, Italy
A. Bizzeti 141414Dipartimento di Fisica, Università di Modena e Reggio Emilia, I-41100 Modena, Italy, M. Lenti, M. Veltri 151515Istituto di Fisica, Università di Urbino, I-61029 Urbino, Italy
Sezione dell’INFN di Firenze, I-50125 Firenze, Italy
M. Calvetti, E. Celeghini, E. Iacopini, G. Ruggiero 161616Scuola Normale Superiore, I-56100 Pisa, Italy
Dipartimento di Fisica dell’Università e Sezione dell’INFN di Firenze, I-50125 Firenze, Italy
M. Behler, K. Eppard, K. Kleinknecht, P. Marouelli, L. Masetti, U. Moosbrugger, C. Morales Morales, B. Renk, M. Wache, R. Wanke, A. Winhart
Institut für Physik, Universität Mainz, D-55099 Mainz, Germany 171717Funded by the German Federal Minister for Education and research under contract 05HK1UM1/1
D. Coward 181818SLAC, Stanford University, Menlo Park, CA 94025, USA, A. Dabrowski 888CERN, CH-1211 Genève 23, Switzerland, T. Fonseca Martin 191919Laboratory for High Energy Physics, CH-3012 Bern, Switzerland, M. Shieh, M. Szleper,
M. Velasco, M.D. Wood 202020UCLA, Los Angeles, CA 90024, USA
Department of Physics and Astronomy, Northwestern
University, Evanston, IL 60208, USA
P. Cenci,
M. Pepe,
M.C. Petrucci
Sezione dell’INFN di Perugia, I-06100 Perugia, Italy
G. Anzivino, E. Imbergamo, A. Nappi, M. Piccini, M. Raggi 212121Laboratori Nazionali di Frascati, via E. Fermi, 40, I-00044 Frascati (Rome), Italy, M. Valdata-Nappi
Dipartimento di Fisica dell’Università e Sezione dell’INFN di Perugia, I-06100 Perugia, Italy
C. Cerri, R. Fantechi
Sezione dell’INFN di Pisa, I-56100 Pisa, Italy
G. Collazuol, L. DiLella, G. Lamanna 888CERN, CH-1211 Genève 23, Switzerland, I. Mannelli, A. Michetti
Scuola Normale Superiore e Sezione dell’INFN di Pisa, I-56100 Pisa, Italy
F. Costantini, N. Doble, L. Fiorini 222222Institut de Física d’Altes Energies, UAB, E-08193 Bellaterra (Barcelona), Spain, S. Giudici, G. Pierazzini, M. Sozzi, S. Venditti
Dipartimento di Fisica dell’Università e Sezione dell’INFN di Pisa, I-56100 Pisa, Italy
B. Bloch-Devaux 232323Dipartimento di Fisica Sperimentale dell’Università di Torino, I-10125 Torino, Italy, C. Cheshkov 242424Institut de Physique Nucleaire de Lyon, IN2P3-CNRS, Universite Lyon I, F-69622 Villeurbanne, France, J.B. Chèze, M. De Beer, J. Derré, G. Marel, E. Mazzucato, B. Peyaud, B. Vallage
DSM/IRFU – CEA Saclay, F-91191 Gif-sur-Yvette, France
M. Holder, M. Ziolkowski
Fachbereich Physik, Universität Siegen, D-57068 Siegen, Germany 252525Funded by the German Federal Minister for Research and Technology (BMBF) under contract 056SI74
C. Biino, N. Cartiglia, F. Marchetto
Sezione dell’INFN di Torino, I-10125 Torino, Italy
S. Bifani 262626University College Dublin School of Physics, Belfield, Dublin 4, Ireland, M. Clemencic 888CERN, CH-1211 Genève 23, Switzerland, S. Goy Lopez 272727Centro de Investigaciones Energeticas Medioambientales y Tecnologicas, E-28040 Madrid, Spain
Dipartimento di Fisica Sperimentale dell’Università e
Sezione dell’INFN di Torino,
I-10125 Torino, Italy
H. Dibon, M. Jeitler, M. Markytan, I. Mikulec, G. Neuhofer, L. Widhalm
Österreichische Akademie der Wissenschaften, Institut
für Hochenergiephysik,
A-10560 Wien, Austria 282828Funded by the Austrian Ministry for Traffic and
Research under the contract GZ 616.360/2-IV GZ 616.363/2-VIII, and
by the Fonds für Wissenschaft und Forschung FWF Nr. P08929-PHY
Introduction
The flavour-changing neutral current decays (denoted below, ), induced at the one-loop level in the Standard Model (SM), are well suited to explore its structure and, possibly, its extensions. The rates of these transitions are dominated by the long-distance contributions involving one photon exchange. They have been described in the framework of Chiral Perturbation Theory (ChPT) [1] in terms of a vector interaction form factor (which characterizes the dilepton invariant mass spectrum) determined by experimental measurements. Several models for form factor have been proposed [2, 3, 4].
The first experimental observation of the process was published by the BNL E787 collaboration in 1997 [5]. It was followed by a BNL E865 measurement [6] which established the vector nature of the decay, and found the form factor and the decay rate to be in agreement with the expectation based on the earlier measurements [7, 8]. The most stringent upper limit on the rate of the lepton number violating decay also comes from the E865 experiment [9]. Later the HyperCP experiment analysed samples of both and decays [10], which, in addition to decay rate measurements, allowed setting a limit on the CP violating rate asymmetry. The total sample collected by the three experiments amounts to candidates.
A new measurement of the decay based on the data collected by the NA48/2 experiment at the CERN SPS in 2003–2004 is reported in this letter. The event sample is times larger than the total world sample, and has low background contamination, allowing form factor, rate and asymmetry measurements at an improved precision.
1 The NA48/2 experiment
The NA48/2 experiment, specifically designed for charge asymmetry measurements [11], uses simultaneous and beams produced by 400 GeV/ primary SPS protons impinging on a beryllium target. Beam particles with momentum GeV/ (r.m.s.) are selected by an achromatic system of four dipole magnets with zero total deflection (‘achromat’), which splits the two beams in the vertical plane and then recombines them on a common axis. The beams pass through momentum defining collimators and a series of four quadrupoles designed to focus the beams at the detector entrance plane. Finally the two beams are again split in the vertical plane and recombined in a second achromat.
The beams enter the fiducial decay volume housed in a 114 m long cylindrical vacuum tank with a diameter of 1.92 m upstream, increasing to 2.4 m downstream. Both beams follow the same path in the decay volume: their axes coincide within 1 mm, while the transverse size of the beams is about 1 cm. With protons incident on the target per SPS spill of about s duration, the positive (negative) beam flux at the entrance of the decay volume is () particles per pulse, of which () are (). The flux ratio is 1.79. The fraction of beam kaons decaying in the vacuum tank at nominal momentum is .
A detailed description of the NA48 detector can be found in Ref. [12]. The decay volume is followed by a magnetic spectrometer housed in a tank filled with helium at nearly atmospheric pressure, separated from the vacuum tank by a thin () window. A thin-walled aluminium beam pipe of 16 cm outer diameter traversing the centre of the spectrometer (and all the following detector elements) allows the undecayed beam particles and the muon halo from decays of beam pions to continue their path in vacuum. The spectrometer consists of four octagonal drift chambers (DCH) composed of eight planes of sense wires: DCH1, DCH2 located upstream, and DCH3, DCH4 downstream of a dipole magnet. The magnet provides a horizontal transverse momentum kick for charged particles. The spatial resolution of each DCH is m. The momentum resolution of the spectrometer is ( in GeV/).
A plastic scintillator hodoscope (HOD) used to produce fast trigger signals and to provide precise time measurements of charged particles is placed after the spectrometer. The HOD has a regular octagonal shape, and consists of a plane of vertical strip-shaped counters followed by a plane of horizontal ones (128 counters in total).
The HOD is followed by a liquid krypton electromagnetic calorimeter (LKr) used for particle identification in the present analysis. It is an almost homogeneous ionization chamber with an active volume of 7 m3 of liquid krypton, segmented transversally into 13248 projective cells, approximately 22 cm2 each, deep and with no longitudinal segmentation. The transverse sizes of the HOD, DCHs and LKr are about 2.4 m.
A muon detector (MUV) essential for muon identification in the present analysis is located further downstream. The MUV is composed of three planes of plastic scintillator strips (aligned horizontally in the first and last planes, and vertically in the middle plane) read out by photomultipliers at both ends. Each strip is 2.7 m long and 1 cm thick. The widths of the strips are 25 cm in the first two planes, and 45 cm in the third plane. The MUV is also preceded by a hadronic calorimeter (not used for the present measurement), which is an iron-scintillator sandwich with a total iron thickness of 1.2 m. Each MUV plane is preceded by an additional 0.8 m thick iron absorber.
A dedicated two-level trigger has been designed for collection of three-track decays. A description of the trigger algorithm and the sources of its inefficiency, which is typically at the level and is therefore negligible for the present analysis, can be found in Ref. [11].
A detailed GEANT3-based [13] Monte Carlo (MC) simulation which includes full detector geometry and material description, stray magnetic fields, DCH local inefficiencies and misalignment, detailed simulation of the kaon beam line, and time variations of the above throughout the running period is used to compute the acceptances for signal, normalisation, and background channels.
2 Event selection
The rate is measured relative to the abundant normalisation channel (denoted below). The and samples are collected concurrently using the same trigger logic. The fact that the and masses are close () results in similar topologies of the signal and normalisation final states. This leads to first order cancellation of the systematic effects induced by imperfect kaon beam description, local detector inefficiencies, and trigger inefficiency.
Selection conditions
Three-track vertices (compatible with either or decay topology) are reconstructed by extrapolation of track segments from the spectrometer upstream into the decay volume, taking into account the measured Earth’s magnetic field, stray fields due to magnetization of the vacuum tank, and multiple scattering.
The selection procedures for the and modes have a large common part: the presence of a vertex satisfying the following criteria is required.
-
•
The vertex longitudinal position is within the fiducial decay volume (i.e. downstream the final collimator).
-
•
The vertex tracks are required to be consistent in time (within a 10 ns time window), consistent with the trigger time, and to be in DCH, HOD, LKr and MUV geometric acceptances. Track momenta are required to be above 10 GeV/ to ensure high muon identification efficiency. Track separations are required to exceed 2 cm in the DCH1 plane to suppress photon conversions, and 20 cm in the LKr front plane to minimize particle misidentification due to shower overlaps.
-
•
The total charge of the three tracks is .
-
•
The total momentum of the three tracks is consistent with the beam nominal range: .
-
•
The total transverse momentum of the three tracks with respect to the mean beam direction (which is precisely measured using the sample) is .
If several vertices satisfy the above conditions, the one with the lowest fit is considered. The candidates are then selected using the following particle identification and kinematic criteria.
-
•
The vertex is required to be composed of one candidate (with the ratio of energy deposition in the LKr calorimeter to momentum measured by the spectrometer , which suppresses electrons, and no in-time associated hits in the MUV), and a pair of oppositely charged candidates (with and associated hits in the first two planes of the MUV). The muon identification efficiency has been measured to be above for GeV/, and above for GeV/.
-
•
The invariant mass of the three tracks in the hypothesis lies in the range , where is the nominal charged kaon mass.
Independently, the following criteria are applied to select the sample.
-
•
The pion identification criterion described above is applied to a single pion only, to symmetrize the selection of the signal and normalisation modes and diminish the corresponding systematic uncertainties.
-
•
The invariant mass of the three tracks in the hypothesis lies in the range .
No restrictions are applied to the additional energy deposition in the LKr calorimeter, which decreases sensitivity to accidental activity.
Signal sample
The reconstructed invariant mass spectrum is presented in Fig. 1a: a decay signal is observed. The number of candidates in the signal region is , of which 2003 (1117) are () candidates. The measured resolution is MeV/, in agreement with MC simulation.
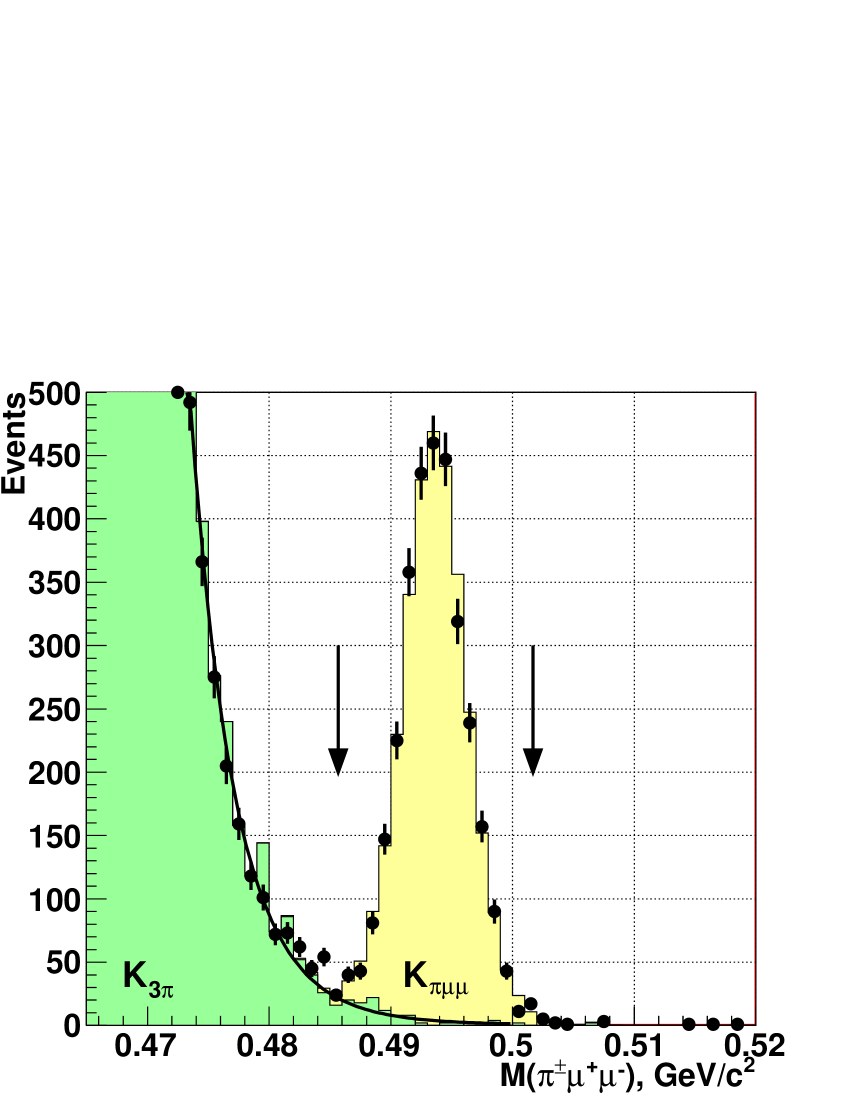
The decay is the only significant background source. It contributes either via in flight decays of the two pions (), or via a decay of a single pion and misidentification of another pion as a muon. Only pion decays resulting in muons almost collinear to the pion direction, and thus consistent with a three-track vertex and satisfying the total and transverse momentum requirements, contribute to background.
Three methods of background evaluation are considered.
-
•
Owing to the symmetry properties of the detector, the kinematic distribution of the background events is to a good approximation identical to that of the reconstructed lepton number violating “wrong muon sign” (WS) candidates multiplied by a factor of 2. This observation allows to estimate the background contamination as , where the quoted statistical uncertainty is due to the limited number of data WS candidates (), and the systematic uncertainty is discussed below.
-
•
MC simulation of the sample leads to a background estimate of . This method also gives an estimate of the expected number of WS data events in the signal region: . The quoted uncertainties are systematic due to the limited precision of MC description of the high-mass region. They have been estimated from the level of data/MC agreement in the control reconstructed mass region of (465; 485) MeV/.
-
•
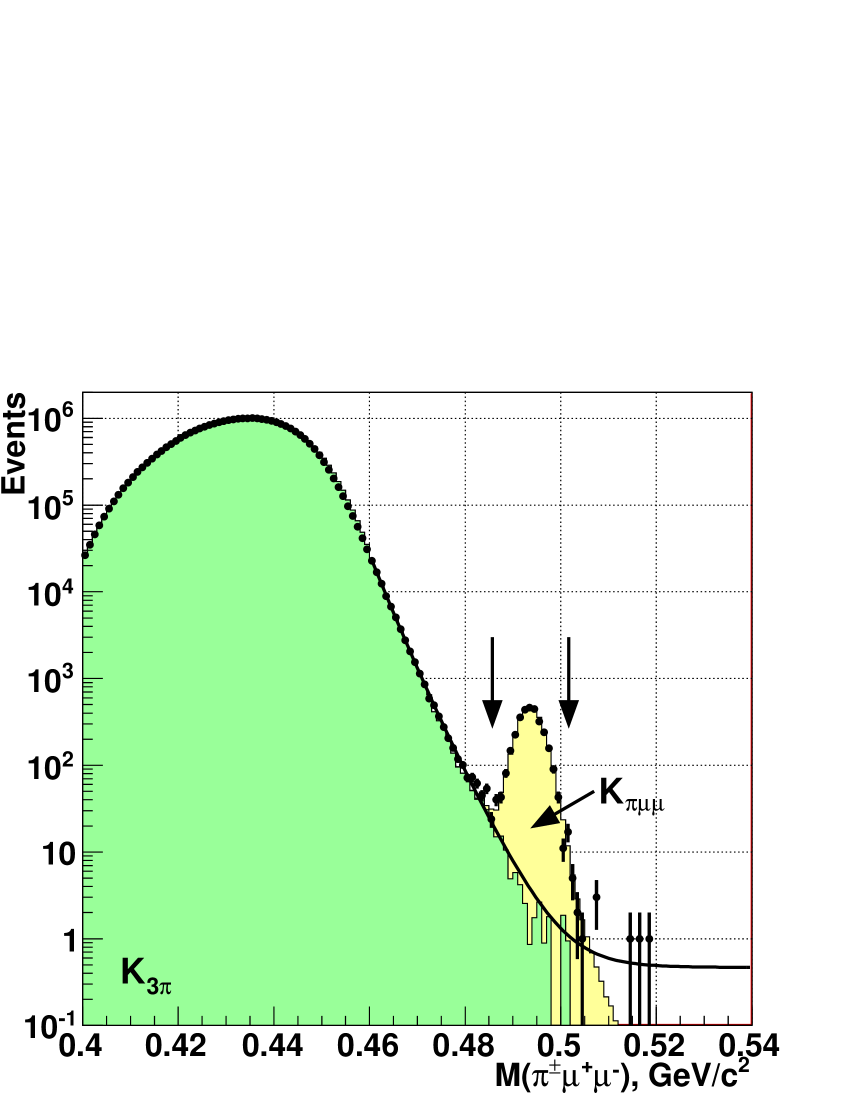
Fitting the mass spectrum in the region between 460 and 520 , excluding the signal region between 485 and 502 , with an empirical function (similar to that used in the E865 analysis [6, 9]: a constant plus an exponentiated cubic polynomial) using the maximum likelihood estimator and assuming a Poisson probability density in each bin leads to a background estimate of 3.1%.
The first method is considered the most reliable, and is used in the subsequent analysis. The background estimated with the WS and extrapolation methods is shown in Fig. 1a. The degree of agreement of the three background estimation methods is demonstrated in Fig. 2.
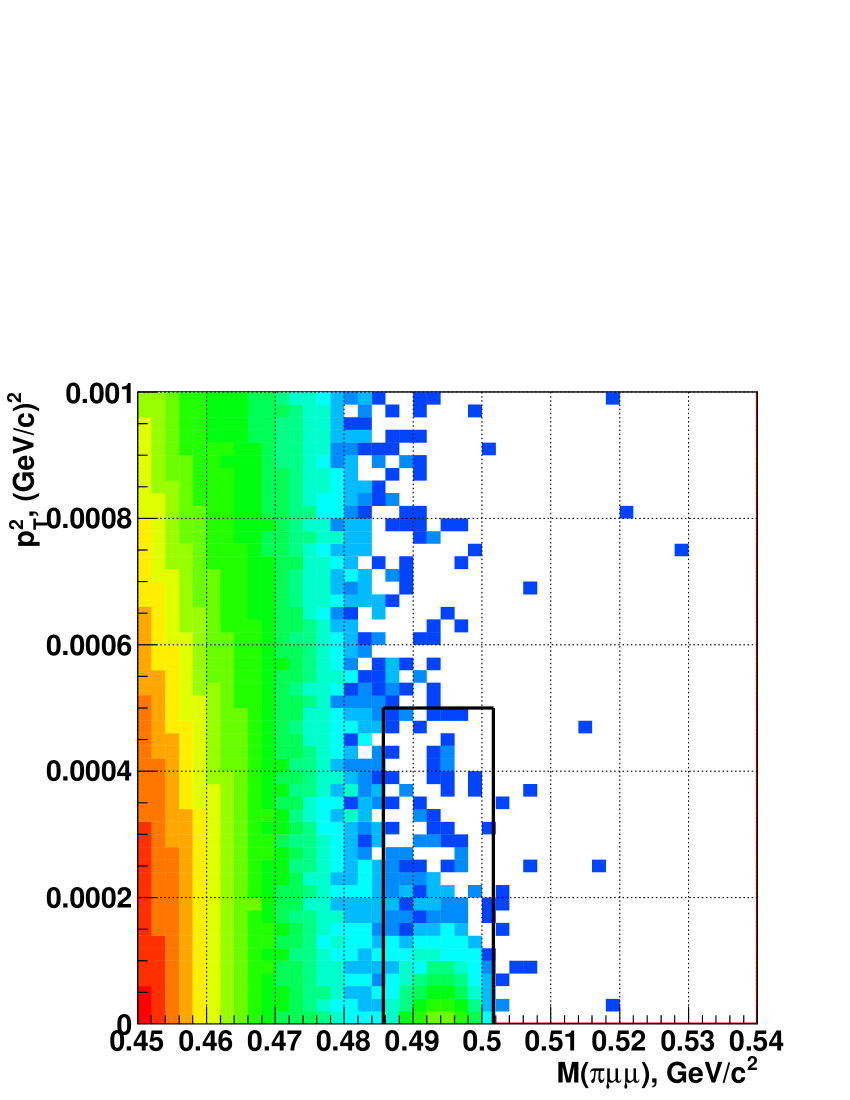
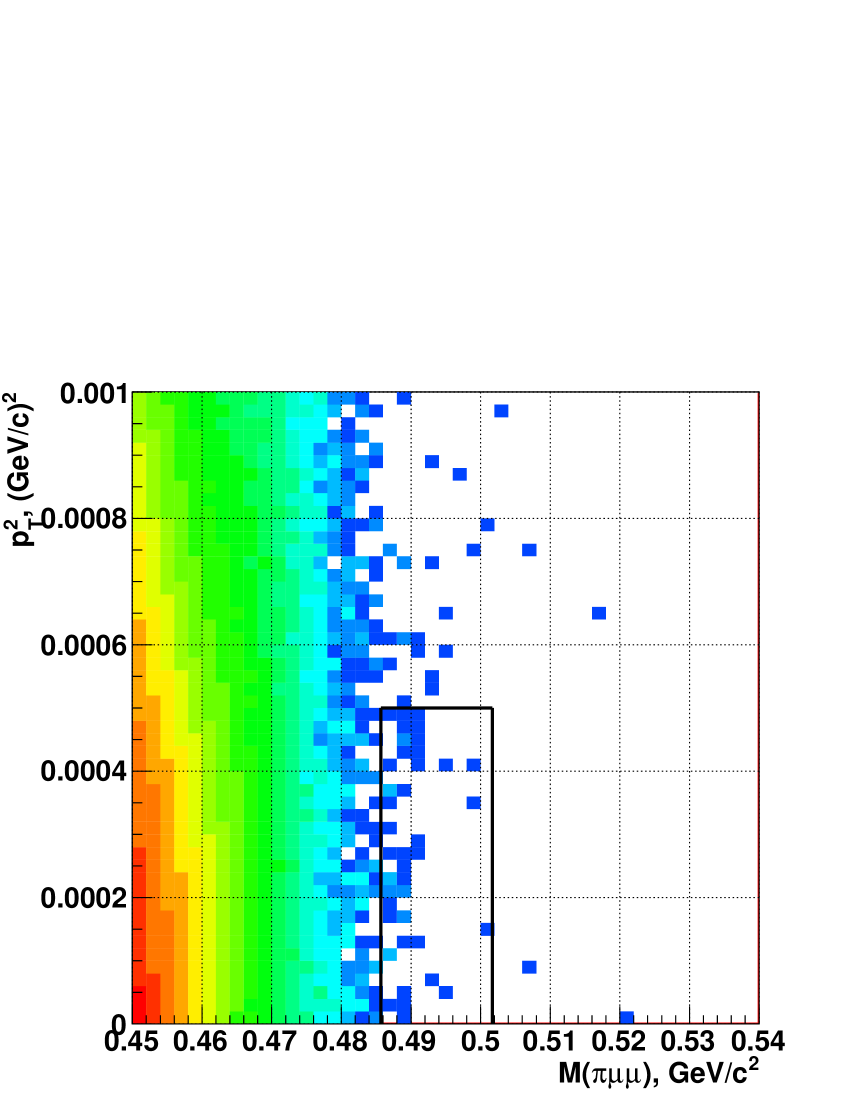
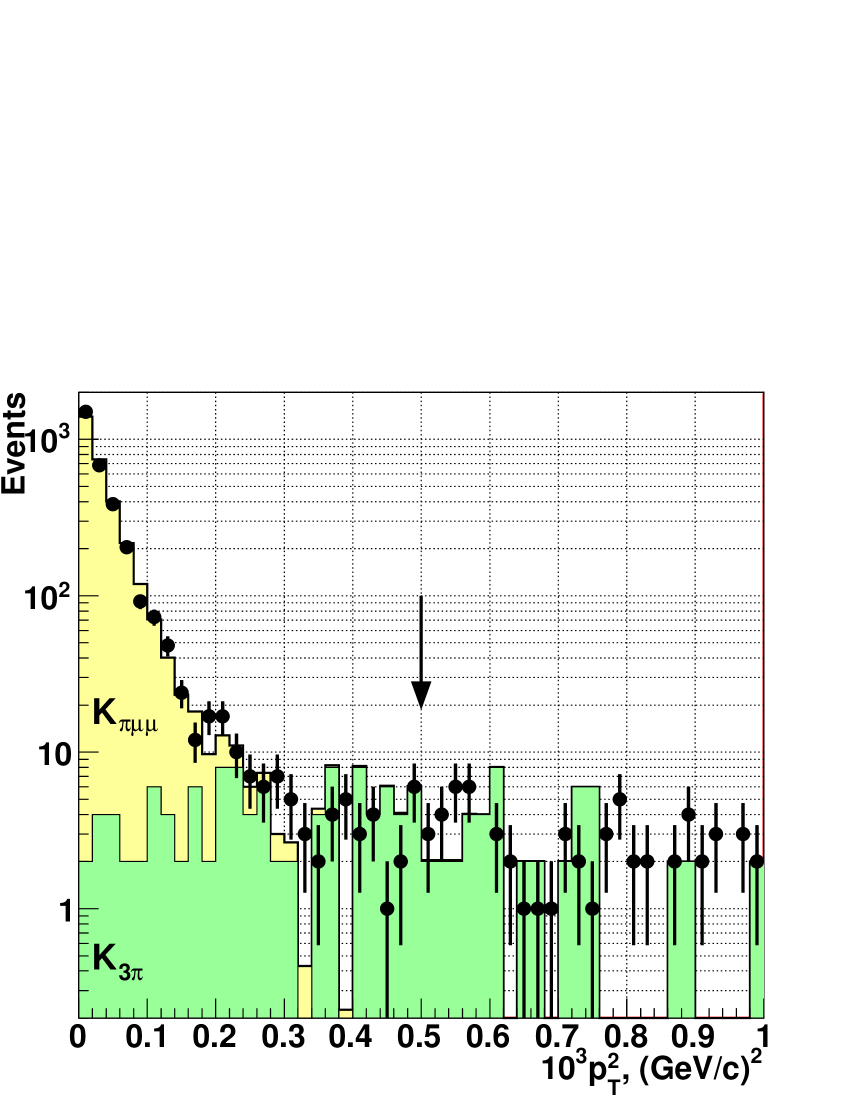
The distributions of the data and WS candidates in the ; plane are displayed in Fig. 3. The distributions of the data candidates, MC events and background evaluated with WS events are shown in Fig. 4.
Normalisation sample
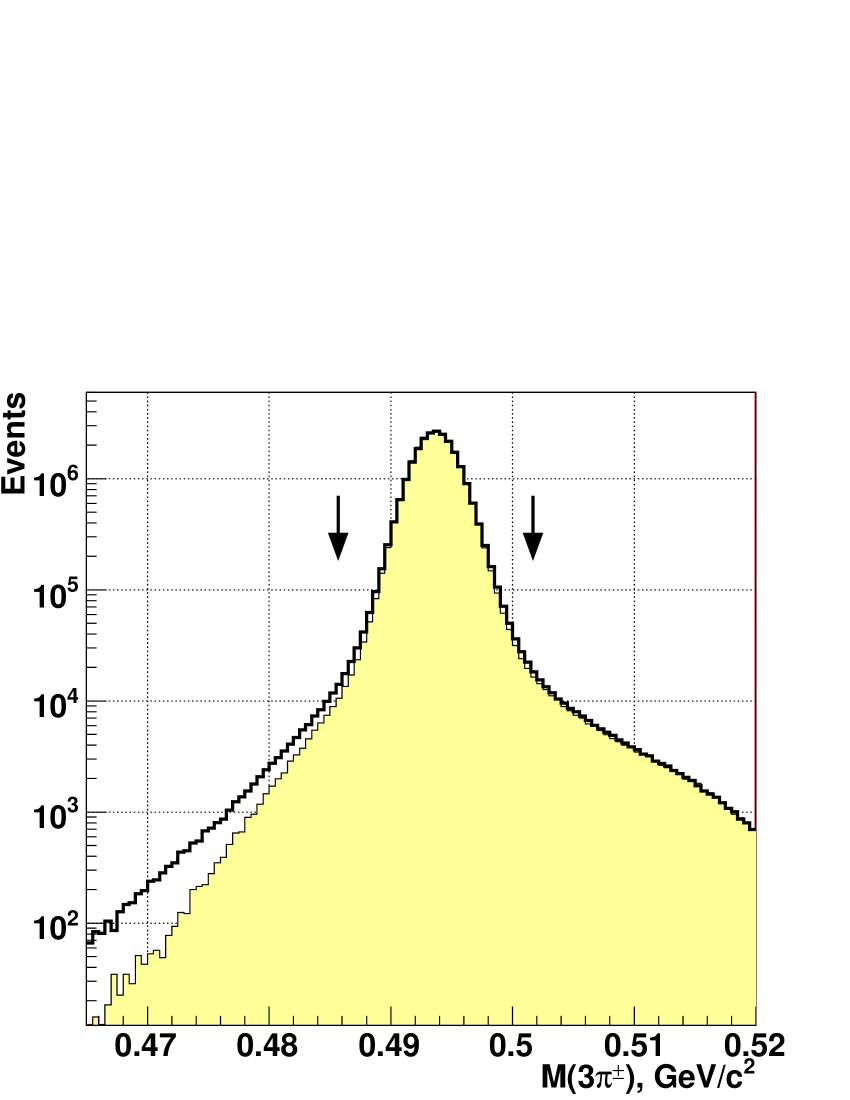
The normalisation channel is well understood in terms of simulation, being of primary physics interest to NA48/2 [11, 14]. The reconstructed invariant mass spectrum is presented in Fig. 1b: the non-Gaussian mass tails are due to decays in flight111Given that , the filtering of the data stream and the analysis are performed is such a way that the candidates are effectively pre-scaled by a factor of 100, which strongly reduces the data volume. The shown mass plot is based on the pre-scaled sample.. The small deficit of MC events at low outside the signal region, explained in part by radiative decays, is not relevant for the present analysis. The background contamination is negligible. The number of candidates in the signal region is which, taking into account acceptance, trigger efficiency and BR [15], corresponds to a number of kaon decays in the fiducial volume of . The measured resolution of MeV/ is in agreement with simulation, and is significantly smaller than due to the smaller -value of the decay.
3 Interpretation of the data
Form factor parameterizations
The decay is described as proceeding via single virtual photon exchange, resulting in a spectrum of the kinematic variable sensitive to the form factor [1]:
| (1) |
where , , and . The two-dimensional decay probability, which is used for evaluation of the geometrical acceptance with MC simulation, can be found for instance in Ref. [4]. The decay density is corrected by the Coulomb factor
| (2) |
where are the electric charges of the daughter particles, are their relative velocities, and is the fine structure constant. The relative velocities depend on invariant masses only; in particular, for the muon pair . The following models of the form factor are considered.
-
1.
Linear: with free normalisation and slope . Decay rate and spectrum are not sensitive to the choice of the sign of .
- 2.
- 3.
-
4.
ChPT parameterization [4] involving meson form factors: . The resonance masses (, ) are treated as free parameters.
Form factor measurement
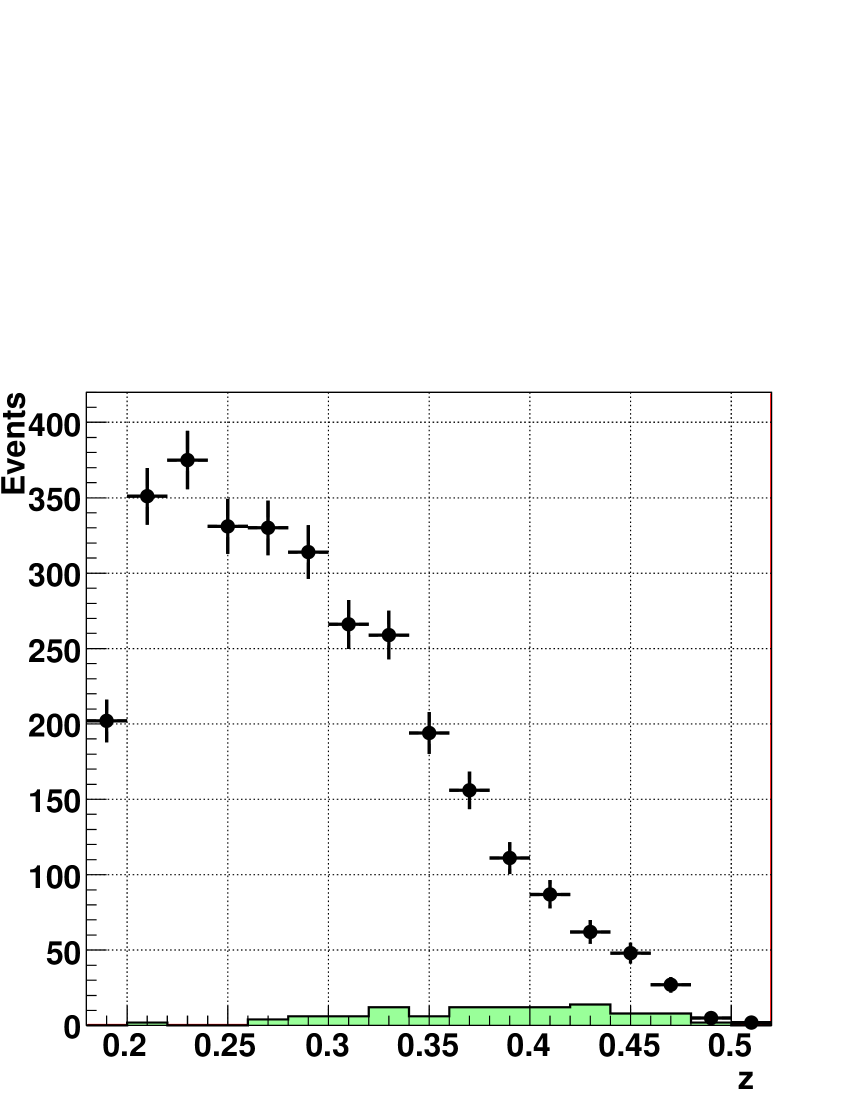
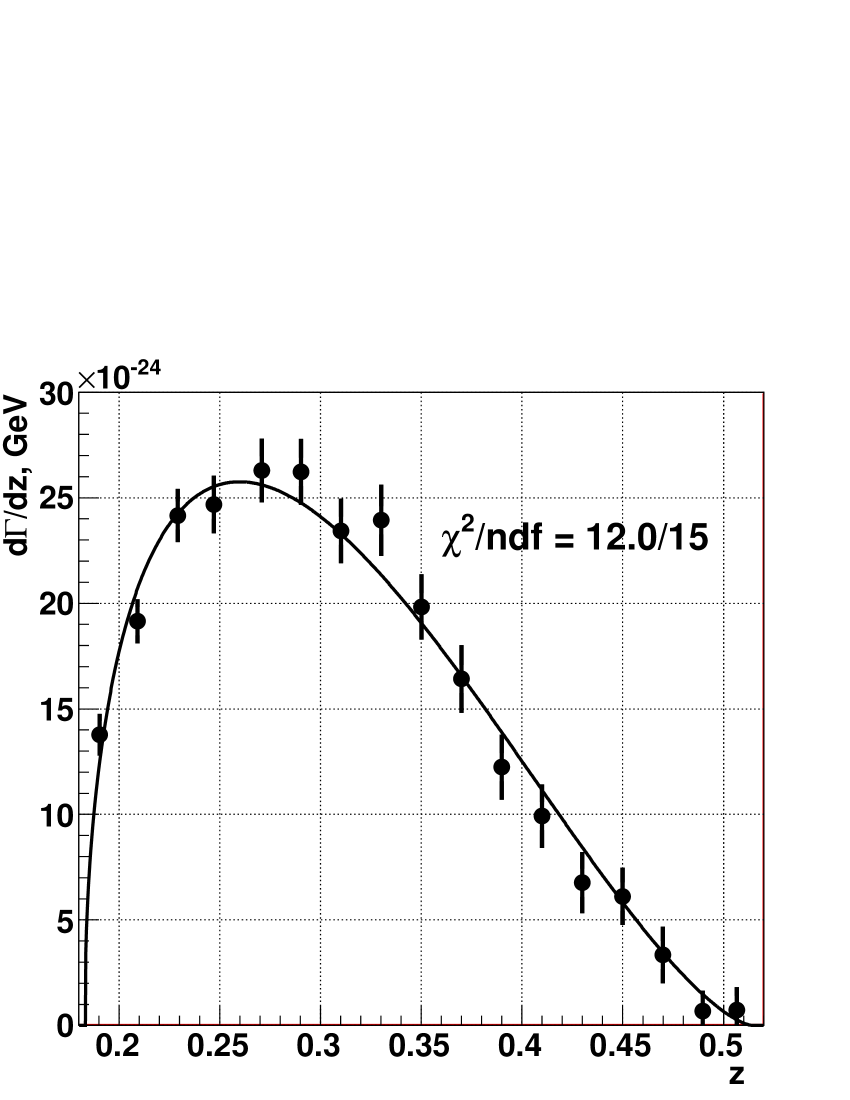
The reconstructed spectrum of the data events is shown in Fig. 5a. The values of in each bin, which can be directly compared to the theoretical expectations (1), are computed as
| (3) |
Here and are the numbers of candidates and background events in the -th bin, is the number of selected events, (ranging from 5.2% to 25.2%) and are the geometrical acceptance and trigger inefficiency in the -th bin for the signal sample, and and are those for events. Trigger inefficiencies are , dominated by timing misalignment and therefore independent of kinematics and mostly cancelling in (3). The bin widths for the computation are chosen to be 0.02 for all bins except the first and last ones limited by the phase space: . The resolution in the variable is smaller than the bin width, ranging from 0 at to 0.007 at . The external inputs are the kaon lifetime and the branching ratio of the normalisation decay mode [15].
The effective values, at which is evaluated, are corrected for non-linearity of following [17]. This results in a significant correction in the first bin where has the largest gradient.
The values of vs and the result of the fit to the linear form factor are presented in Fig. 5b. The fits to the other models are very similar, and are not shown.
Model-independent branching fraction and asymmetries
The model-independent BR is evaluated by integration of the spectrum (3) normalised to the full decay width . Separate measurements of the BR for and decays allow the evaluation of the CP violating charge asymmetry of the decay rates: .
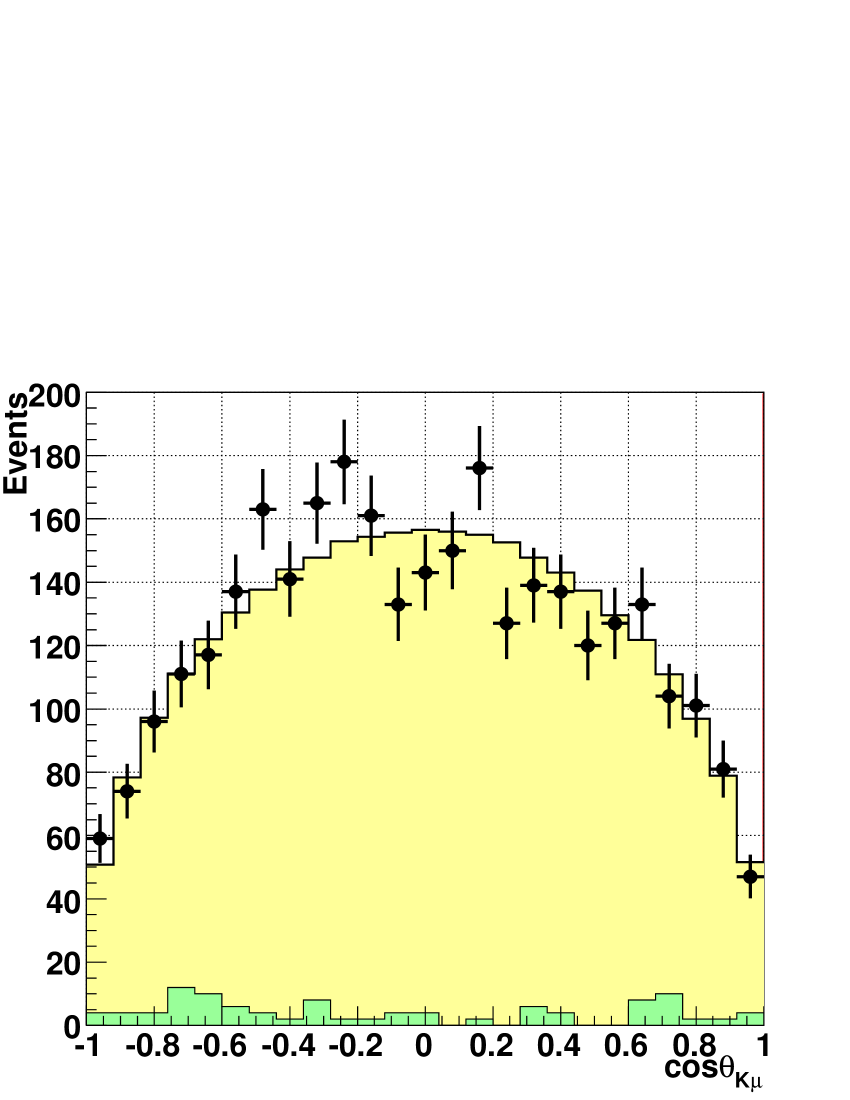
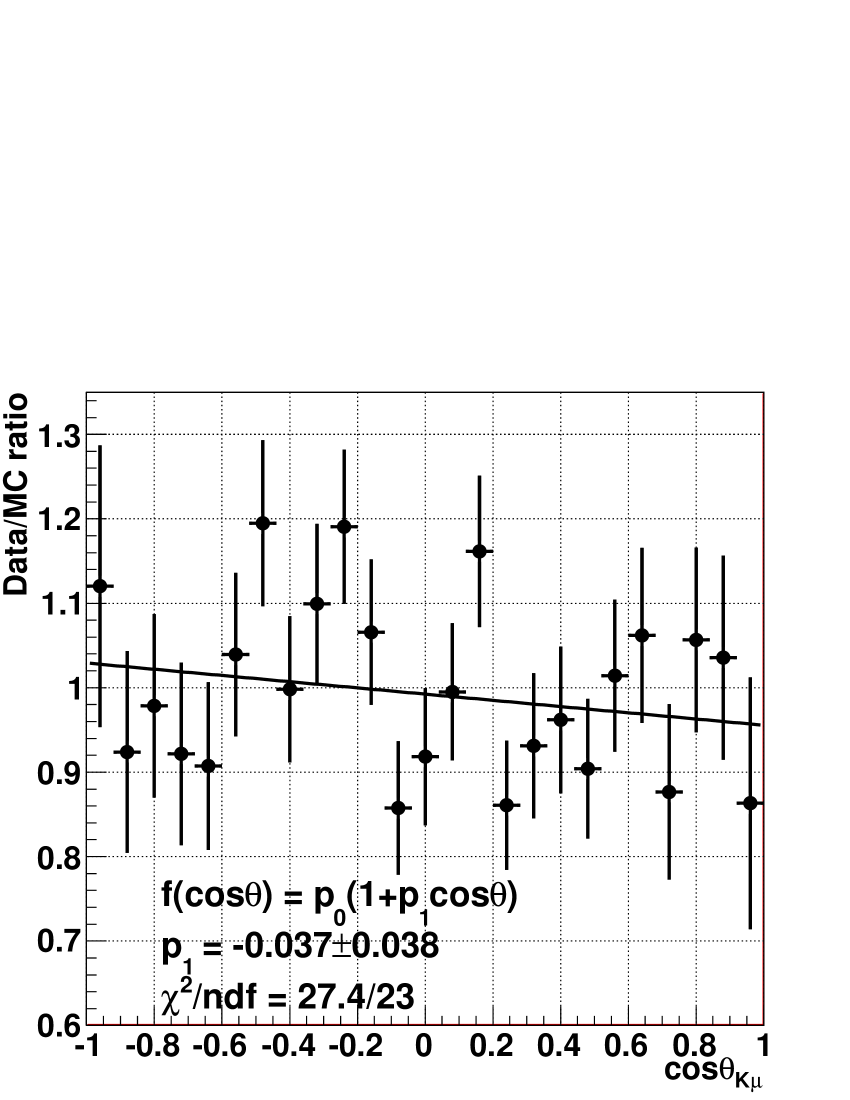
Another interesting observable is the forward-backward asymmetry in terms of the angle between the kaon and opposite sign muon three-momenta in the dimuon rest frame:
| (4) |
Non-zero values of the asymmetry can be obtained with the presence of scalar type interactions. is expected to be sensitive to non-SM effects, and to be enhanced in the decay with respect to the decay [18].
Due to the limited size of the data sample, only the asymmetry integrated over the variable is considered in the present analysis. The and samples are summed up for this measurement. The background is subtracted using the WS events. The spectra (i.e. the sums of and distributions) of the data, simulated signal and background events, and the data/MC ratio are displayed in Fig. 6 (no forward-backward asymmetry is simulated in MC).
Systematic uncertainties
The statistical errors include those due to the numbers of candidates and WS data events used to estimate the background.
The scale factor of 2 applied to WS candidates to model the background in the sample has an uncertainty due to the dependence of Dalitz plot density and acceptance on kinematic variables. MC simulation of the decay mode predicts the scale factor to be . The stability of the ratio of spectra of data to WS candidates over the control region of MeV/ suggests a similar uncertainty of 0.3. A dedicated study of the background to the decay leads to a similar conclusion [19]. The effect of this uncertainty is quoted as the systematic error due to background subtraction. The background contamination is thus .
Muon identification efficiency measured from a sample collected during a special low intensity run with a loose 1-track trigger condition varies from 98.3% to 99.5%, depending on track momentum, in the signal momentum range above 10 GeV/. It is reasonably well described by MC simulation: the difference between data and simulated efficiencies is below 0.4% in the whole analysis momentum range. This difference is propagated as the corresponding systematic uncertainty.
Uncertainties due to the pion identification efficiency, which partially cancel due to symmetrisation of the and selections, are evaluated by comparing the results with the pion identification criterion switched on and off for the mode.
The residual effects of the trigger inefficiency are negligible, as explained above. Uncertainties due to imperfect simulation of beam momentum and angular distributions are negligible, as these effects are small and largely cancel due to similarity of signal and normalisation topologies. Sizable uncertainties arise from the external input: is experimentally known with a limited relative precision of 0.7% [15].
Uncertainties on the model parameters and the model-independent BR are summarised in Table 1. Systematic uncertainties are significantly smaller than the statistical ones, owing to the limited size of the data sample. Systematic errors on the asymmetries and , which mostly cancel between the pairs of samples entering the asymmetry definitions, are negligible.
| Model | Parameter | Statistical | Background | Muon ID | Pion ID | External |
| (1) | 0.039 | 0.006 | 0 | 0 | 0.002 | |
| 0.56 | 0.11 | 0.01 | 0 | 0 | ||
| (2) | 0.038 | 0.006 | 0 | 0.002 | 0.002 | |
| 0.142 | 0.027 | 0.005 | 0.006 | 0.005 | ||
| (3) | 0.014 | 0.003 | 0 | 0.001 | 0 | |
| 0.61 | 0.12 | 0.02 | 0.02 | 0.02 | ||
| (4) | /GeV | 0.083 | 0.016 | 0.002 | 0.001 | 0.001 |
| /GeV | 0.027 | 0.005 | 0.001 | 0.001 | 0.001 | |
| 0.21 | 0.07 | 0.04 | 0.08 | 0.07 |
Search for the lepton number violating decay
The decay violating lepton number by two units can proceed via a neutrino exchange if the neutrino is a Majorana particle, and the E865 upper limit on its rate [9] currently provides the strongest constraint on the effective Majorana neutrino mass [20, 21]. This decay has also been studied in the context of supersymmetric models with -parity violation [21].
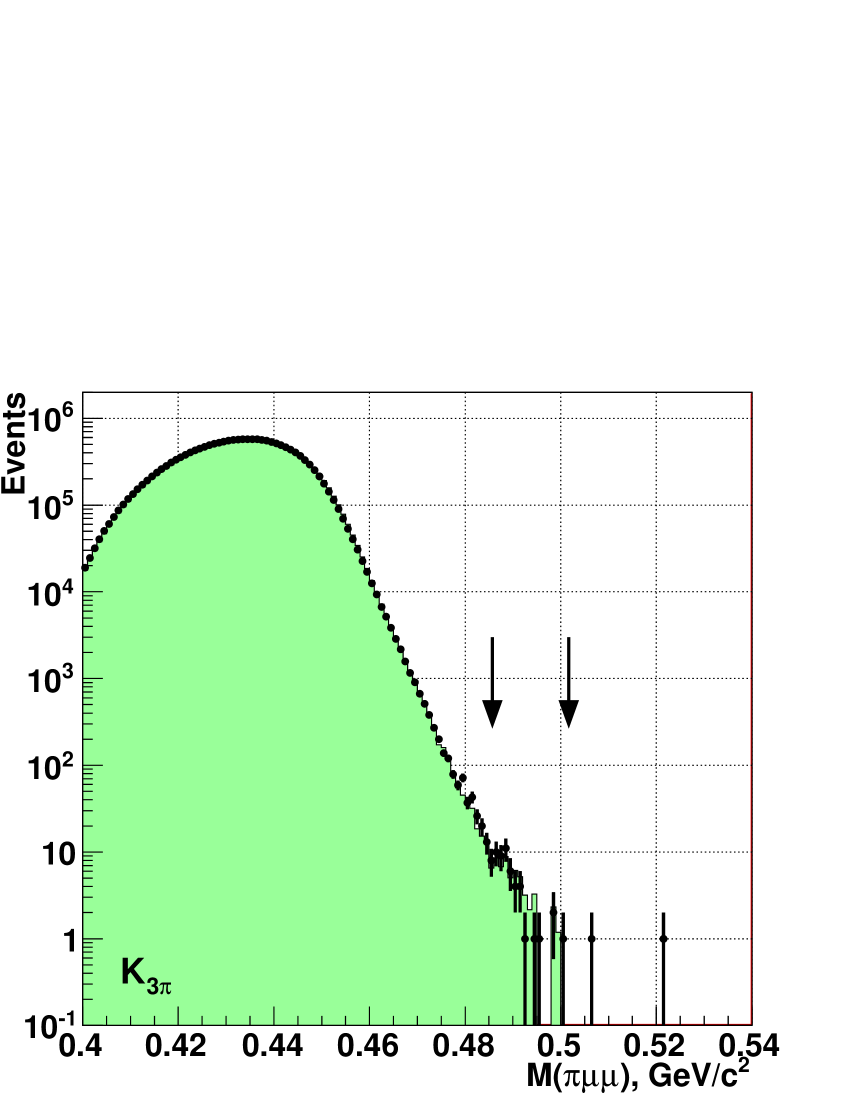
A new upper limit on can be established by analyzing the WS data mass spectrum shown in Fig. 2b. The expected background is estimated by MC simulation of the sample. The Feldman-Cousins method [22] is employed for confidence interval evaluation; the systematic uncertainty of the background estimate is taken into account. The geometrical acceptance is conservatively assumed to be the smallest of those averaged over the and samples ( and ).
4 Results and discussion
| Model (1) | |||||||||||
| 0.040 | |||||||||||
| 0.57 | |||||||||||
| Model (2) | |||||||||||
| 0.039 | |||||||||||
| 0.145 | |||||||||||
| Model (3) | |||||||||||
| 0.014 | |||||||||||
| 0.62 | |||||||||||
| Model (4) | |||||||||||
| 0.085 | |||||||||||
| 0.028 | |||||||||||
| 0.25 | |||||||||||
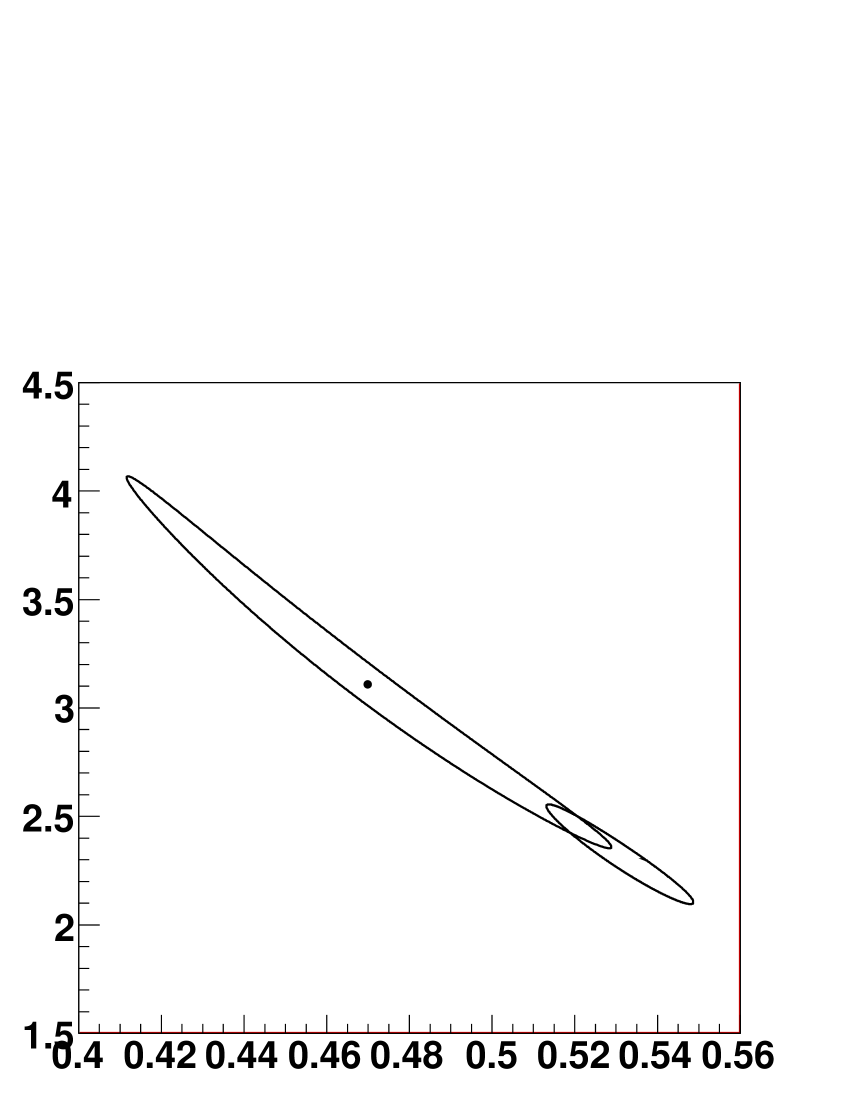
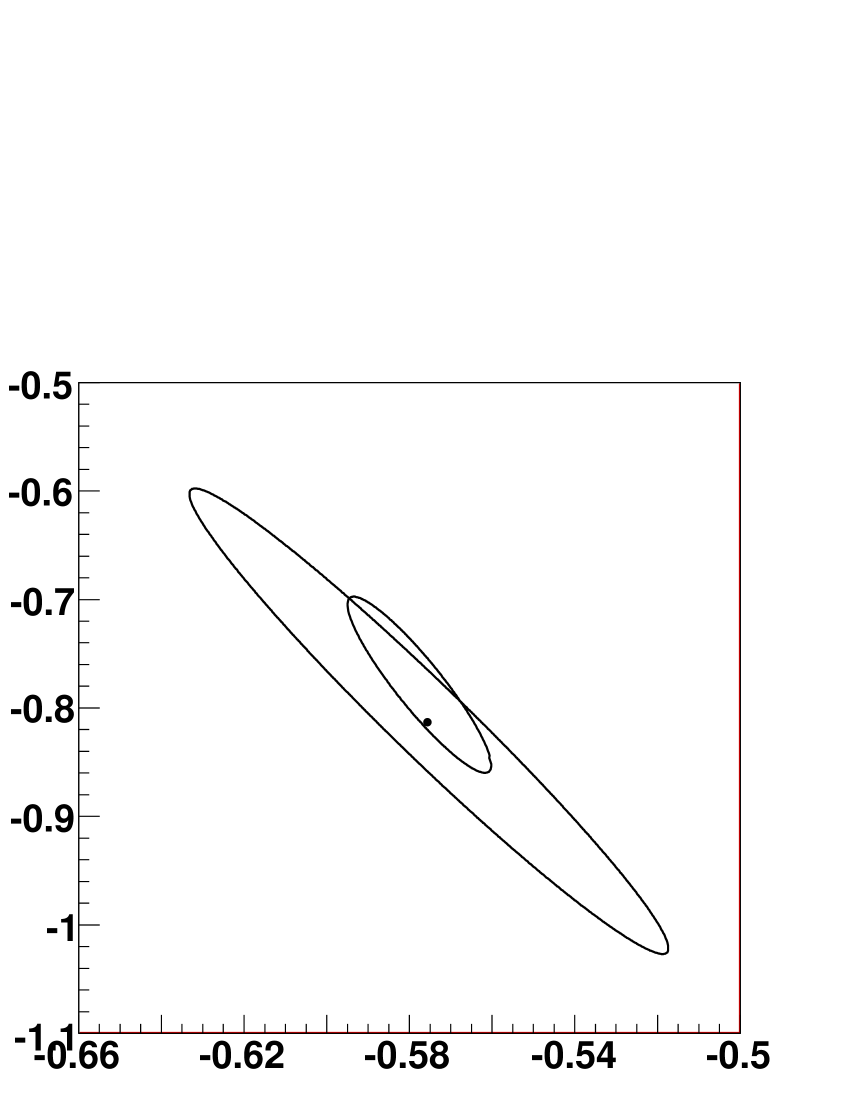
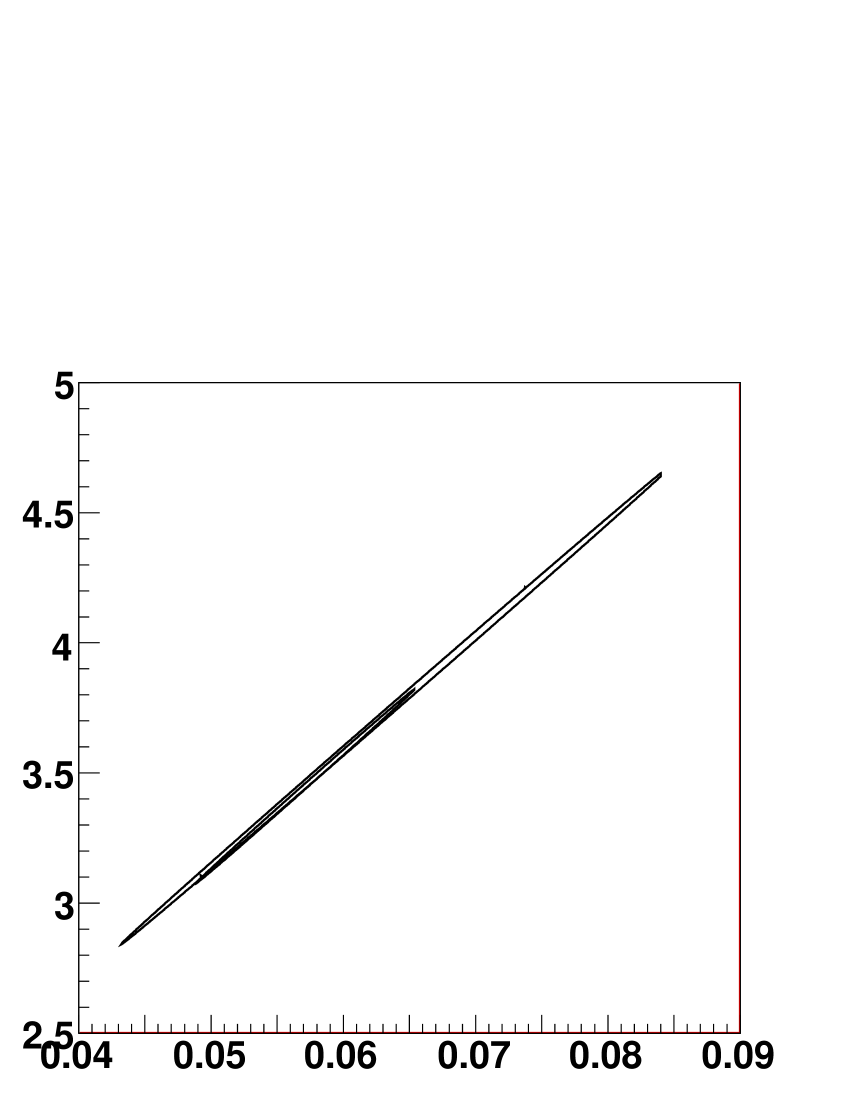
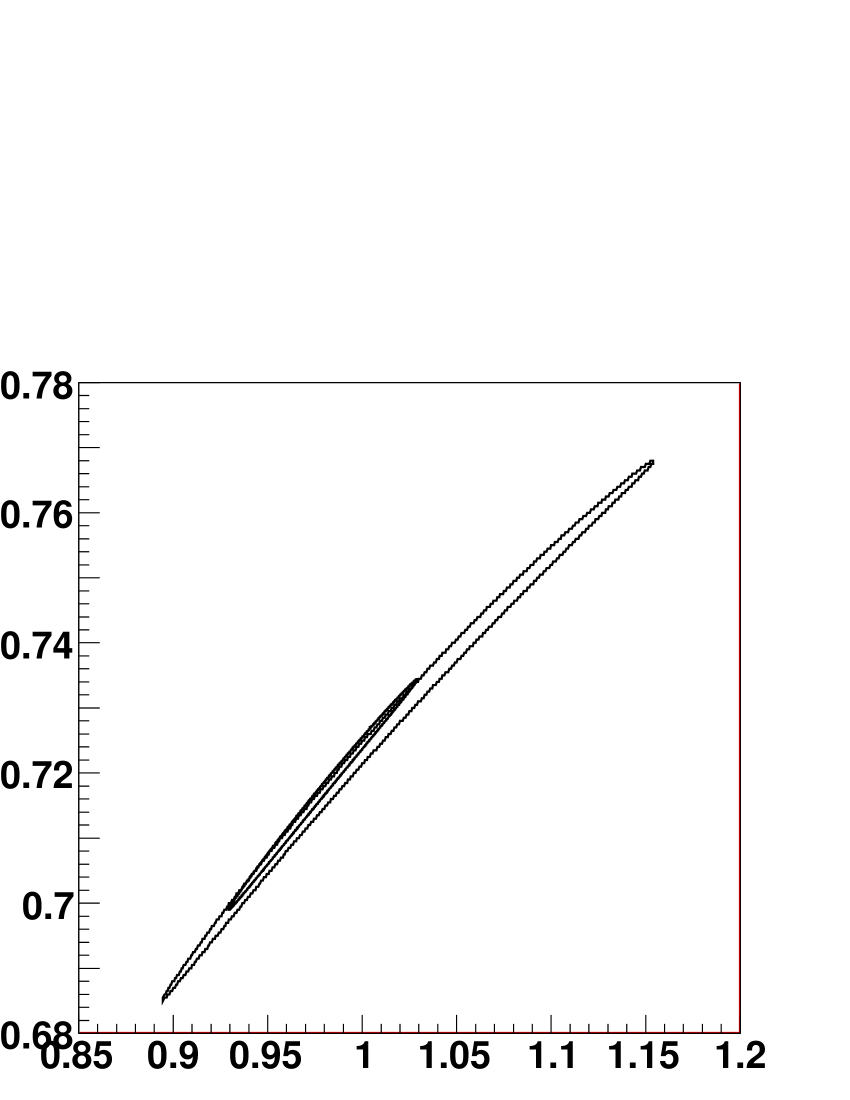
The measured values of the model parameters and the model-independent BR are presented in Table 2. The overall precision is limited mainly by the statistical uncertainties. Each of the form factor models provides a reasonable fit to the data, but the statistical precision is insufficient to distinguish between the models. The 68% confidence level contours for the pairs of parameters are presented in Fig. 7, overlayed with those obtained from the analysis of the NA48/2 sample [16].
|
|
|
|
The measurements of the form factor parameters are summarized in Table 3. The present measurement is in agreement with the previous ones based on both [6] and [7, 8, 16] samples. Our measurement of the form factor linear slope further confirms the contradiction of the data with the meson dominance models [23] which predict the slope parameter to be in the range from 0.5 to 0.9. The measurements of the parameter (this result and the measurements [8, 16]) are in agreement with a theoretical expectation of [24, 25].
| Decay | |||||
|---|---|---|---|---|---|
| Reference | [7] | [8, 3] | [16] | [6] | this result |
| /GeV | |||||
| /GeV |
The measurements of are summarized in Table 4. Our measurement is in agreement with those reported in [6, 10], but disagrees with the earliest one [5] by 4.5 standard deviations. It should be noted that the BR measurement [5], obtained under the assumption of the form factor slope measured with [7], is inconsistent with theoretical expectations based on form factor measurements assuming that the decays are dominated by the form factor [2]. The precision of our BR measurement represents a factor of improvement with respect to the most precise earlier measurement [6].
| Reference | Beams | candidates | |
|---|---|---|---|
| E787 [5] | 207 | ||
| E865 [6] | 430 | ||
| HyperCP [10] | 110 | ||
| NA48/2 | 3120 |
The model-independent branching ratios measured separately for and decays are
where the quoted uncertainties are statistical only. Neglecting the systematic uncertainties of and (which are small compared to the statistical uncertainties, and mostly common to the and measurements), and the possible charge asymmetry of decay rates which is experimentally compatible with zero within precision [26], we measure the charge asymmetry to be . This is a factor of improvement in precision with respect to the only previous measurement [10], and is compatible with CP conservation. A limit for the charge asymmetry of at 90% CL can be deduced from the above value. The experimental precision is far from the SM expectation [2] and even the SUSY upper limit [27, 28] for the CP violating asymmetry.
The forward-backward asymmetry has been measured to be , where the error is dominated by the statistical uncertainty. It corresponds to an upper limit of at 90% CL. The achieved precision does not reach the upper limits for the SM contribution via the two-photon intermediate state [29] and MSSM contribution [18], which are both of the order of .
Finally, WS data events are observed in the signal region with the expected background of estimated from MC simulation. Conservatively assuming the expected background to be events to take into account its uncertainty, this translates into an upper limit of 32.2 signal events at 90% CL, leading to an upper limit of at 90% CL. This is an improvement by almost a factor of 3 with respect to the best previous limit [9], allowing a bound on the effective Majorana neutrino mass of to be established [20].
Conclusions
From a sample of 3120 decay candidates with background contamination, the model-independent branching fraction has been measured to be , and the form factor which characterizes the decay has been evaluated in the framework of four models. Upper limits for the CP violating charge asymmetry and (for the first time) the forward-backward asymmetry of the decay rate have been established. An upper limit of for the branching fraction of the lepton number violating decay has been obtained. The achieved precisions dominate the currently available measurements.
Acknowledgements
It is a pleasure to express our appreciation to the staff of the CERN laboratory, the technical staff of the participating laboratories, universities and affiliated computing centres for their efforts in operation of the experiment and data processing. We are grateful to Dao-Neng Gao and Gino Isidori for valuable discussions.
References
- [1] G. Ecker, A. Pich and E. de Rafael, Nucl. Phys. B291 (1987) 692.
- [2] G. D’Ambrosio et al., JHEP 9808 (1998) 4.
- [3] S. Friot, D. Greynat and E. de Rafael, Phys. Lett. B595 (2004) 301.
- [4] A.Z. Dubničková et al., Phys. Part. Nucl. Lett. 5 (2008) 76 [hep-ph/0611175].
- [5] S. Adler et al., Phys. Rev. Lett. 79 (1997) 4756.
- [6] H. Ma et al., Phys. Rev. Lett. 84 (2000) 2580.
- [7] C. Alliegro et al., Phys. Rev. Lett. 68 (1992) 278.
- [8] R. Appel et al., Phys. Rev. Lett. 83 (1999) 4482.
- [9] R. Appel et al., Phys. Rev. Lett. 85 (2000) 2877.
- [10] H.K. Park et al., Phys. Rev. Lett. 88 (2002) 111801.
- [11] J.R. Batley et al., Eur. Phys. J. C52 (2007) 875.
- [12] V. Fanti et al., Nucl. Inst. Methods A574 (2007) 433.
- [13] GEANT detector description and simulation tool, CERN program library long writeup W5013 (1994).
- [14] J.R. Batley et al., Phys. Lett. B649 (2007) 349.
- [15] K. Nakamura et al. (PDG), J. Phys. G37 (2010) 075021.
- [16] J.R. Batley et al., Phys. Lett. B677 (2009) 246.
- [17] G.D. Lafferty and T.R. Wyatt, Nucl. Inst. Methods A355 (1995) 541.
- [18] C.H. Chen, C.Q. Geng and I.L. Ho, Phys. Rev. D67 (2003) 074029.
- [19] J.R. Batley et al., Eur. Phys. J. C54 (2008) 411.
- [20] K. Zuber, Phys. Lett. B479 (2000) 33.
- [21] L.S. Littenberg and R. Shrock, Phys. Lett. B491 (2000) 285.
- [22] G.J. Feldman and R.D. Cousins, Rhys. Rev. D57 (1998) 3873.
- [23] P. Lichard, Phys. Rev. D60 (1999) 053007.
- [24] C. Bruno and J. Prades, Z. Phys. C57 (1993) 585.
- [25] J. Prades, PoS(KAON)022 (2007).
- [26] W.T. Ford et al., Phys. Rev. Lett. 18 (1967) 1214.
- [27] A. Messina, Phys. Lett. B538 (2002) 130.
- [28] G. D’Ambrosio and D.-N. Gao, JHEP 0207 (2002) 068.
- [29] D.-N. Gao, Phys. Rev. D69 (2004) 094030.