Convective instability and mass transport of diffusion layers in a Hele-Shaw geometry
Abstract
We consider experimentally the instability and mass transport of a porous-medium flow in a Hele-Shaw geometry. In an initially stable configuration, a lighter fluid (water) is located over a heavier fluid (propylene glycol). The fluids mix via diffusion with some regions of the resulting mixture being heavier than either pure fluid. Density-driven convection occurs with downward penetrating dense fingers that transport mass much more effectively than diffusion alone. We investigate the initial instability and the quasi steady state. The convective time and velocity scales, finger width, wave number selection, and normalized mass transport are determined for . The results have important implications for determining the time scales and rates of dissolution trapping of carbon dioxide in brine aquifers proposed as possible geologic repositories for sequestering carbon dioxide.
pacs:
47.15.gp, 47.20.Bp, 47.56.+rConvective processes that transport heat and mass are critical to many natural phenomena in the atmosphere and oceans as well as in planetary and stellar interiors Ahlers et al. (2009). Another important example of current scientific and technological interest is the convective mixing of supercritical carbon dioxide sequestered in a brine-saturated porous medium, Metz et al. (2005) i.e., a deep saline aquifer. When injected into such aquifers, the low density CO2 rises to the top of the aquifer where it is contained by cap rock formations. As a pure phase, the buoyancy of the supercritical CO2 may drive it back to the surface defeating attempts to sequester it. Diffusion into the underlying brine results in a denser mixture eliminating buoyancy, but this process is very slow and the pure phase of supercritical CO2 would remain mostly intact for long times ( 10,000 years) unless other processes occur.
One scenario for enhanced dissolution of the CO2 relies on this unusual property of the CO2-brine system, i.e. CO2-brine mixtures are denser than pure brineMetz et al. (2005) making gravitationally-driven convection is possible. However, the diffusion layer must thicken enough to become unstable, a process similar to the thickening and subsequent instability of thermal layers Foster (1965). Analytical calculations and numerical simulations have been performed Ennis-King et al. (2005); Xu et al. (2006); Riaz et al. (2006); Ennis-King and Paterson (2007); Rapaka et al. (2008, 2009) to determine the instability incubation time and the subsequent mass transport in CO2-brine systems. Corresponding laboratory experimentsKneafsey and Pruess (2010), however, have not succeeded in capturing the essential features of such diffusion-driven, convectively unstable layers.
The difficulties in realizing a laboratory experiment for the purposes of testing the scenario of unstable diffusion layers in porous media are considerable, e.g. establishing the stable initial conditions assumed by calculations and simulations. Also, direct experiments using supercritical CO2 and brine are complicated by high pressure (100 bar). Instead, we have developed an atmospheric-pressure analog fluid system that mimics many features of the CO2-brine system. It consists of water located vertically above propylene glycol (PPG) in a Hele-Shaw cell. As an analog system, water replaces the CO2 and propylene glycol replaces the brine. In this cell, we can create relatively unperturbed initial conditions such that the instability occurs uniformly over a wide lateral portion of the cell. We measure the temporal evolution of the system using optical shadowgraph and determine the wave number selection, the time and velocity scales, the finger width, and the mass transport rate. Our results establish the basic description of diffusively-driven convective instability in such systems.
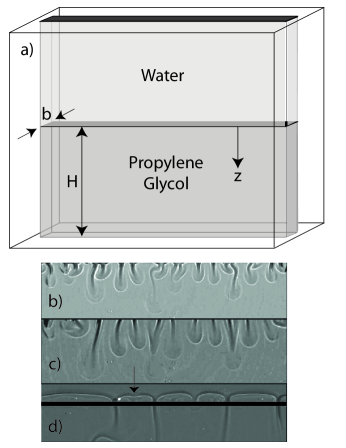
The experimental apparatus in Fig. 1, consists of a vertically-oriented Hele-Shaw cell with two 1.2-cm-thick polycarbonate sheets separated by steel shims of thickness . The flow in the narrow gap between the parallel surfaces obeys Darcy’s Law with an isotropic permeability and a porosity of unity. We vary from 0.25 to 0.48 mm giving values of in the range 5,000-20,000 Darcy (i.e. ). The lateral dimension of the flow region is 7.6 cm, and the initial depth of the bottom fluid ranges from 1.25 to 5 cm. Water ( g/cc) is lighter than PPG ( g/ccdow ) and is initially above the PPG. Water-PPG mixtures with a water concentration between 0 and 50% have . After a period of diffusive growth, the mixed fluid interface may become gravitationally unstable, similar to the proposed instability when supercritical CO2 dissolves into brine. There are, however, some important differences between the two fluid systems. Water and PPG are fully miscible whereas CO2 is partially miscible in brine with a low saturation concentration so that the transport properties of the CO2-brine system do not depend strongly on the CO2 concentration. In contrast, the viscosity and mass diffusivity of the water-PPG system are highly dependent on concentration. When computing experimental parameters or making comparisons to calculations or simulations, we use the transport properties of a 30% water-70% PPG mixture, i.e., dow and (estimated using data from Hubel et al. (2002)), which corresponds to the mixture of maximum density =1.044 g/cc or the maximum density difference of = 0.009 g/cc relative to the underlying PPG.
The upper and lower sections of the Hele-Shaw cell are separated by a system of thin shims of maximum thickness 0.01 cm. The upper and lower reservoirs are filled with pure water and pure PPG, respectively. A 0.0076-cm-thick “shutter shim” is slowly removed horizontally from between the two fluids leaving behind the 0.01-cm-thick “frame shim” to ensure a liquid-tight seal. Small perturbations of the fluid-fluid interface were observed during some runs, but these did not seem to influence the flow appreciably for measurements presented here. The removal of the shutter shim opens up a narrow 0.01-cm-thick horizontal gap at the interface between the upper and lower cells. Our cell filling method ensures that this pocket is occupied by water after the shim removal Not (a).
The development of the flow is visualized using optical shadowgraph which images the mixture concentration via its index of refraction variation. The images resolve an area of lateral size cm and height 2.4 cm with 1280 1024 pixels in the horizontal and vertical directions, respectively. Approximately 2000 frames are gathered during each run with the camera frame rate dependent on the permeability of the cell. (Total run times range between 2.5 and 10 hours). The flow develops through several stages. Initially, the PPG preferentially diffuses into the water owing to an asymmetric dependence of Hubel et al. (2002). As the dense region in the diffusion layer thickens and the influence of buoyancy overcomes lateral diffusion, hydrodynamic instability occurs as small perturbations in the dense diffusive interface grow into downward moving fingers. Figure 1b-d show the evolution of a typical experimental run at various times after initiation.
The equations governing the conservation of momentum, mass, and concentration; their various non-dimensional scalings; and solution techniques have been described in detail elsewhere Ennis-King et al. (2005); Xu et al. (2006); Riaz et al. (2006); Ennis-King and Paterson (2007); Rapaka et al. (2008, 2009). Here, we discuss the dimensionless parameters and point out a few details relevant to our experiment. Under the conditions of the experiment, the fluids and their mixture are incompressible. Conservation of momentum is adequately described by a two-dimensional Darcy’s law because the Reynolds numbers based on and the maximum observed velocities are less than 10-3. The evolution of the mixture concentration is governed by the advection-diffusion equation, although the molecular diffusion coefficient may be modified by Taylor dispersion Taylor (1953) in certain regions of higher flow velocity. For example, near the tips and within the core of fingers which move downward with velocity , the Peclet number increasing the effective lateral diffusion coefficient by a factor 15. Elsewhere, the fluid velocities are significantly lower, and the effect on is negligible.
Recalling that and neglecting the impact of within the finger core, the only dimensionless number that governs the flow is the Rayleigh number which we define in the same way as Ennis-King et al. (2005); Xu et al. (2006); Riaz et al. (2006); Ennis-King and Paterson (2007); Rapaka et al. (2008, 2009), i.e., where is the acceleration due to gravity and, as described above, all fluid properties are evaluated at maximum mixture density. Next, we define characteristic length, velocity, and time scales. The vertical convective motion of a blob of maximum density fluid is given by a balance between buoyancy and viscous drag, i.e., . At , the time required for this blob to fall the entire depth of the lower fluid in Fig. 1 is . We define . Comparative time and velocity scales are the diffusion time , i.e., the approximate time to establish a diffusion gradient over , and the diffusion velocity . From these scaling relations, we see that describes the importance of convection relative to diffusion over the vertical distance .
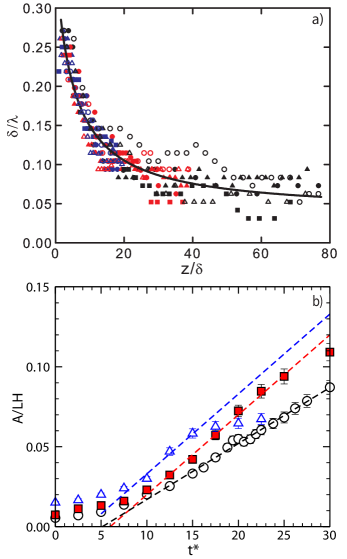
First, we consider the finger dynamics from instability onset to steady state (i.e. Fig. 1b to d). After onset, several of the initially shorter fingers stagnate and disappear which we interpret as the longer dominant fingers out competing the shorter fingers and preferentially draining dense mixture from the diffusion interface. Later, the remaining dominant fingers move laterally along the interface, collide, and merge resulting in the coarse pattern of Fig. 1d. When plotted versus the scaled depth of the longest finger, shows consistent behavior among all the experimental runs (see Fig. 2a). Here, is the measured finger width. Near , i.e. near the instability onset, ranges between 0.22 and 0.27 consistent with the onset value of computed from the results in Section 4 of Riaz et al. (2006). (Determining the onset is relatively simple, however the limitations of our imaging system prohibit us from determining the onset time.) For larger , decreases as the pattern coarsens and appears to asymptotically approach . We expect this behavior for two reasons. First, if , then the water flux per unit interface length would tend to zero for large or which is unphysical. Second, the coarsening due to finger merging is eventually balanced by the nucleation of new fingers as the diffusion interface between two now distant fingers thickens and becomes unstable (see Fig.1d), and for large , this instability should be governed by local processes independent of . After the longest finger extends to , we observe some fluctuations in , but the time average is close to the near in Fig. 2a. We conclude that interactions of the fingers with the bottom of the cell do not affect the pattern, and is an appropriate length scale for coarsening as opposed to .
Mixing of the water and PPG is important for understanding the convective process and assessing its effectiveness to securely sequester CO2 in brine reservoirs. We determine the amount of water mixed from the experimental images by measuring the area between the initial interface and the middle of the subsequent diffusive interface (as in Fig. 1d) as a function of Not (b). Figure 2b shows vs for several runs with the same but different . After an initial slow increase Not (a), increases linearly with indicating a steady mass transfer rate. At longer times in runs with small (e.g., the data), saturates due to an increase in mixture density in the lower cell which reduces and shuts off the convection.
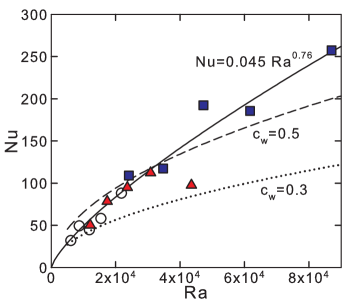
We express the mass transfer rate in dimensionless form via the Nusselt number which represents the actual mass flux normalized by the diffusive mass flux over cell depth . Rewriting, , i.e. is simply times the slopes from Fig. 2 which are plotted versus in Fig. 3. When fit to a power law, shows a dependence of which is similar to results from numerical simulations of thermal convection in three-dimensional porous media Otero et al. (2004) where for . Comparing values at , we find and thermal convection simulations give . Although the comparison with simulation is reasonable, we seek to go further by checking the internal consistency of the data in Figs. 2a and 3 and using these results to outline a new stability problem that should provide a prediction of .
The mass flux of water through the fingers and into the lower cell is given by where is the number of fingers extending from the interface and and are the velocity and water concentration of the fluid in the finger cores. Scaling this mass flux for comparison with Fig. 3, we find . To estimate , we consider a set of equally spaced fingers and ignore small density differences except in buoyancy terms. The balance of mass flux across a horizontal line cutting through the fingers requires , where is the upward velocity of pure PPG between the fingers. Integrating the vertical component of Darcy’s law around a closed rectangular contour with one vertical leg in a finger and the other in the pure PPG we find . Combining the previous results yields allowing us to express (from above) as a function solely of , i.e. ( is fixed in this experiment). In the quasi steady state after the fingers reach , we can instead interpret the fitted curve in Fig. 2a as . However, so that . Combining, we find which is numerically inverted to find versus as shown in Fig. 3 for and , i.e. at maximum mixture density and the maximum where the mixture density is still greater than .
The rough agreement in Fig. 3 supports the validity of this simple model of mass transfer and the relationship between and the pattern coarsening () data in Fig. 2a. However, a full understanding of the mass transfer must include a theoretical model of . Here, we describe a few relevant physical process in this model, but leave the detailed derivation to future work. In our view, the core of this model includes a new stability calculation that predicts the distance between two established fingers at which the intervening diffusion layer becomes unstable to small perturbations. However, this layer is already experiencing significant transverse flows due to fluid drainage from the layer into the fingers—a significant complication not present in the instability of the original quiescent diffusion layer. Taylor dispersion due to shear along the direction of in Fig. 1a will be quite effective in smoothing out concentration perturbations. As a result, the instability will preferentially nucleate at the symmetry point between the fingers (as is seen in Fig. 1d and in many other occurrences of this process) where the flow stagnates and Taylor dispersion has the least effect. However, a nascent finger of finite transverse size at the stagnation point will be spread out laterally due to streamwise velocity gradients in the layer. Both of these mechanisms behave like an enhanced diffusion process which, by analogy with the quiescent diffusion layer, will increase the onset wavelength consistent with the small observed in quasi steady state in Fig. 2a.
In conclusion, our measurements of at early times are consistent with models of this initial instabilityEnnis-King et al. (2005); Xu et al. (2006); Riaz et al. (2006) supporting the validity of these models. We have measured both the finger coarsening dynamics and steady-state convective mass transfer and outlined a new stability problem to predict the mass transfer. Our experimental results are useful for understanding the impact of reservoir parameters on the effectiveness of CO2 sequestration. Permeability accounts for much of the variability in between different saline reservoirs. A recent survey of reservoirs in the Alberta basinHassanzadeh et al. (2006) found a maximum . Extrapolating our best-fit power law to this lower yields . However, other reservoirsChadwick et al. (2009) have significantly higher with and . Assuming a reservoir depth of 50 m, the characteristic time for diffusive mixing is years. At , the convective process observed in this work would speed up the mass transfer and reduce this time to approximately 200 years.
This work was carried out under the auspices of the National Nuclear Security Administration of the U.S. Department of Energy at Los Alamos National Laboratory under Contract No. DE-AC52-06NA25396. We gratefully acknowledge the support of the U.S. Department of Energy through the LANL/LDRD Program (#20100025DR) for this work
References
- Ahlers et al. (2009) G. Ahlers, S. Grossmann, and D. Lohse, Rev. Mod. Phys. 81, 503 (2009).
- Metz et al. (2005) D. Metz, O. Davidson, H. de Connick, M. Loos, and L. Meyer, IPCC special report on carbon dioxide capture and storage (Cambridge University Press, New York, NY, 2005), chap. 5.
- Foster (1965) T. D. Foster, Physics of Fluids 8, 1249 (1965).
- Ennis-King et al. (2005) J. Ennis-King, I. Preston, and L. Paterson, Physics of Fluids 17, 084107 (2005).
- Xu et al. (2006) X. Xu, S. Chen, and D. Zhang, Advances in Water Resources 29, 397 (2006).
- Riaz et al. (2006) A. Riaz, M. Hesse, H. A. Tchelepi, and F. M. Orr, Journal of Fluid Mechanics 548, 87 (2006).
- Ennis-King and Paterson (2007) J. Ennis-King and L. Paterson, International Journal of Greenhouse Gas Control 1, 86 (2007), ISSN 1750-5836.
- Rapaka et al. (2008) S. Rapaka, S. Chen, R. J. Pawar, P. H. Stauffer, and D. Zhang, Journal of Fluid Mechanics 609, 285 (2008).
- Rapaka et al. (2009) S. Rapaka, R. J. Pawar, P. H. Stauffer, D. Zhang, and S. Chen, Journal of Fluid Mechanics 641, 227 (2009).
- Kneafsey and Pruess (2010) T. Kneafsey and K. Pruess, Transport in Porous Media 82, 123 (2010), ISSN 0169-3913, 10.1007/s11242-009-9482-2.
- (11) Density and dynamic viscosity data for propylene glycol are taken from manufacturer data, http://dow-answer.custhelp.com/.
- Hubel et al. (2002) A. Hubel, N. Bidault, and B. Hammer, ASME Conference Proceedings 2002, 121 (2002).
- Not (a) The shim addenda volume produces a delay in the motion of the interface estimated to be of order of several .
- Taylor (1953) G. Taylor, Royal Society of London Proceedings Series A 219, 186 (1953).
- Not (b) There are corrections of order 5% due to the small density differences between the fluids.
- Otero et al. (2004) J. Otero, L. A. Dontcheva, H. Johnston, R. A. Worthing, A. Kurganov, G. Petrova, and C. R. Doering, Journal of Fluid Mechanics 500, 263 (2004).
- Hassanzadeh et al. (2006) H. Hassanzadeh, M. Pooladi-Darvish, and D. Keith, Transport in Porous Media 65, 193 (2006), ISSN 0169-3913, 10.1007/s11242-005-6088-1.
- Chadwick et al. (2009) R. Chadwick, D. Noy, R. Arts, and O. Eiken, Energy Procedia 1, 2103 (2009), ISSN 1876-6102.