The drop of the coherence of the lower kHz QPOs is also observed in XTE J1701-462
Abstract
We investigate the quality factor and RMS amplitude of the lower kHz QPOs from XTE J1701–462 a unique X-ray source which was observed in both the so-called Z and atoll states. Correcting for the frequency drift of the QPO, we show that, as in all sources for which such a correction can be applied, the quality factor and RMS amplitude drops sharply above above a critical frequency. For XTE J1701–462 this frequency is estimated to be Hz, where the quality factor reaches a maximum of (e.g. a value consistent with the one observed from more classical systems, such as 4U 1636–536). Such a drop has been interpreted as the signature of the innermost stable circular orbit, and that interpretation is consistent with the observations we report here. The kHz QPOs in the Z state are much less coherent and lower amplitude than they are in the atoll state. We argue that the change of the QPO properties between the two source states is related to the change of the scale height of the accretion disk; a prediction of the toy model proposed by Barret et al. (2007). As a by-product of our analysis, we also increased the significance of the upper kHz QPO detected in the atoll phase up to (single trial significance), and show that the frequency separation ( Hz) is comparable with the one measured from simultaneous twin QPOs the Z phase.
1 Introduction
Kilohertz quasi-periodic brightness variations (kHz QPOs) have been detected from more than twenty low-mass X-ray binaries containing a weakly magnetized neutron star (van der Klis, 2006). A pair of QPOs is often detected, with a frequency separation that typically changes by tens of Hertz as the individual QPO frequencies change by hundreds of Hertz. In lower luminosity systems (often called atoll sources after the tracks they make in color-color diagrams), the lower frequency QPO can reach quality factors (Q) up to 200, whereas the upper kHz QPO is usually a broader feature with maximum Q around 50 (see, e.g. Barret et al., 2005a, b, 2006). In brighter systems (often called Z sources), both the lower and upper kHz QPOs are broader features, with maximum Q of a few tens (Boutelier et al., 2010). In lower luminosity sources, for which the quality factor of the lower kHz QPO can be measured over its entire frequency span after correcting for the frequency drifts, Q increases with frequency until it reaches a maximum around 800–900 Hz, beyond which a sharp drop-off is observed. The presence of the drop in many systems, and its reproducibility in a given system independent of count rate and spectral hardness (Barret et al., 2007), led to the suggestion that it may be related to the existence of an innermost stable circular orbit, a key prediction of strong field general relativity (Barret et al., 2006).
XTE J1701–462 is a unique X-ray source, which first behaved like a Z source at high luminosity, and which later behaved like an atoll source at much lower luminosities. The source was closely monitored with the RXTE Proportional Counter Array during its 2006-2007 outburst (Homan et al., 2007; Lin et al., 2009b; Homan et al., 2010). Type I X-ray bursts were studied by Lin et al. (2009a). The three bursts observed occurred as the source was in transition from the typical Z-source behavior to the typical atoll-source behavior, at % of the Eddington luminosity. No significant burst oscillations in the range 30–4000 Hz were found during these three bursts. Lin et al. (2009a) also derive a distance estimate of kpc from two radius expansion bursts (the latter two of the three). In both states, kHz QPOs have been reported, with very different properties, yet following the general trend that in the Z state, QPOs showed lower Q and amplitude than in the atoll state (Homan et al., 2007, 2010; Sanna et al., 2010). The luminosity range over which kHz QPOs are detected between the Z and atoll state spans a factor of 15-20. The dramatic changes in the QPO parameters between the two source states could not be due to changes in the neutron star mass, its magnetic field, its spin, or even the inclination of the accretion disk. It is thus more plausible that they were instead caused by a change in the properties of the accretion flow. This led Sanna et al. (2010) to conclude first that effects other than the geometry of space time around the neutron star have a strong influence on the coherence and amplitude of the kHz QPOs, and second that the drop of the coherence and RMS amplitude of the lower kHz QPOs, as we have observed it, could not be used to infer the existence of the innermost stable circular orbit around a neutron star.
In this paper, we revisit the RXTE observations reported by Sanna et al. (2010), focussing on the lower kHz QPO, and apply the same analysis procedures (frequency drift correction) as described in Barret et al. (2006). The main reason is that, despite very few detections overall (12 segments of observations in total), the frequency span of the lower kHz QPO ranges from about 640 Hz to 850 Hz, and by comparison with other sources, this should be sufficient to investigate the drop of its quality factor (no such drop is obvious in Figure 3 of Sanna et al. (2010) who used a different analysis than Barret et al. (2006)). In the next section, we describe the re-analysis of the lower kHz QPOs reported by Sanna et al. (2010) to show that the drop of its quality factor and RMS amplitude is indeed observed. We then discuss the changes in the properties of the QPOs from XTE J1701–462 as simply related to a likely decrease of the disk thickness between the Z and atoll phases, as previously discussed in the framework of the toy model presented in Barret et al. (2007).
2 Observations
We follow the definition of the Z and atoll states as in Sanna et al. (2010): the separation is estimated around the end of April 2007. We have retrieved from the HEASARC archive science event mode and single bit data recorded by the RXTE Proportional Counter Array (PCA). We consider data as segments of continuous observation (an ObsID may contain more than 1 segment). For each segment, we have computed an average Power Density Spectrum (PDS) with a 1 Hz resolution and an integration time of 16 seconds, using events recorded between 2 and 40 keV. The PDS are normalized according to Leahy et al. (1983), so that the Poisson noise level is expected to be a constant close to 2. The PDS is then blindly searched for excess power between 500 Hz and 1400 Hz using a scanning technique, as presented in Boirin et al. (2000). We have also verified that no significant excesses were detected between 1400 and 2048 Hz. This justifies the use of the Hz range to estimate accurately the Poisson noise level in each observation, which is indeed close to 2 in all segments of data.
The excess power is then fitted with a Lorentzian with three free parameters; frequency, full width at half maximum, and amplitude (equal to the integrated power of the Lorentzian). The Poisson noise level is fitted separately above 1400 Hz. 68% confidence errors on each parameter are computed in a standard way, using a of . Following Boutelier et al. (2009), our threshold for QPOs is related to the ratio (hereafter ) of the Lorentzian amplitude to its error111The Lorentzian function used in the fit is , where A is the integrated power of the Lorentzian from 0 to , W its width and its centroid frequency. The fitted function is linear in A, and therefore its error can be computed using (e.g. Press et al. (1992)). The RMS amplitude is a derived quantity, computed as RMS=, where is the source count rate (van der Klis, 1989). In this paper, we have defined , from which the error on the RMS is estimated as after neglecting the term in the derivative of the RMS equation. ( was often quoted and used as a significance). A conservative threshold means that we consider only QPOs for which we can measure the power of the Lorentzian with an accuracy of or more. Such a threshold corresponds to a excess power in the PDS for a single trial, equivalent to if we account for the number of trials of the scanning procedure (van der Klis, 1989). The integrated power of the Lorentzian is then converted into a root mean square (RMS), expressed as a fraction of the total source count rate.
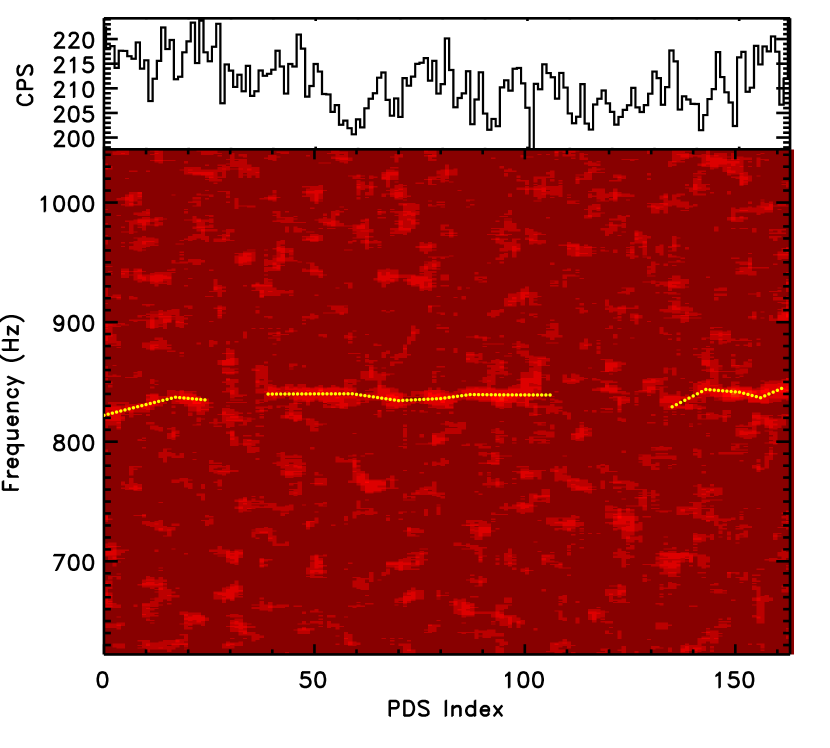
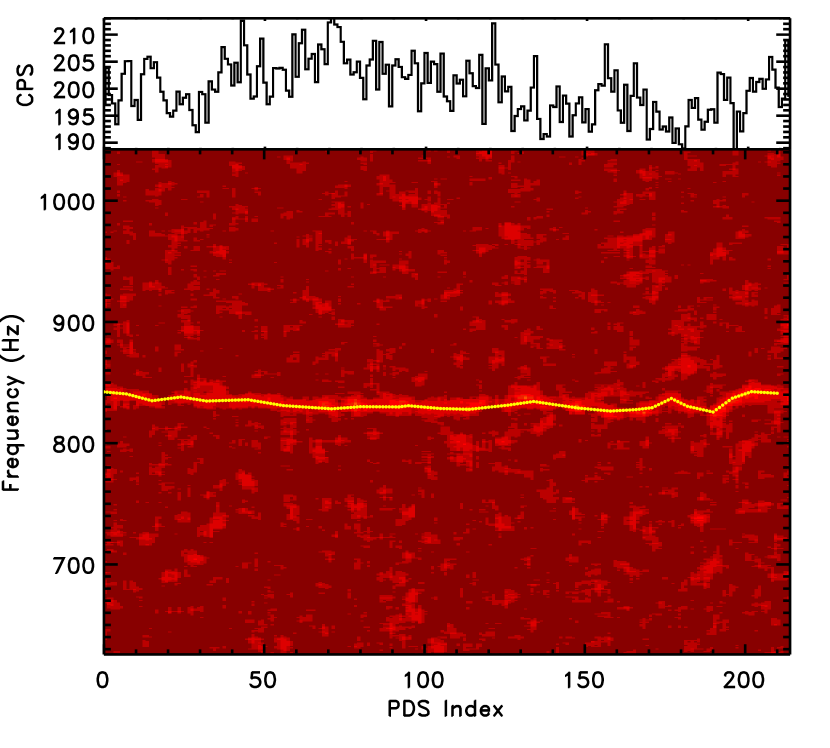
We detect a significant QPO in twelve segments of observations, within the same ObsIDs as in Sanna et al. (2010). The reduced number of active PCUs on the PCA, and the relative faintness of the source in its atoll phase (count rate between and counts/s/PCU), means that special care must be taken to correct for the frequency drift of the lower kHz QPO. We apply the very same technique as in Barret et al. (2006). It is an iterative procedure, which enables us to bound the QPO frequencies on shorter and shorter integration time, with narrower and narrower frequency intervals. As the integration time decreases, the significance threshold set to the scanning technique (Boirin et al., 2000) is adjusted (e.g the threshold is decreased from for an interval of 50 Hz over a few thousand seconds, to for an interval of 10 Hz over a few hundreds of seconds). The QPO path is then recovered through a linear interpolation between the most significant detections with the shortest integration time. An example of the application of the analysis to two segments of real observations is shown in Figure 1.
Such a technique, which we have used extensively on real and simulated data, is able to correct precisely for the frequency drift of QPOs of the strength reported here. In those simulations, the QPO frequency evolution is modeled by a random walk of a given step (e.g. 0.2-0.5 Hz/second). We follow Timmer & Koenig (1995) and generate synthetic 1 second PDS, for which the underlying model consists of a constant (2) to account for the Poisson noise plus a lorentzian to model the QPO profile, with parameters (Q and RMS) appropriate for each frequency (estimated from the random walk). The simulated PDS are then combined on (16 second timescales) and scanned as the real data to recover the time evolution of the QPO frequency, and to determine Q and RMS, for comparison with the parameters injected in the simulations. The difference between the reconstructed and original Q and RMS parameters can then be evaluated. Those simulations have shown that for QPOs of comparable strength to the one of XTE J1701–462 (mean RMS around 9%), Q can be recovered with an accuracy better than 10% (the accuracy on the RMS is better than a few %).
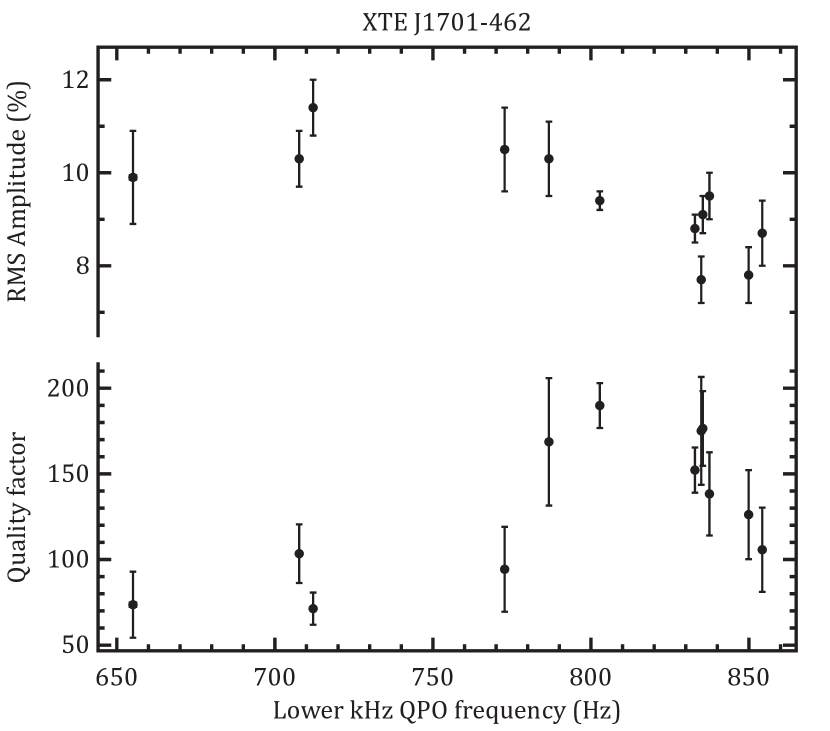
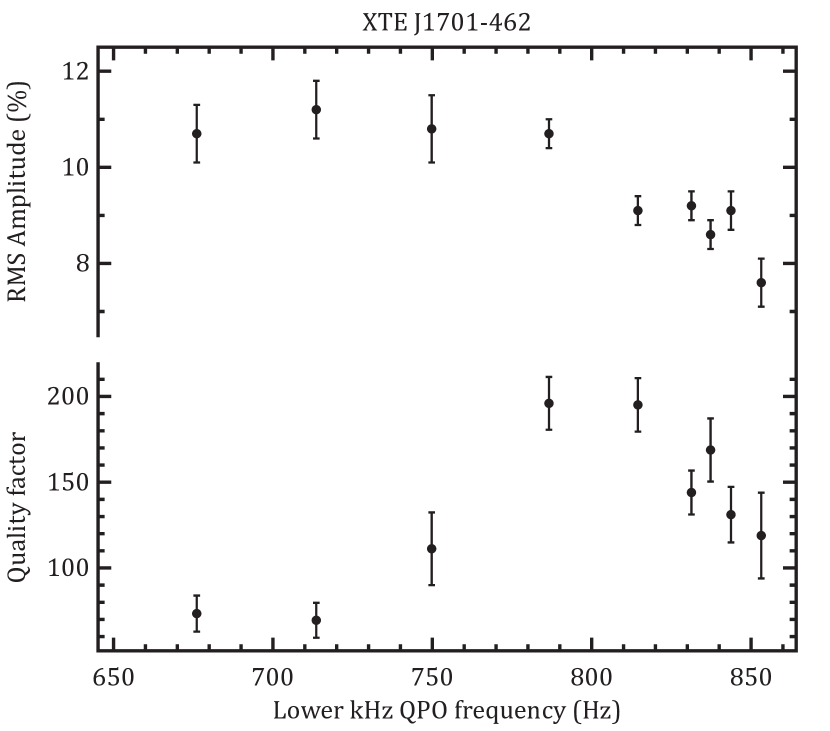
Having reconstructed the QPO frequency evolution, one can compute the mean QPO parameters over the observations, by aligning all the 16 second PDS for which a QPO frequency was estimated, directly from a significant detection or by interpolation between two significant detections, separated by less than 256 seconds, (see Figure 1). Increasing the latter value to say, 512 seconds, does not lead to any changes in the fitted QPO parameters. The best fit results are listed in Table 1 and presented in Figure 2. All the QPOs reported have a , and are therefore highly significant. As can be seen from Figure 2, despite some scatter, there is already evidence that above 800 Hz the quality factor and the RMS amplitude of the QPO drops.
In addition to those highly significant QPOs, we also note that there are hints for two additional single QPOs in the segments 93703-01-03-04 and 93703-01-05-06. No frequency drift corrections are possible for those two QPOs. In the first segment, Hz, for an ratio of 2.9, while in the second one , for an factor of 2.3. Being single and not very significant, it is difficult to draw any firm conclusions. However, it cannot be excluded that they are lower kHz QPOs, extending on both sides the frequency span of figure 2, in which case one would expect them to have low Q factors, as measured (with indeed the caveat that no drift correction could be applied, implying that the measured values are only lower limits on Q).
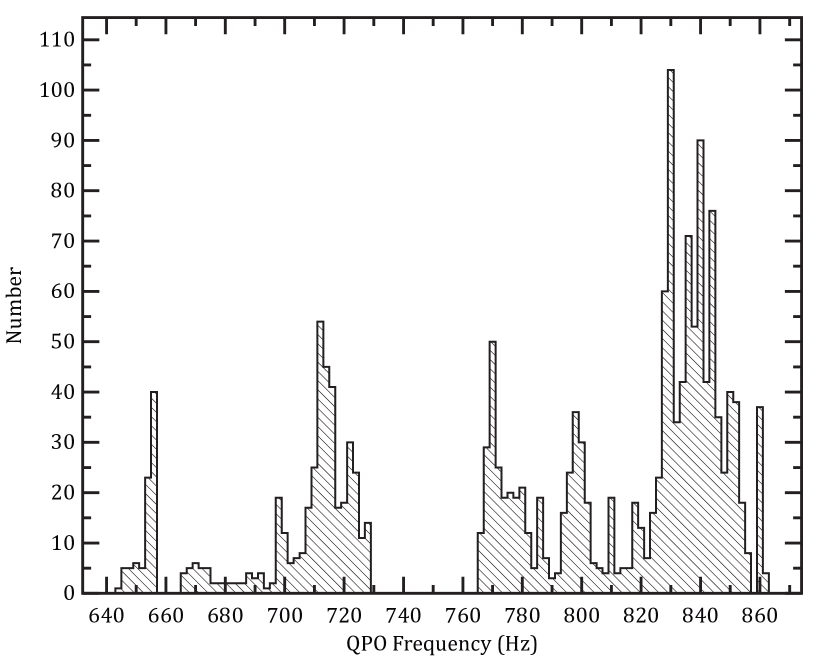
The histogram of interpolated frequencies (measured over 16 seconds) is shown in Figure 3. As can be seen, the frequency span of the lower QPO, although comparable in breadth with other systems, has not been sampled equally (there is a lack of observations around 750 Hz). Grouping the data over constant frequency intervals is therefore not the optimum way to proceed. Instead we have considered adjacent frequency intervals of varying widths, each including 200 QPO frequencies, allowing a better sampling of the peak of the quality factor versus frequency curve. The result is shown in Figure 4. As can be seen, the drops around 800 Hz of the QPO RMS amplitude and quality factor are now much clearer and have significantly less scatter. Thanks to our QPO tracking procedure, we can recover the QPO frequency on a timescale of 16 seconds, whereas Sanna et al. (2010) averaged as many 16 second PDS as required to enable a significant detection. This explains why on average we get larger Q factors than Sanna et al. (2010), and hence a better description of its frequency dependence.
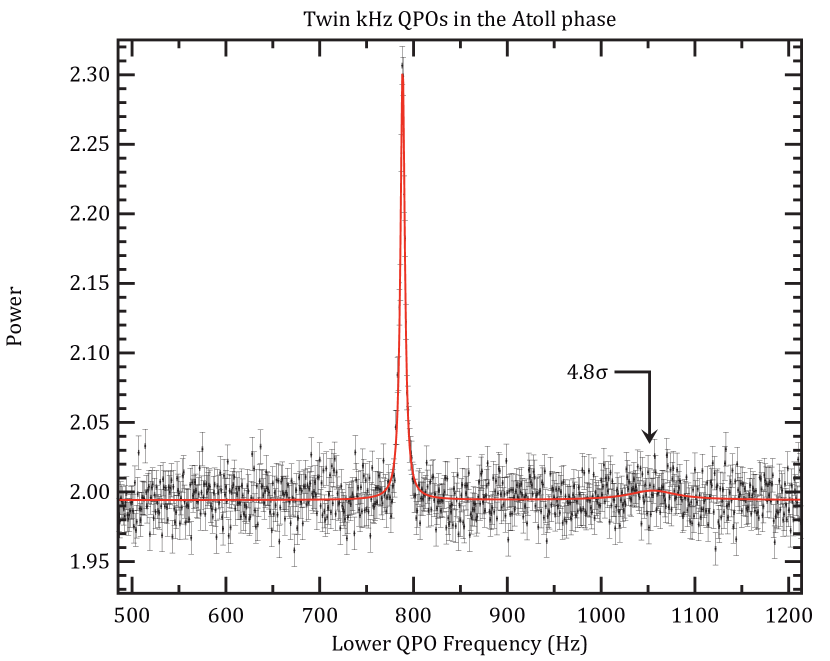
Following Sanna et al. (2010), we have shifted all the 16 second PDS to search for the upper kHz QPO. Sanna et al. (2010) reported a significance detection (single trial) with a frequency separation of Hz. Using our procedure, the significance of the upper kHz QPO detected rises to 4.8 (single trial significance), for a frequency separation of Hz, consistent with the value of Sanna et al. (2010). At the same time, the significance of the main peak increased from to more than in our analysis (see Figure 5). In the two ObsIDs of the Z phase, in which the simultaneous twin kHz QPOs are the most significant () (92405-01-40-04 and 92405-01-40-05), we have measured a frequency difference of and Hz respectively, i.e. consistent within errors with the frequency difference we have measured in the Atoll phase.
3 Discussion
Based on the observations reported here, our main findings can be summarized as follows:
-
•
XTE J1701–462 behaves similarly to the other sources we have studied. In the atoll state, its lower kHz QPOs are narrow. Correcting for the frequency drift, we have been able to show that its quality factor reaches a maximum of 200 around 800 Hz before dropping off sharply. This effect is even visible within a limited sample of observations, when the drift correction is applied. We have also found a weaker upper kHz QPO with a significance greater than previously reported, using the shift-and-add technique.
-
•
Following Barret et al. (2006), we estimate the frequency at the ISCO by adding Hz , which we infer to be around 900 Hz (albeit with large uncertainty due to the limited sample of the curve in the available data set). This gives Hz. No upper QPO above that frequency should be detected in XTE J1701–462. This is consistent with the findings of Sanna et al. (2010), who reported upper QPOs with frequencies less than Hz. From , we can estimate the gravitational masses of the neutron stars (Miller et al., 1998):
(1) where is the dimensionless angular momentum of the star. The inferred mass of the neutron star in XTE J1701–462 would therefore be .
-
•
As shown by Sanna et al. (2010), when the source is in the Z phase, the properties of its QPOs are consistent with those observed in other Z sources: they are weak and broad (the maximum Q values are about 10 and the RMS less than %). For the purpose of this paper, we have also re-analyzed the segments of data in which Sanna et al. (2010) reported a QPO, and our results are globally consistent with theirs. Note however that no frequency drift corrections can be applied when recovering the quality factor, hence the measured values should be considered as lower limits. In any case, our independent analysis confirms that no highly coherent QPOs have been detected from XTE J1701–462 in the Z phase. This indeed suggests that there is a parameter which alters the Q value, in addition to the radius at which the QPOs originate. Sanna et al. (2010) conclude that these results weaken the hypothesis relating the drop in coherence observed in many sources, and in the Atoll phase of the one under investigation, to the presence of the ISCO, because there are evidently other properties of the accretion flow that can change the quality factor of QPOs. We point out, though, that the drop in coherence that we relate to the ISCO is a very characteristic phenomenon. In a given source, it happens always at the same frequency, at the higher end of the frequency range of kHz QPOs. There is therefore a significant difference between the drop in coherence we relate to the ISCO and the change in coherence in the different states of this source. In our opinion, this implies that different phenomena are producing the two effects.
Let us now discuss on some possible interpretations. The change in coherence of the kHz QPOs in XTE J1701-462 between the Atoll and Z phase, has to be related to a global change of the accretion configuration.
In the framework of the toy model proposed by Barret et al. (2007), we argue that the difference is related to the scale height of the disk, exactly the same process that we propose as responsible for the general difference in coherence between QPOs in Atoll and Z sources. Consistent with this idea, standard disk accretion theory suggests that at rates approaching Eddington (which is expected in the Z state) the disk half-thickness at its inner edge will be comparable to the orbital radius there (Shakura & Sunyaev, 1973), and that as a consequence the inward radial drift speed (which scales as , where is the disk half-thickness) will be large as well. As discussed in Barret et al. (2006), a large inward speed will necessarily decrease Q regardless of other factors. It is therefore not surprising that high luminosity sources have lower Q, as observed (Méndez, 2006).
We note that alternative explanations are under study through 3D MHD simulations that show oscillations promisingly similar to the kilohertz QPOs (for a recent discussion see Bachetti et al. (2010)). In these simulations, the lower and upper kHz QPOs are emitted from hotspots on the surface of the star, produced by streams of matter originating respectively from the funnel flow around the magnetic pole and from instabilities at the inner edge of the disk. The properties of these QPOs in simulated systems with an enhanced variety of physical inputs (including different configurations of the disk) are currently under study.
4 Conclusions
The source XTE J1701–462, which has been observed in both the atoll and Z phases, gives us a unique opportunity to explore the relation between frequency and quality factor. This relation has been claimed for previous atoll sources to provide evidence of the innermost stable circular orbit. It was expected, however, that for higher-luminosity sources, in which the disk becomes geometrically thick and the inward radial speed is thus large, the quality factors would be systematically lower than they are in the lower-luminosity atoll sources, as observed (Méndez, 2006). XTE J1701–462 does show exactly this behavior. In the atoll state its vs. phenomenology is consistent with that of other sources, but in the Z state the quality factors are systematically smaller than in the atoll state. The change is over the whole range of the QPO frequencies and is unlike the abrupt drop observed in the atoll phase, which only happens at the higher end of the frequency range. As a consequence, we do not agree with Sanna et al. (2010) that the different coherence in the atoll and Z phases of XTE J1701–462 weakens the ISCO hypothesis.
We can ask: what behavior would contradict the ISCO picture? As discussed in other papers (e.g. Barret et al., 2007), there are several possibilities including (1) a lower or upper kHz QPO frequency in another state that is significantly larger than the projected maximum due to the ISCO, (2) a peak in followed by a sharp drop at a frequency significantly less than seen in the atoll state, or (3) a peak in followed by a sharp drop in any source at a frequency that would imply an unreasonable ISCO frequency (e.g., below 800 Hz). None of these have yet been seen. Therefore, although the importance of the implications demand further critical analysis, the interpretation is still consistent with all existing data to date.
MCM acknowledges NSF grant AST0708424. The authors wish to thank an anonymous referee for helpful comments.
References
- Bachetti et al. (2010) Bachetti, M., Romanova, M. M., Kulkarni, A., Burderi, L., & di Salvo, T. 2010, MNRAS, 403, 1193
- Barret et al. (2005a) Barret, D., Kluźniak, W., Olive, J. F., Paltani, S., & Skinner, G. K. 2005a, MNRAS, 357, 1288
- Barret et al. (2005b) Barret, D., Olive, J., & Miller, M. C. 2005b, MNRAS, 361, 855
- Barret et al. (2006) —. 2006, MNRAS, 370, 1140
- Barret et al. (2007) —. 2007, MNRAS, 376, 1139
- Boirin et al. (2000) Boirin, L., Barret, D., Olive, J. F., Bloser, P. F., & Grindlay, J. E. 2000, A&A, 361, 121
- Boutelier et al. (2010) Boutelier, M., Barret, D., Lin, Y., & Török, G. 2010, MNRAS, 401, 1290
- Boutelier et al. (2009) Boutelier, M., Barret, D., & Miller, M. C. 2009, MNRAS, 399, 1901
- Homan et al. (2007) Homan, J., et al. 2007, ApJ, 656, 420
- Homan et al. (2010) —. 2010, ApJ, 719, 201
- Leahy et al. (1983) Leahy, D. A., Darbro, W., Elsner, R. F., Weisskopf, M. C., Kahn, S., Sutherland, P. G., & Grindlay, J. E. 1983, ApJ, 266, 160
- Lin et al. (2009a) Lin, D., Altamirano, D., Homan, J., Remillard, R. A., Wijnands, R., & Belloni, T. 2009a, ApJ, 699, 60
- Lin et al. (2009b) Lin, D., Remillard, R. A., & Homan, J. 2009b, ApJ, 696, 1257
- Méndez (2006) Méndez, M. 2006, MNRAS, 371, 1925
- Miller et al. (1998) Miller, M. C., Lamb, F. K., & Psaltis, D. 1998, ApJ, 508, 791
- Press et al. (1992) Press, W. H., Teukolsky, S. A., Vetterling, W. T., & Flannery, B. P. 1992, Numerical recipes in FORTRAN. The art of scientific computing, ed. W. H. Press, S. A. Teukolsky, W. T. Vetterling, & B. P. Flannery
- Sanna et al. (2010) Sanna, A., et al. 2010, ArXiv e-prints
- Shakura & Sunyaev (1973) Shakura, N. I., & Sunyaev, R. A. 1973, A&A, 24, 337
- Timmer & Koenig (1995) Timmer, J., & Koenig, M. 1995, A&A, 300, 707
- van der Klis (1989) van der Klis, M. 1989, in Timing Neutron Stars, ed. H. Ögelman & E. P. J. van den Heuvel, 27–+
- van der Klis (2006) van der Klis, M. 2006, Rapid X-ray Variability, ed. Lewin, W. H. G. & van der Klis, M., 39–112
| Num | ObsID | Date | Time | Duration | C | Q | RMS | ||
|---|---|---|---|---|---|---|---|---|---|
| 01 | 93703-01-02-04 | 2007/07/24 | 08–44–11 | 1968 | 116.9 | 7.0 | |||
| 02 | 93703-01-02-04 | 2007/07/24 | 10–15–27 | 1280 | 117.3 | 6.3 | |||
| 03 | 93703-01-02-05 | 2007/07/25 | 10–02–49 | 1920 | 105.8 | 8.8 | |||
| 04 | 93703-01-02-05 | 2007/07/25 | 11–23–27 | 3376 | 66.7 | 16.0 | |||
| 05 | 93703-01-02-08 | 2007/07/25 | 13–14–40 | 2304 | 104.9 | 11.0 | |||
| 06 | 93703-01-02-11 | 2007/07/25 | 05–13–35 | 2528 | 108.2 | 8.1 | |||
| 07 | 93703-01-02-11 | 2007/07/25 | 06–40–31 | 3392 | 68.1 | 20.4 | |||
| 08 | 93703-01-02-11 | 2007/07/25 | 08–14–23 | 208 | 71.0 | 6.3 | |||
| 09 | 93703-01-03-00 | 2007/07/29 | 03–19–30 | 3344 | 56.4 | 5.6 | |||
| 10 | 93703-01-03-00 | 2007/07/29 | 04–53–19 | 3408 | 39.2 | 9.7 | |||
| 11 | 93703-01-03-00 | 2007/07/29 | 06–27–27 | 2976 | 42.1 | 9.1 | |||
| 12 | 93703-01-03-02 | 2007/07/29 | 11–23–57 | 1360 | 39.7 | 5.2 |