The AGB population of NGC 6822
Abstract
The metallicity gradient and the stellar distribution within the Local Group dwarf galaxy NGC 6822 has been studied photometrically using asymptotic branch stars (AGB). In order to study the stellar and metallicity distribution, the carbon- and oxygen-rich AGB stars have been isolated using deep high-quality near-infrared UKIRT photometry. The ratio between them, the C/M ratio, has been used to derive the [Fe/H] abundance within the galaxy. The [Fe/H] abundance and stellar distribution were analysed as a function of galactic radius. A mean C/M ratio of has been found which corresponds to an iron abundance of [Fe/H] dex, with variations in the north and south, as well as at larger galactocentric distances. Variations in the magnitude of the tip of the red giant branch has also been detected.
1 University of Hertfordshire, Science and Technology Research Institute, Hatfield AL10 9AB, United Kingdom
2 Institute of Astronomy, Madingley Road, Cambridge, Cambridgeshire, CB3 OHA, United Kingdom
3 European Southern Observatory, Karl-Schwarzchildstr-Strasse 2, D-85748, Garching bei München, Germany
1 Introduction
The Local Group dwarf galaxy NGC 6822 is similar in size, structure and metallicity to the Small Magellanic Cloud (SMC). The detection of RR Lyrae stars by Baldacci et al. (2004) shows that NGC 6822 began forming stars at least 10 Gyrs ago. Observations of the many HII and OB associations confirm that star formation is still ongoing. Young blue stars trace active star formation in both the bar and the large HI envelope (de Blok & Walter 2006; Komiyama et al. 2003). Old and intermediate age red giant branch (RGB) and AGB stars, have been detected in the bar and the HI envelope of the galaxy (Cioni & Habing 2005) but according to Letarte et al. (2002) are concentrated in a stellar halo. Due to its close proximity (kpc) (Mateo 1998) NGC 6822 has been the focus of numerous investigations of its stellar content, e.g. de Blok & Walter (2006). HII regions and planetary nebulae have also been studied extensively. Several estimates have been made of the iron abundance across a range of ages. Gallart et al. (1996) obtained [Fe/H] dex from the slope of the RGB. Further analysis of RGB stars by Tolstoy et al. (2001) yielded a value of [Fe/H] dex from the strength of CaII absorption lines. Looking at the younger stellar population, Venn et al. (2001) derived an average value of [Fe/H] dex from optical spectroscopy of A-type super-giants. These results suggest, as expected, that the chemical enrichment of the interstellar medium has been a continual process due to multiple stellar generations.
2 Observations and data reduction
Observations were obtained using the Wide Field Camera (WFCAM) on the m United Kingdom Infrared Telescope (UKIRT) in Hawaii during two runs, in April and November . WFCAM is comprised of four Rockwell-Hawaii-II infrared detector arrays (HgCdTe 2048 2048), with a combined field of view of 3 deg2 (a tile) on the sky and a pixel scale of . A mosaic of four tiles was obtained in three broad-band filters (, and ) covering an area of deg2 centred on NGC 6822 (). The total integration time of observations in the band was sec, from the co-addition of three sec exposures for each pointing in a dithered pattern of points. In the and band the total integration time was sec for exposures following a similar serving strategy. Data reduction, including all the standard steps for instrumental signature removal was completed using the WFCAM pipeline at the Institute of Astronomy in Cambridge. Sources extracted using the pipeline were given a morphological classification from which assorted quality control measures are computed. Astrometric and photometric calibrations were then performed based on the 2MASS point source catalogue (Irwin et al. 2004). Duplicated sources were removed using the photometric error and the morphological classification to select a ‘best’ unique entry per object and produce a final catalogue ( sources). With the exception of one frame observed under poor conditions, the average seeing across the two observing runs was between . Observations reached a depth of , and mag in the , and bands respectively. The AGB sources are expected to have magnitudes brighter than mag, and therefore our photometry is almost complete at these magnitudes. Reddening values across NGC 6822 have been found to vary widely from the centre to the outer regions (Hernández-Martínez et al. 2009). This variation is likely to be intrinsic to NGC 6822 rather than a result of variation in the foreground component. As there is no published extinction map for this galaxy no corrections were made for internal reddening. A reddening value of mag has been applied to account for foreground extinction (Schlegel et al. 1998). To ensure a reliable data set, only sources that were identified as stellar (or probably stellar) and that were consistently detected in all three photometric bands, have been selected for the analysis conducted here.
3 Foreground removal
The observations suffer from heavy foreground contamination from stars in the Milky Way (MW). This was removed using a colour selection criterion based on the work of Gullieuszik et al. (2008). The observed area was subdivided into a grid of regions, each of dimensions arcmin, roughly centred on the optical co-ordinates of the galaxy. Sources from the centre of the galaxy were plotted on a colour-colour diagram (, ), and then overlaid with sources from a region at the periphery of the galaxy that was dominated by MW foreground stars. There is a clear separation in the colour between the sources from the centre and those from the outer region at mag, with few MW stars redder than this. Assuming that foreground stars are evenly distributed across the surface of the galaxy the stars with mag are most likely members of NGC 6822.
4 The tip of the RGB
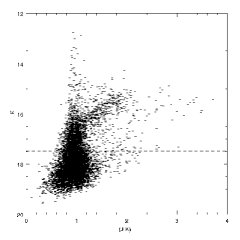
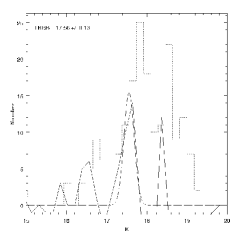
The luminosity discontinuity at the tip of the red giant branch (TRGB) is one of the most prominent features in the magnitude distribution of a stellar population and is commonly used to identify AGB stars in galaxies outside the MW, e.g. (Kang et al. 2006). Fig. 2 shows a colour-magnitude diagram (CMD) of sources belonging to NGC 6822. A decline in the number of sources at bright magnitudes identifies the TRGB at mag. In order to validate the position of the TRGB, magnitude distributions were constructed for each region of the grid and the TRGB discontinuity was identified first by eye. The TRGB was found to vary across NGC 6822 by mag, with an average value of mag, in reasonable agreement with the value estimated from the CMD. As a further check, the Sobel edge detection algorithm was also applied to each magnitude distribution to confirm the position of the TRGB discontinuity (Lee et al. 1993). The filter effectively measures the slope of the histogram, and the first derivative produces a peak where the slope of the original histogram is greatest. After the peak corresponding to the TRGB was identified with the Sobel filter, it was fitted with a Gaussian, whose mean and sigma were taken as the TRGB magnitude and associated error (Fig. 2). Corrections have been applied to the derived TRGB magnitudes, to account for the slight bias in the Sobel filter, according to the work of Cioni et al. (2000). Using the Sobel filter the TRGB was identified in each region of the observed area and a variation of mag was found across the surface of the galaxy, with an average value of mag. For the purpose of identifying the AGB stars in the sample a single TRGB value of mag will be used. This value was determined from the grid region with the highest concentration of sources (). Note, the size of the TRGB magnitude variation indicate that the effects of metallicity, age and reddening variations within the NGC 6822 are not negligible.
5 The AGB stars
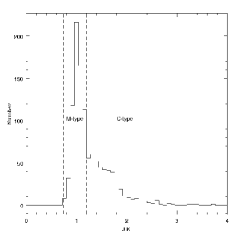
There are two spectral types of AGB stars, M-type (C/O 1) and C-type (C/O 1), respectively. These two spectral types are clearly separated on a CMD (). M-type stars follow a vertical feature above the TRGB with a large range of magnitudes and nearly constant colour, while C-type stars display a smaller range of magnitudes but a wider range of colours, resulting in a ‘red tail’ extending diagonally upwards on the CMD (Fig.2). Thus, colour separation has commonly been used to identify the C- and M-type components of the AGB population (Kang et al. 2005). The best estimate of the position of this colour separation from the CMD (Fig. 2) falls at mag. The exact position has been verified by eye from the discontinuity in the colour histograms of AGB sources (Fig. 3). In this figure, the highest peak relates to M-type stars followed by a significant drop and then a plateau which contains the C-type stars.
The position of the colour separation varies across the surface of the galaxy by mag. This may be due to extinction or variations in the stellar population (metallicity and age). As for the TRGB magnitude, a standard value ( mag) was selected for the purposes of separating C- and M-type stars in the sample. The application of a sharp colour selection criteria suggests a strict transition between the two evolutionary types of AGBs, however this is unlikely to be the case in reality. After selecting the AGB stars from the sample, they span a colour range of mag. Therefore, in accordance with Bessell & Brett (1988), it was decided to apply a ‘blue limit’, mag, to the selection of M-type stars in order to exclude late type K-stars, which most probably are not AGB stars.
6 The C/M ratio
A catalogue of 3820 AGB sources has been generated from this work, containing C-type stars and M-type stars. Spatial variations in the C/M ratio are a useful indirect indicator of the metallicity distribution, where a higher ratio implies a lower metallicity. The calibration of the C/M-[Fe/H] relation has been refined recently by Cioni (2009), based on the work of Battinelli & Demers (2005). Using this relation a mean C/M ratio of has been determined for NGC 6822, which corresponds to a mean [Fe/H] value of dex. This is consistent with the mean metallicity of the old RGB population in this galaxy determined spectroscopically by Tolstoy et al. (2001).
7 Conclusions
Here, we have derived an overall C/M ratio of and an iron abundance of dex. Examining the ratio and iron abundance in different regions of the grid used above we see a spread of and dex across NGC 6822. The remaining analysis of this data will focus on the distribution of the AGB sources in NGC 6822 using source density plots and the variation of the C/M ratio and TRGB magnitude with galactocentric distance and azimuthal angle. These results are still under examination but it is clear that NGC 6822 has and will continue to be an interesting and challenging object to study.
References
- Baldacci et al. (2004) Baldacci, L., Rizzi, L., Clementini, G., & Held, E. V. 2004, in IAU Colloq. 193: Variable Stars in the Local Group, edited by D. W. Kurtz & K. R. Pollard, vol. 310 of Astronomical Society of the Pacific Conference Series, 91
- Battinelli & Demers (2005) Battinelli, P., & Demers, S. 2005, A&A, 434, 657
- Bessell & Brett (1988) Bessell, M. S., & Brett, J. M. 1988, PASP, 100, 1134
- Cioni (2009) Cioni, M. 2009, A&A, 506, 1137
- Cioni & Habing (2005) Cioni, M., & Habing, H. J. 2005, A&A, 429, 837
- Cioni et al. (2000) Cioni, M., van der Marel, R. P., Loup, C., & Habing, H. J. 2000, A&A, 359, 601
- de Blok & Walter (2006) de Blok, W. J. G., & Walter, F. 2006, AJ, 131, 343
- Gallart et al. (1996) Gallart, C., Aparicio, A., & Vilchez, J. M. 1996, AJ, 112, 1928
- Gullieuszik et al. (2008) Gullieuszik, M., Held, E. V., Rizzi, L., Girardi, L., Marigo, P., & Momany, Y. 2008, MNRAS, 388, 1185
- Hernández-Martínez et al. (2009) Hernández-Martínez, L., Peña, M., Carigi, L., & García-Rojas, J. 2009, A&A, 505, 1027
- Irwin et al. (2004) Irwin, M. J., Lewis, J., Hodgkin, S., Bunclark, P., Evans, D., McMahon, R., Emerson, J. P., Stewart, M., & Beard, S. 2004, in Society of Photo-Optical Instrumentation Engineers (SPIE) Conference Series, edited by P. J. Quinn & A. Bridger, vol. 5493 of Society of Photo-Optical Instrumentation Engineers (SPIE) Conference Series, 411
- Kang et al. (2006) Kang, A., Sohn, Y., Kim, H., Rhee, J., Kim, J., Hwang, N., Lee, M. G., Kim, Y., & Chun, M. 2006, A&A, 454, 717
- Kang et al. (2005) Kang, A., Sohn, Y., Rhee, J., Shin, M., Chun, M., & Kim, H. 2005, A&A, 437, 61
- Komiyama et al. (2003) Komiyama, Y., Okamura, S., Yagi, M., Furusawa, H., Doi, M., Hamabe, M., Imi, K., Kimura, M., Miyazaki, S., Nakata, F., Okada, N., Ouchi, M., Sekiguchi, M., Shimasaku, K., Yasuda, N., Arimoto, N., & Ikuta, C. 2003, ApJ, 590, L17
- Lee et al. (1993) Lee, M. G., Freedman, W. L., & Madore, B. F. 1993, ApJ, 417, 553
- Letarte et al. (2002) Letarte, B., Demers, S., Battinelli, P., & Kunkel, W. E. 2002, AJ, 123, 832
- Mateo (1998) Mateo, M. L. 1998, ARA&A, 36, 435
- Schlegel et al. (1998) Schlegel, D. J., Finkbeiner, D. P., & Davis, M. 1998, ApJ, 500, 525
- Tolstoy et al. (2001) Tolstoy, E., Irwin, M. J., Cole, A. A., Pasquini, L., Gilmozzi, R., & Gallagher, J. S. 2001, MNRAS, 327, 918
- Venn et al. (2001) Venn, K. A., Lennon, D. J., Kaufer, A., McCarthy, J. K., Przybilla, N., Kudritzki, R. P., Lemke, M., Skillman, E. D., & Smartt, S. J. 2001, ApJ, 547, 765