Nonlinear growth with the microwave intensity in radiation-induced magnetoresistance oscillations
Abstract
We report the observation of inverse-magnetic-field-periodic, radiation-induced magnetoresistance oscillations in GaAs/AlGaAs heterostructures prepared in W. Wegscheider’s group, compare their characteristics with similar oscillations in V. Umansky’s material, and describe the lineshape variation vs. the radiation power, , in the two systems. We find that the radiation-induced oscillatory , in both materials, can be described by , where is the amplitude, is the damping parameter, and is the oscillation frequency. Both and turn out to be insensitive to . On the other hand, grows nonlinearly with .
pacs:
73.40.-c,73.43.Qt, 73.43.-f, 73.21.-bI introduction
Vanishing electrical resistance is an interesting characteristic, and superconductivity is a well known example of this phenomenon.1 Another example occurs in the quantum Hall two-dimensional electronic system (2DES), where the application of a magnetic field induces zero-resistance states in conjunction with quantized Hall resistances at low temperatures.2 ; 3 A third example occurs in the microwave and terahertz irradiated 2DES where the radiation induces vanishing resistance states without concurrent Hall quantization.4 ; 5 This latter example has shown the possibility of photo-exciting into zero-resistance states in a condensed matter system.
Photo-excited transport in the 2DES has become a topic of experimental and theoretical interest in the recent past.4 ; 5 ; 6 ; 7 ; 8 ; 9 ; 10 ; 11 ; 12 ; 13 ; 14 ; 15 ; 16 ; 17 ; 18 ; 19 ; 20 ; 21 ; 22 ; 23 ; 24 ; 25 ; 26 ; 27 ; 28 ; 29 ; 30 ; 31 ; 32 ; 33 ; 34 ; 35 ; 36 ; 37 ; 38 ; 39 ; 40 ; 41 Periodic in radiation-induced magnetoresistance oscillations, which lead into the radiation-induced zero-resistance states, are now understood to be a consequence of radiation-frequency () and magnetic field () dependent, scattering at impurities 24 ; 26 ; 27 and/or a change in the distribution function.6 ; 30 ; 36 And, vanishing resistance at the oscillatory minima is asserted to be an outcome of negative resistance instability and current domain formation.25 ; 32 ; 39 Although there has been much progress, there remain many aspects that could be better understood from both the experimental and theoretical perspectives. Here, some open problems include understanding (a) the observed activated temperature dependence at the resistance minima, (b) the role of the potential landscape in influencing the magnitude of the observed oscillatory effect, and (c) the nature of the overlap with quantum Hall effect.23
A further topic of interest is to examine, in detail, the growth of the oscillatory effect vs. the radiation intensity, . So far as theoretical results regarding this aspect are concerned, a number of works have numerically evaluated the radiation-induced magnetoresistance oscillations for several and graphically presented the results.24 ; 31 ; 33 In contrast, Dmitriev and co-workers,30 have made the prediction that, in the linear response regime, the correction to the dark dc conductivity is linear in , see eqn. 16, ref. 30 .
A comparison of experiment with theory, so far as the -dependence is concerned, could help to identify the relative importance of the invoked-mechanisms in the above mentioned theories. Further, the novel proposal that these radiation-induced phenomena could constitute a new example of complex emergence, where self-organization can arise from a number of basic interactions with remarkable collective aspects,34 has also identified the need to better understand the dependence. Finally, as a related issue, it is also of interest to compare the growth of the radiation-induced resistance oscillations with in materials prepared in different laboratories in order to determine whether wafer preparation practices, which influence the scattering landscape within the electronic system and impact the lifetimes / observed characteristics, lead to a perceptible difference in the measurements.
Thus, we examine the growth of the radiation-induced magneto-resistance oscillations with in GaAs/AlGaAs devices. We also compare the radiation-induced transport in devices fabricated from MBE material grown by Wegscheider (W), with results from similar material prepared by Umansky (U). We find that the radiation-induced oscillatory diagonal resistance, , in both materials can be described by , where is the amplitude, is the damping parameter, and is the -dependent magneto-resistance oscillation frequency. Both and turn out to be insensitive to and the temperature, . On the other hand, grows nonlinearly with , and the non-linearity depends on the . Such growth of with and has not been predicted.
II Experiment
Low frequency lock-in based electrical measurements were carried out at with the samples mounted inside a solenoidal magnet near the open end of a waveguide that is also closed at the other end.4 ; 13 The samples were immersed in pumped liquid-helium, and the temperature was determined with the aid of calibrated resistance thermometers and the vapor-pressure thermometry. Microwaves were conveyed via the waveguide, and the intensity was set at the source, as indicated. Hardware between source and sample introduces intensity attenuation. A standing wave pattern also produces an axial intensity variation within the waveguide, with a possible further intensity reduction at the sample. Since the -field readout of a superconducting magnet power supply is not always reliable at low , the -field could be characterized in-situ by performing Electron Spin Resonance (ESR) of DiPhenyl-Picryl-Hydrazal (DPPH). The DPPH-ESR identifies via the relation ].8 The W-GaAs/AlGaAs single heterostructures were nominally characterized by an electron density, and a mobility of . The U-material was roughly comparable, albeit with a slightly higher , . The 2DES’s were prepared, as is usual, using the Persistent Photo-Conductivity (PPC) effect, with a brief illumination by a LED. Since the realized low-temperature and depends upon the cool-down and illumination procedure via the PPC effect, a given specimen can show associated preparation dependent changes in the radiation-induced characteristics. Results are reported here for two sets of measurements, labeled U1 and U2, on a U-specimen, and measurements, labeled W1, W2, and W3 on a set of three W-specimens.
III Results
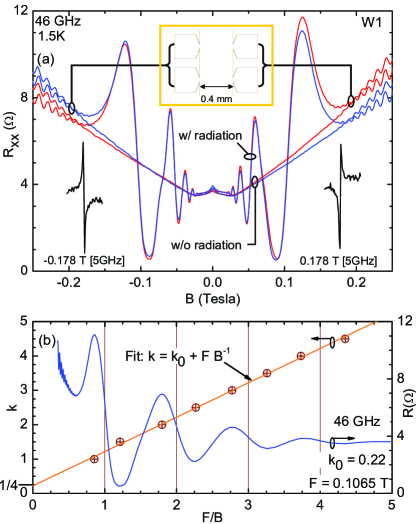
Figure 1(a) exhibits the data for a wide Hall bar (W1) fabricated from the W-material. The figure shows the measured both in the dark (w/o radiation) and under photo-excitation (w/ radiation). Also shown are calibration markers obtained from the ESR of DPPH at . The figure shows large amplitude radiation-induced magneto-resistance oscillations, as the is reduced to roughly of the dark value at deepest resistance minimum. Further, the w/o radiation trace intersects the w/radiation traces at the nodes of the oscillations.4 ; 24 Similar results are obtained on both the left- and right- sides of the device. The small asymmetry observed under -reversal is attributed to an admixture between the diagonal and off-diagonal (Hall) signals.
In Fig. 1(b), on the right ordinate has been plotted vs. in order to exhibit the periodicity of the oscillations. The oscillatory maxima (minima) were then assigned with integers (half-integers), see the left ordinate, beginning with for the maximum at the lowest . The plot of (left ordinate) vs. has been subjected to a linear fit, i.e., , which is represented by the orange curve in Fig. 1(b). Here, represents the phase, and is the frequency of the radiation-induced magneto-resistance oscillations. Thus, the fit extracted , see Fig. 1(b), confirms a ”1/4-cycle phase shift”.8 In addition, at , suggests that , slightly lower than the standard value, , for GaAs/AlGaAs system.8 In Fig. 1(b), the abscissa has been scaled to , using the indicated above.
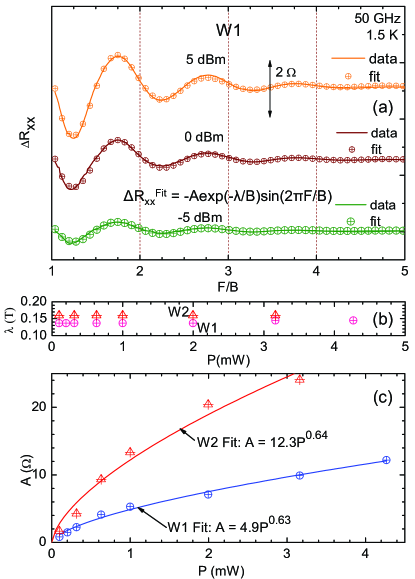
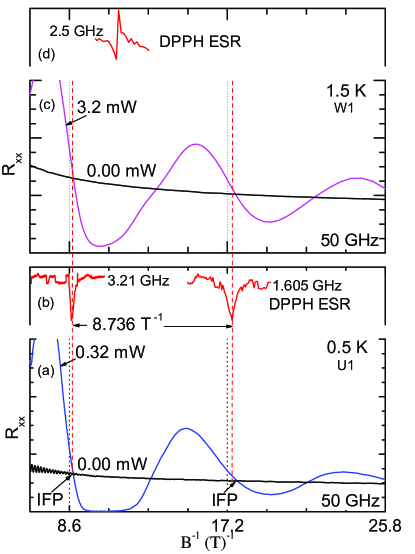
Figure 2 presents a direct comparison of the transport characteristics in W1 and U1 at . Figure 2(a) and (b) correspond to the experiment on the U-specimen at , while Fig. 2(c) and (d) correspond to the W1 experiment at . Here, the DPPH-ESR -markers shown in Fig. 2(b) and 2(d) served to calibrate for the corresponding experiments. Fig. 2(a) and (c) show that both specimens exhibit Integer Fixed Points (IFP) at the same . IFP’s are points where the dark trace intersects the photo-excited trace. IFP’s occur in the vicinity of , where equals the cyclotron frequency, and .24 If two material systems are similar, then one expects the IFP’s to occur at the same at constant , and this is what is observed in the data. Thus, for example, the relative diffusion of Al into the GaAs 2DES seems no different in the two systems, since greater diffusion in one system than the other would lead to observable differences in and thus the IFP’s.
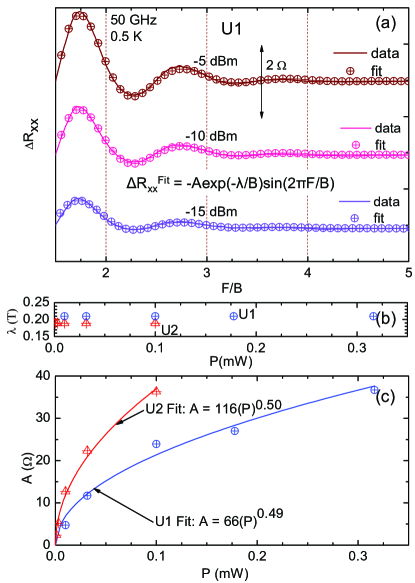
To examine the growth of the radiation-induced oscillations with , Fig. 3 presents the of U1 for several at . Also shown in the figure are fits to the data using . Here, a slowly varying background, approximately equaling the dark trace, was removed from the photo-excited data to realize . Although this fit function includes three parameters, , , and , the oscillation period in is independent of the radiation-intensity, and thus, is a constant. Further, the damping constant, ,9 turns out to be insensitive to , as is evident in Fig. 3(b), which shows vs. for U1 and U2. The small difference in obtained for U1 and U2 in different cool-downs is attributed to the PPC-effect dependence of the electronic properties in the GaAs/AlGaAs system. Thus, the main free parameter in the fit-function is the amplitude, , of the oscillations. In Fig. 3(c), we exhibit the fit extracted vs. for U1 and U2. The figure shows the sub-linear growth of with . Also shown are power law fits, . Here, and for U1 and U2, respectively. varies between U1 and U2 because the effective intensity attenuation factor is different in the two experiments.
Fig. 4(a) shows power-dependent vs at for W1, along with lineshape fits. As above, was insensitive to , and the of W1 agreed with the of U1, see Fig. 2, and also U2. Fig. 4(b) exhibits vs. for W1 and W2. Again, is insensitive . Note that . If the damping is written as , where and represent finite frequency broadening temperature and lifetime, respectively,9 then the imply that and . Thus, , i.e., there is more broadening in the U-specimen. Next, in Fig. 4(c), we exhibit the fit extracted vs. for W1 and W2. The figure suggests a nonlinear growth of with . Also shown are the fits, , which suggest that and for W1 and W2, respectively.
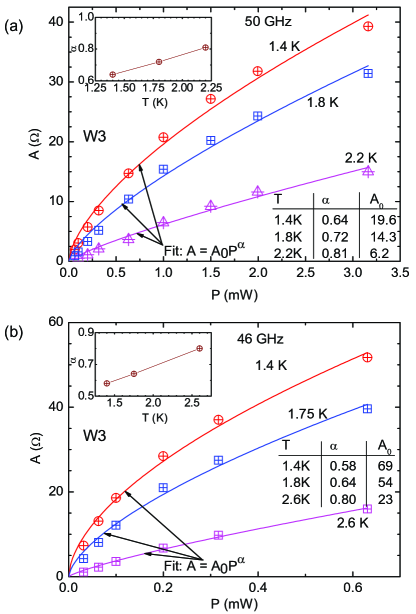
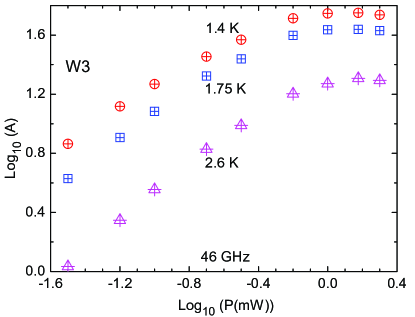
For a third W-specimen labeled W3, Fig. 5 reports the influence of the temperature on the growth of vs. , where is extracted, as before, from line-shape fits of the oscillatory data to . Parenthetically, we note here that such fits suggested a general insensitivity of to the experimental parameters , , and . Indeed, served to fit all the , , and covered in Fig. 5.
Fig. 5(a) and 5(b) indicate that, as expected, at a constant , grows with decreasing both at [Fig. 5(a)] and [Fig 5(b)]. Further, the figures show that the vs. curves exhibit greater curvature at lower temperatures. The vs. have been fit once again to in order to quantify the observations; the fit-extracted and have been summarized in tabular form within Fig. 5(a) and Fig. 5(b). These fit-extracted have also been plotted vs. in the inset to these figures. These insets suggest that decreases with decreasing temperatures, consistent with the observed increased non-linearity at lower temperatures. Using this result, one might attribute, at least in part, the smaller in the U-specimens, see Fig. 3(c), in comparison to the W-specimens W1 and W2, see Fig. 4(c), to the lower temperature in the U-measurements.
Note that, at , all three W-specimens, with comparable material properties, exhibit the same , within uncertainties, at the lowest pumped 4He temperatures, cf. Fig. 4(c) and Fig. 5(a). In addition, a comparison of the reported in Fig. 5(a) and Fig. 5(b) also suggests that reducing the microwave frequency at a fixed tends to reduce the , i.e., increase the non-linearity.
The nonlinear power law intensity variation reported here is associated with modest excitation. It is known that the amplitude of the radiation-induced magneto-resistance oscillations saturates at higher , and further, there is a ”breakdown” and a decrease in the amplitude at the highest .13 The results shown thus far in Fig. 1 - Fig. 5 do not correspond to such high .
To illustrate the behavior in the higher regime, we exhibit in Fig. 6, the vs. at , when efficient coupling has been realized between the microwave source and the specimen, i.e, when the sample has been located at the intensity peak in the standing wave pattern realized within the waveguide sample-holder. The plot exhibited in Fig. 6 shows saturation, and subsequent decrease with increasing , at the highest , consistent with our previous report.13
As mentioned, most theories have exhibited numerically evaluated or including radiation-induced oscillations at several ,24 ; 31 ; 33 , while Dmitriev et al,30 have predicted that the amplitude of the radiation-induced oscillations should increase linearly with . The results presented here suggest a nonlinear power law increase in a regime characterized by modest excitation.
IV Conclusion
In summary, consistent experimental results have been obtained for the U- and W- material so far as the essential features of the radiation-induced magnetoresistance oscillations are concerned, and this includes the ”1/4-cycle” phase shift.8 In addition, nonlinear growth is observed in the amplitude of radiation-induced magneto-resistance oscillations with in both materials. Although fits have been utilized here to quantify the non-linear intensity dependence, such fits are not necessary to perceive the basic non-linear intensity dependence in the raw data.
V Acknowledgements
R.G.M. is supported by the Army Research Office under W911NF-07-01-0158 and the DOE under DE-SC0001762.
References
- (1) M. Tinkham, Introduction to Superconductivity, 2nd. ed. (McGraw-Hill, New York, 1996).
- (2) R. E. Prange and S. M. Girvin, The Quantum Hall Effect, 2nd. ed. (Springer, New York, 1990).
- (3) S. Das Sarma and A. Pinczuk, Perspectives in Quantum Hall Effects (Wiley, New York, 1996).
- (4) R. G. Mani, J. H. Smet, K. von Klitzing, V. Narayanamurti, W. B. Johnson, and V. Umansky, Nature(London) 420, 646 (2002).
- (5) M. A. Zudov, R. R. Du, L. N. Pfeiffer, and K. W. West, Phys. Rev. Lett. 90, 046807 (2003).
- (6) S. I. Dorozhkin, JETP Lett. 77, 577 (2003).
- (7) R. G. Mani, V. Narayanamurti, K. von Klitzing, J. H. Smet, W. B. Johnson, and V. Umansky, Phys. Rev. B69, 161306 (2004); Phys. Rev. B70, 153310 (2004).
- (8) R. G. Mani et al., Phys. Rev. Lett. 92, 146801 (2004).
- (9) R. G. Mani et al., Phys. Rev. B69, 193304 (2004).
- (10) S. A. Studenikin et al., Sol. St. Comm. 129, 341 (2004).
- (11) R. R. Du et al., Physica E (Amsterdam) 22, 7, (2004).
- (12) R. L. Willett, L. N. Pfeiffer, and K. W. West, Phys. Rev. Lett. 93, 026604 (2004).
- (13) R. G. Mani, Physica E (Amsterdam) 22, 1 (2004); ibid. 25, 189 (2004).
- (14) R. G. Mani, Appl. Phys. Lett. 85, 4962 (2004); IEEE Trans. on Nanotech. 4, 27 (2005); Phys. Rev. B 72, 075327 (2005); Appl. Phys. Lett. 91, 132103 (2007); Sol. St. Comm. 144, 409 (2007); Appl. Phys. Lett. 92, 102107 (2008); Physica E, 40, 1178 (2008).
- (15) B. Simovic et al., Phys. Rev. B71, 233303 (2005).
- (16) J. H. Smet et al., Phys. Rev. Lett. 95, 118604 (2005).
- (17) Z. Q. Yuan et al., Phys. Rev. B74, 075313 (2006).
- (18) S. A. Studenikin et al., Phys. Rev. B76, 165321 (2007).
- (19) K. Stone et al., Phys. Rev. B76, 153306 (2007).
- (20) A. Wirthmann et al., Phys. Rev. B76, 195315 (2007).
- (21) S. Wiedman et al., Phys. Rev. B 78, 121301(R) (2008).
- (22) A. T. Hatke, M. A. Zudov, L. N. Pfeiffer, and K. W. West, Phys. Rev. Lett. 102, 086808 (2009).
- (23) R. G. Mani et al., Phys. Rev. B79, 205320 (2009).
- (24) A. C. Durst, S. Sachdev, N. Read, and S. M. Girvin, Phys. Rev. Lett. 91, 086803 (2003).
- (25) A. V. Andreev, I. L. Aleiner, and A. J. Millis, Phys. Rev. Lett. 91, 056803 (2003).
- (26) V. Ryzhii and A. Satou, J. Phys. Soc. Jpn. 72, 2718 (2003).
- (27) X. L. Lei and S. Y. Liu, Phys. Rev. Lett. 91, 226805 (2003).
- (28) P. H. Rivera and P. A. Schulz, Phys. Rev. B70, 075314 (2004); P. H. Rivera, A. L. C. Pereira, and P. A. Schulz, Phys. Rev. B 79, 205406 (2009)
- (29) S. A. Mikhailov, Phys. Rev. B70, 165311 (2004).
- (30) I. A. Dmitriev et al., Phys. Rev. B71, 115316 (2005).
- (31) J. Inarrea and G. Platero, Phys. Rev. Lett. 94, 016806 (2005).
- (32) A. Auerbach, I. Finkler, B. I. Halperin, and A. Yacoby, Phys. Rev. Lett. 94, 196801 (2005).
- (33) X. L. Lei and S. Y. Liu, Phys. Rev. B72, 075345 (2005).
- (34) A. D. Chepelianskii, A. S. Pikovsky and D. L. Shepelyansky, Eur. Phys. J. B60, 225 (2007).
- (35) A. Auerbach and G. V. Pai, Phys. Rev. B76, 205318 (2007).
- (36) I. A. Dmitriev, A. D. Mirlin, and D. G. Polyakov, Phys. Rev. B75, 245320 (2007).
- (37) J. Inarrea and G. Platero, Phys. Rev. B78, 193310 (2008).
- (38) M. Khodas and M. Vavilov, Phys. Rev. B78, 245319 (2009).
- (39) I. Finkler and B. I. Halperin, Phys. Rev. B79, 085315 (2009).
- (40) A. D. Chepelianskii and D. L. Shepelyansky, Phys. Rev. B 80, 241308 (2009).
- (41) D. Konstantinov and K. Kono, arxiv:0910.3040