Ice chemistry in massive Young Stellar Objects: the role of metallicity
Abstract
We present the comparison of the three most important ice constituents (water, CO and CO2) in the envelopes of massive Young Stellar Objects (YSOs), in environments of different metallicities: the Galaxy, the Large Magellanic Cloud (LMC) and, for the first time, the Small Magellanic Cloud (SMC). We present observations of water, CO and CO2 ice in 4 SMC and 3 LMC YSOs (obtained with Spitzer-IRS and VLT/ISAAC). While water and CO2 ice are detected in all Magellanic YSOs, CO ice is not detected in the SMC objects. Both CO and CO2 ice abundances are enhanced in the LMC when compared to high-luminosity Galactic YSOs. Based on the fact that both species appear to be enhanced in a consistent way, this effect is unlikely to be the result of enhanced CO2 production in hotter YSO envelopes as previously thought. Instead we propose that this results from a reduced water column density in the envelopes of LMC YSOs, a direct consequence of both the stronger UV radiation field and the reduced dust-to-gas ratio at lower metallicity. In the SMC the environmental conditions are harsher, and we observe a reduction in CO2 column density. Furthermore, the low gas-phase CO density and higher dust temperature in YSO envelopes in the SMC seem to inhibit CO freeze-out. The scenario we propose can be tested with further observations.
keywords:
astrochemistry – circumstellar matter – galaxies: individual (LMC, SMC) – Magellanic Clouds – stars: formation – stars: protostars.1 Introduction
The most abundant astronomical ices are water, CO and CO2. These ices involve abundant metals that, as gas-phase atoms and molecules, are prime coolants of the molecular clouds (e.g. Omukai et al., 2010). Efficient cooling during the early collapse stages is paramount to allowing star formation to proceed. By changing the chemical balance in the molecular cloud, interstellar ice chemistry is thus an important ingredient in the formation of stars from contracting cores.
In spite of its ubiquity and significance as a cornerstone of interstellar chemistry, the formation of water is poorly understood. In comparison to gas-phase water abundance, the observed water ice abundance is too high to have formed by direct accretion from the gas-phase only (Roberts & Herbst, 2002). Therefore surface reactions on cold dust grains likely play a significant role in the formation of water molecules (Tielens & Hagen, 1982).
Water ice seems to form very easily in molecular clouds, as it requires relatively low gas densities and only moderately low temperatures (e.g. Hollenbach et al., 2009). CO, the most abundant gas-phase molecule besides molecular hydrogen, forms exclusively in the gas phase. It is thought that a layer of water ice (with impurities of CO and other molecules) forms on cold dust grains. During pre-stellar collapse the increased density causes virtually all gas species to accrete onto the icy grains, creating a layer dominated mainly by CO (e.g. Aikawa et al., 2001). Thus the CO ice profiles towards quiescent regions are dominated by pure CO or CO-rich (apolar) matrices, with an increasing contribution of CO in water-rich (or polar) matrices towards YSO environments (e.g. Gibb et al., 2004). CO2 forms exclusively via surface reactions (Millar et al., 1991) and the observed profiles suggest that these reactions occur both in the CO- and water-dominated layers, the latter being the dominant component (%, Gerakines et al., 1999) towards all environments.
In this letter we investigate the effect of metallicity on the abundance of the three most important contributors to interstellar ices: water, CO and CO2. Our research is based on observations in the Magellanic Clouds (MCs) which have subsolar metallicity ( and , e.g. Russell & Bessell, 1989). We present the first observations of CO and CO2 ice towards Young Stellar Objects (YSOs) in the SMC. We compare the ice abundances towards luminous YSOs in the Galaxy, LMC and SMC, and relate these to the observed properties of the Interstellar Medium (ISM), e.g. gas-phase abundances, dust temperature and radiation field strength. We propose a simple schematic scenario that can explain the observed relative ice column densities and the non-detection of CO ice in the SMC environments.
2 Spectroscopic observations

The sample of 7 Magellanic YSOs (Table 1) includes 3 LMC objects described by Oliveira et al. (2009) and Shimonishi et al. (2010) and 4 SMC sources. IRAS 010427215 in the SMC was identified as a YSO by van Loon et al. (2008). The three other SMC sources are spectroscopically identified as YSOs for the first time in this work, and are amongst the brightest of a sample of YSO candidates in the SMC (Oliveira et al. in preparation), identified at 70 m in the S3MC survey (Bolatto et al., 2007). The spectral energy distributions of these YSOs suggest that they are young and embedded, and of similar total luminosity (a few L⊙). In terms of luminosity, the MC sample is comparable to the Galactic sample of massive YSOs observed with ISO (Gibb et al., 2004, and references therein).
M-band spectra were obtained with the Infrared Spectrometer And Array Camera (ISAAC) at the European Southern Observatory (ESO)’s Very Large Telescope (VLT) on the nights of 4 and 5 November 2009 (ESO Programme 084.C-0955, P.I. J.M. Oliveira), to search for the CO ice feature at m. The low-resolution mode of ISAAC was used with a -wide slit, resulting in a spectral resolution of m around the CO feature, sampled by 0.0014 m pixels. Exposure times varied between 45 and 90 min. The standard IR technique of chopping and nodding was employed to cancel the high background. Spectra of standard stars were obtained and were used to cancel telluric absorption in the YSO spectra; telluric lines were used to calibrate the wavelength scale to an accuracy m.
The L-band spectra of three of the SMC sources were obtained with ISAAC at the ESO/VLT on the nights of 28 and 29 October 2006 (ESO Programme 078.C-0338, P.I. J.M. Oliveira), the spectrum of IRAS 010427215 was published by van Loon et al. (2008). The L-band spectra were obtained and reduced in the same way as the M-band spectra. The resolving power is . Exposure times varied between 60 105 min. The hydrogen lines in the standard stars left remnants of at most a few per cent of the continuum level. Telluric lines were used to calibrate the wavelength scale to an accuracy m. The 34 m spectra of the LMC sources were obtained with the AKARI satellite (published by Shimonishi et al., 2010).
All sources were observed with the InfraRed Spectrograph (IRS) on board the Spitzer Space Telescope, either as part of the SAGE-Spec Spitzer Legacy Program of the LMC (Kemper et al., 2010) and already described in Oliveira et al. (2009), or as part of GTO programme #50240 on the SMC (P.I. G.C. Sloan) and shown here for the first time. Details on the data reduction of the IRS spectra are found in Sloan et al. (2008).
Continuum subtraction was performed by fitting a - to -degree polynomial over a narrow wavelength range surrounding the ice features. Fig. 1 shows the optical depth spectra. We detect water, CO and CO2 ices towards all 3 LMC sources; Shimonishi et al. (2010) did not detect CO ice towards IRAS 052406809. We detect water and CO2 towards the SMC sources (only at a 3- level for IRAS 010427215); the most striking observation is the absence of CO ice in any of the SMC spectra (Fig. 1 middle).
3 Results: ice column densities
| Galaxy | Target ID | RA & Dec (J2000) | N(H2O) | N(CO) | N(CO2) |
|---|---|---|---|---|---|
| LMC | SSTISAGE1C J051449.41671221.5 | 05:14:49.41 67:12:21.5 | 19.3 1.0 | 1.60 0.11 | 6.10 0.45 |
| LMC | IRAS 052406809 | 05:23:51.14 68:07:12.4 | 27.5 1.5 | 2.62 0.22 | 12.92 0.26 |
| LMC | SSTISAGE1C J052546.49661411.3 | 05:25:46.52 66:14:11.3 | 33.6 1.4 | 1.54 0.16 | 8.93 0.18 |
| SMC | IRAS 004307326 | 00:44:56.30 73:10:11.8 | 17.7 0.7 | 0.26 | 2.08 0.09 |
| SMC | S3MC 005407321 | 00:54:02.31 73:21:18.6 | 21.6 0.8 | 0.19 | 3.50 0.19 |
| SMC | S3MC 005417319 | 00:54:03.36 73:19:38.4 | 22.3 1.2 | 0.16 | 5.40 0.16 |
| SMC | IRAS 010427215 | 01:05:49.29 71:59:48.8 | 16.6 0.7 | 0.45 | 0.49 0.18 |
We measured column densities for the three ice species by integrating the optical depth spectra over fixed wavelength ranges (2.93.6, 4.664.69 and 14.816.2 m). Fig. 1 shows that we miss the extreme red wing of the H2O ice profile, which accounts for 10% of the total column density. The integration interval for the CO ice excludes the Pf hydrogen recombination line at m and the S(9) line from molecular hydrogen at m. Adopted band strengths are , and cm per molecule, respectively for H2O, CO and CO2 (Gerakines et al., 1995). For the LMC objects, we compare our measurements to those by Shimonishi et al. (2010). Our water and CO2 column densities are generally smaller (by 1020%), due to different continuum and integration interval choices. For CO ice, our column densities are lower by as much as 50%. This is likely due to the lower resolution of the AKARI spectra (R 80, compared to R 390 for our spectra) that makes continuum determination uncertain. Such effects are not accounted for in the statistical errors.
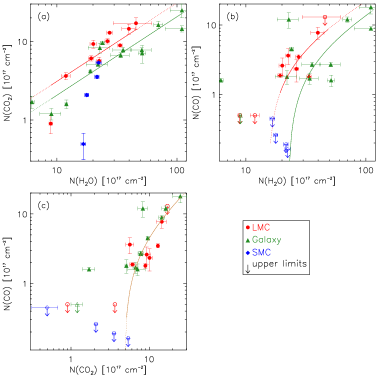
Fig. 2 shows the ice column densities for the MC samples (from this work and Shimonishi et al. 2010) and the massive YSO Galactic samples (Gerakines et al., 1999; Gibb et al., 2004) for the 3 ice species analysed here — we only consider objects with measurements or upper limits for all 3 species. The N(CO2)/N(H2O) ratios for the LMC and the Galaxy are consistent with previous determinations (Gerakines et al., 1999; Oliveira et al., 2009; Shimonishi et al., 2010), respectively 0.32 and 0.2 (Fig. 2 (a)). Thus CO2 ice seems to be more abundant (with respect to water ice) in the LMC than in the Galaxy. For the SMC sources, this ratio is lower than those of the other samples: in comparison to both LMC and Galactic objects with similar water column density (16.6 22.3 molecules cm-2), the SMC sources exhibit smaller CO2 ice column density. The sample size and water column density range sampled are however small. Nevertheless, this suggests that while CO2 ice abundance is enhanced in the LMC, it is depleted in the SMC.
CO ice is detected for most of the LMC sources. In Fig. 2 (c) CO and CO2 column densities are plotted against each other. The LMC and Galactic sources are indistinguishable in this diagram, and there is a strong correlation (Pearson coefficient 0.94). With the exception of a single source, no CO ice is detected for sources with CO2 column density molecule cm-2. This is expected since CO is the most volatile of the ice species considered here. The slope of the linear relationship is 0.84, and a CO2 column density threshold for the detection of CO of 4.7 molecule cm-2 is inferred (similar to those derived by Gerakines et al., 1999). Since for a given CO2 ice abundance, Galactic and LMC objects show similar CO ice abundances, this means that both species are affected in a similar way by whatever causes the CO2 enhancement with respect to water ice.
CO and water column densities are clearly correlated for the LMC and Galactic samples (Fig. 2 (b), Pearson correlation coefficient of 0.8), but there is considerable scatter. Even though less clear than in the case of CO2, LMC sources tend to exhibit larger CO column densities than Galactic sources for the same water column density. Due to the larger scatter, we do not fit these data; instead we derive the linear relations that are consistent with those observed between CO and CO2, and CO2 and water. This results in slopes of 0.27 and 0.17 respectively for the LMC and the Galaxy, and water column density thresholds for the presence of CO of 14.5 and 23 molecule cm-2.
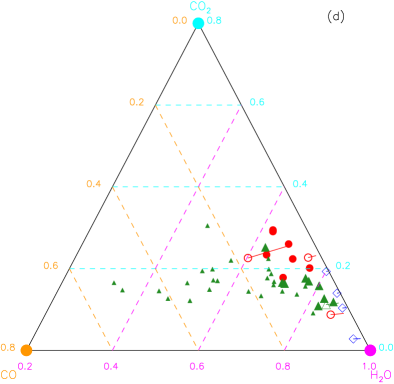
Since water, CO and CO2 are the most abundant ice species (e.g. van Dishoeck, 2004), the relationship between the 3 ice column densities can be visualised using a ternary plot (Cook et al., 2010). This is shown in Fig. 2 (d), where column densities are shown as a percentage of the total ice column density. Each vertex of the triangle represents mixtures of pure water ice (magenta), 80% CO ice (orange) and 80% CO2 (cyan), with the abundance of a particular species decreasing with increasing distance to the vertex. For each YSO, the relative ice abundance of each species can be read by following the dashed lines and reading the scale with the corresponding colour (see above).
The LMC and Galactic YSOs exhibit different ice properties as they clearly separate in the ternary diagram. As suggested above, CO and CO2 vary in a concerted way. Therefore the only way for the LMC sample to be made to occupy the same region in this diagram as the Galactic sample is for either the CO and CO2 abundances to be reduced, or the water column density to be increased (roughly by a factor 1.62). In other words in the LMC either CO and CO2 ices are overabundant or water ice is depleted. In Fig. 2 (d) we also show the ice abundances of low-luminosity Galactic YSOs (small green circles, Pontoppidan et al., 2003, 2008). Low- and high-luminosity (massive) YSOs separate well in this diagram: massive YSOs are located further away from the CO vertex, an effect of CO desorption (Cook et al., 2010) related to the higher temperatures reached in their envelopes. Furthermore, the Galactic low-luminosity and LMC objects do not occupy the same region in the ternary diagram. This cautions against the similarities in CO2 ice properties found in these samples by Oliveira et al. (2009), and reinforces the importance of jointly analysing the 3 major ice species. To avoid the added complication of evolutionary effects in the YSO envelopes, our analysis is based on the comparison of the MC sample to massive Galactic YSOs, that are in the same evolutionary stages (Oliveira et al., 2009; Shimonishi et al., 2010).
None of the SMC sources show CO ice in their spectrum (upper limits are provided in Table 1 and are shown in Fig. 2). This seems to suggest that CO ice does not form or is swiftly desorbed around SMC YSOs. However, only for one SMC YSO is the CO2 column density above the CO2 threshold ( 4.7 molecule cm-2) for the detection of CO ice (Table 1). We believe CO ice is depleted in the SMC (the upper limits are stringiest in the sources with largest water and CO2 column densities) but our data are not yet conclusive. In the ternary diagram the SMC sources obviously appear at the limit of low CO column densities.
4 Discussion
Of the three ice species investigated here, CO is the most volatile: desorption temperatures are 2030, 5090, and 100120 K, respectively for CO, CO2, and H2O, depending on the ice mixtures in which the species reside (Fraser et al., 2001; van Broekhuizen et al., 2006). The largest contribution to CO2 ice column density arises from chemical reactions within the water-rich ice layer, both in Galactic and LMC objects (Gerakines et al., 1999; Oliveira et al., 2009). On the other hand, the largest contribution to CO column density comes from the CO-rich layer that freezes out on top of the water-rich layer, at higher densities deeper within the cloud (Gibb et al., 2004, at least for Galactic YSOs). Thus, CO survives only in the more shielded regions (Hollenbach et al., 2009). Consequently, environmental changes in the molecular clouds can change the balance of species in the icy layers.
The ternary diagram (Fig. 2 (d)) clearly shows that ice abundances towards YSOs in the LMC are distinct from those towards Galactic YSOs. To explain the larger N(CO2)/N(H2O) ratio observed in the LMC, both Oliveira et al. (2009) and Shimonishi et al. (2010, see also ) suggest that CO2 production is enhanced in the LMC. These authors propose this is due to the stronger UV field (Welty et al., 2006) and higher dust temperatures (Bernard et al., 2008) observed in the LMC, that have been shown in laboratory experiments to increase CO2 production (D’Hendecourt et al., 1986; Ruffle & Herbst, 2001). While CO2 forms in the icy grain mantles, CO forms in the gas-phase and freezes out onto cold dust grains. If the temperature of the grain surfaces is on average higher as proposed above, CO ice abundance would be decreased. Thus it is difficult to see how solid CO abundance can be enhanced in the harsher ambient conditions in the LMC.
If both CO2 and CO ice abundances appear enhanced towards LMC objects but in such a way that relative CO-to-CO2 abundances are unchanged (see Fig. 2 (c)), another possibility is that the water ice column density is reduced towards YSOs in the LMC. Indeed, the largest water column density shown in Fig. 2 are 50 and 100 molecule cm-2, respectively in the LMC and the Galaxy (lower in the SMC), even though this could be a selection effect. We explore a scenario (Fig. 3) to explain the reduction of the water ice column density at lower metallicity.
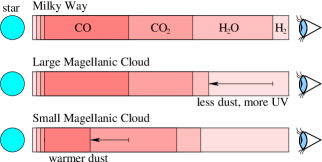
Water ice forms easily in molecular clouds. However, accumulation of water ice only occurs once there is enough shielding and the rate of ice formation overcomes the rate of photo-desorption (assuming the dust grains are cold enough and thermal desorption is negligible). The AV-threshold for water ice freeze-out (A is affected by the strength of the incident radiation field (Hollenbach et al., 2009), varying between 3 mag (for typical Galactic molecular clouds) to 6 mag. The reduced metallicity of the MCs compared to the Galaxy results in a lower dust:gas ratio (e.g. LMC, Bernard et al. 2008; SMC, Leroy et al. 2007); this combined with the harsher UV interstellar radiation field (e.g. Welty et al., 2006) probably leads to enhanced photo-desorption of water and reduced freeze-out in the outer H2 envelopes of molecular clouds in the MCs. Hence the “snowline” for water moves inwards in the YSO envelope, reducing the column density of water ice as observed in the MCs (Fig. 3). A reduced availability of water-rich ice is also in agreement with the lower fraction of CO2 locked in the polar component as found by Oliveira et al. (2009).
Within the shielded denser regions of the YSO envelopes, CO2 and CO are abundant in the LMC, and we see no significant difference between Galactic and LMC YSOs in terms of these ices. CO ice is even more sensitive to shielding than water ice (the AV-threshold for the detection of CO ice in Galactic sources is mag, Bergin et al. 2005; Whittet et al. 2007). However, gas-phase CO also requires high density to accrete onto the icy grains. For the same amount of dust (i.e. equivalent shielding) the corresponding gas density is higher in the LMC (c.f. van Loon et al., 2010b) due to the lower dust:gas ratio. These two effects could balance in such a way that CO freeze-out still occurs.
In the Galaxy, the AV-threshold for the detection of CO2 ice is mag (Bergin et al., 2005; Whittet et al., 2007), consistent with that of water ice within the large uncertainties. Our scenario relies on an extinction threshold difference between the two species, that is not currently detected in the Galaxy. However, it is possible that such a difference is more pronounced in the low metallicity/high UV environments prevalent in the MCs. Even if CO2 ice is also affected by the reduced shielding in the outer cold regions, the higher density argument put forward in the previous paragraph would also favour an enhancement in CO-based CO2 formation in the LMC, as it is indeed observed (Oliveira et al., 2009).
In the SMC the CO2 ice abundance seems depressed and no CO ice is detected (see caveats discussed in the previous section). This could be a direct effect of the lower CO gas-phase abundance (e.g. Leroy et al., 2007), and thus a clear metallicity effect. Furthermore, van Loon et al. (2010b) found that typical dust temperatures within YSO envelopes in the SMC are higher than in the LMC. Both these effects seem to prevent significant freeze-out of gas-phase CO in the SMC. Hence YSOs in the SMC show reduced CO2 and CO ice column densities when compared to water ice.
5 Summary
We find that the observed column densities of CO2, CO and water ice towards LMC YSOs are more consistent with the depletion of water ice, not an increased CO2 production as previously proposed. This depletion can result from the combined effects of a lower gas-to-dust ratio and stronger UV radiation field, that forces the onset of water ice freeze-out deeper into the YSO envelope, reducing the observed column density. This trend may continue on to the SMC.
We present the first CO and CO2 ice spectra of massive YSOs in the SMC. CO2 ice seems to be depleted and no CO ice is detected, possibly due to the lower gas-phase CO abundance, and higher dust temperatures in the SMC YSOs.
Acknowledgments
We thank the staff at ESO-Paranal for their support during the observations. We thank T. Shimonishi for the AKARI spectra and A.D. Bolatto for comments. This work is based on observations made with the Spitzer Space Telescope, which is operated by the Jet Propulsion Laboratory, California Institute of Technology under contract with NASA.
References
- Aikawa et al. (2001) Aikawa Y., Ohashi N., Inutsuka S., Herbst E., Takakuwa S., 2001, ApJ, 552, 639
- Bergin et al. (2005) Bergin E.A., Melnick G.J., Gerakines P.A., Neufeld, D.A., Whittet, D.C.B., 2005, ApJ, 627, 33
- Bernard et al. (2008) Bernard J.-P. et al., 2008, AJ, 136, 919
- Bolatto et al. (2007) Bolatto A.D. et al., 2007, ApJ, 655, 212
- Boogert et al. (2000) Boogert A.C.A. et al., 2000, A&A, 353, 349
- Cook et al. (2010) Cook A.M., Whittet D.C.B., Horne D.J., Gerakines P.A., Shenoy S.S., 2010, in “Evolution and Life: Surviving Catastrophes and Extremes on Earth and Beyond”, LPI Contribution No. 1538, p.5420
- D’Hendecourt et al. (1986) D’Hendecourt L.B., Allamandola L.J., Grim R.J.A., Greenberg J.M., 1986, A&A, 158, 119
- Fraser et al. (2001) Fraser H.J., Collings M.P., McCoustra M.R.S., Williams D.A., 2001, MNRAS, 327, 1165
- Gerakines et al. (1995) Gerakines P.A., Schutte W.A., Greenberg J.M., van Dishoeck E.F., 1995, A&A, 296, 8
- Gerakines et al. (1999) Gerakines P.A. et al., 1999, ApJ, 522, 357
- Gibb et al. (2004) Gibb E.L. Whittet D.C.B., Boogert A.C.A., Tielens A.G.G.M., 2004, ApJS, 151, 35
- Hollenbach et al. (2009) Hollenbach D., Kaufman M.J., Bergin E.A., Melnick G.J., 2009, ApJ, 690, 1497
- Kemper et al. (2010) Kemper F. et al., 2010, PASP, 122, 683
- Leroy et al. (2007) Leroy A., Bolatto A.D., Stanimirović S., Mizuno N., Israel F., Bot C., 2007, ApJ, 658, 1027
- Millar et al. (1991) Millar T.J., Bennett A., Rawlings J.M.C., Brown P.D., Charnley S.B., 1991, A&AS, 87, 585
- Oliveira et al. (2009) Oliveira J.M. et al., 2009, ApJ, 707, 1269
- Omukai et al. (2010) Omukai K., Hosokawa T., Yoshida N., 2010, ApJ, 722, 1793
- Pontoppidan et al. (2003) Pontoppidan K.M. et al., 2003, A&A, 408, 981
- Pontoppidan et al. (2008) Pontoppidan K.M. et al., 2008, ApJ, 678, 1005
- Roberts & Herbst (2002) Roberts H., Herbst E., 2002, A&A, 395, 233
- Ruffle & Herbst (2001) Ruffle D.P., Herbst E., 2001, MNRAS, 324, 1054
- Russell & Bessell (1989) Russell S.C., Bessell M.S., 1989, ApJS, 70, 865
- Shimonishi et al. (2008) Shimonishi T., Onaka T., Kato D., Sakon I., Ita Y., Kawamura A., Kaneda H., 2008, ApJ, 686, 99
- Shimonishi et al. (2010) Shimonishi T., Onaka T., Kato D., Sakon I., Ita Y., Kawamura A., Kaneda H., 2010, A&A, 514, 12
- Sloan et al. (2008) Sloan G.C., Kraemer K.E., Wood P.R., Zijlstra A.A., Bernard-Salas J., Devost D., Houck J.R., 2008, ApJ, 686, 1056
- Tielens & Hagen (1982) Tielens A.G.G.M., Hagen W., 1982, A&A, 114, 245
- van Broekhuizen et al. (2006) van Broekhuizen F.A., Groot I.M.N., Fraser H.J., van Dishoeck E.F., Schlemmer S., 2006, A&A, 451, 723
- van Dishoeck (2004) van Dishoeck E.F., 2004, ARA&A, 42, 119
- van Loon et al. (2008) van Loon J.Th., Cohen M., Oliveira J.M., Matsuura M., McDonald I., Sloan G.C., Wood P.R., Zijlstra A.A., 2008, A&A, 487, 1055
- van Loon et al. (2010a) van Loon J.Th. et al., 2010a, AJ, 139, 68
- van Loon et al. (2010b) van Loon J.Th., Oliveira J.M., Gordon K.D., Sloan G.C., Engelbracht C.W., 2010b, AJ, 139, 1553
- Welty et al. (2006) Welty D.E., Federman S.R., Gredel R., Thorburn J.A., Lambert D.L., 2006, ApJS, 165, 138
- Whittet et al. (2007) Whittet D.C.B., Shenoy S.S., Bergin E.A., Chiar J.E., Gerakines P.A., Gibb E.L., Melnick G.J., Neufeld D.A., 2007, ApJ, 655, 332