Do micro brown dwarf detections explain the galactic dark matter?
Abstract
Context. The baryonic dark matter dominating the structures of galaxies is widely considered as mysterious, but hints for it have been in fact detected in several astronomical observations at optical, infrared, and radio wavelengths. We call attention to the nature of galaxy merging, the observed rapid microlensing of a quasar, the detection of “cometary knots” in planetary nebulae, and the Lyman-alpha clouds as optical phenomena revealing the compact objects. Radio observations of “extreme scattering events” and “parabolic arcs” and microwave observations of “cold dust cirrus” clouds are observed at 15 – 20 K temperatures are till now not considered in a unifying picture.
Aims. The theory of gravitational hydrodynamics predicts galactic dark matter arises from Jeans clusters that are made up of almost a trillion micro brown dwarfs (BDs) of earth weight. It is intended to explain the aforementioned anomalous observations and to make predictions within this framework.
Methods. We employ analytical isothermal modeling to estimate various effects.
Results. Estimates of their total number show that they comprise enough mass to constitute the missing baryonic matter. Mysterious radio events are explained by BD pair merging in the Galaxy. The “dust” temperature of cold galaxy halos arises from a thermostat setting due to a slow release of latent heat at the 14 K gas to solid transition at the BD surface. The proportionality of the central black hole mass of a galaxy and its number of globular clusters is explained. The visibility of an early galaxy at redshift 8.6 is obvious with most hydrogen locked up in BDs.
Conclusions. Numerical simulations of various steps would further test the approach. It looks promising to redo MACHO searches against the Magellanic clouds.
Key Words.:
Galactic dark matter, MACHOs, galaxy merging, microlensing, cool dust temperature, cirrus clouds, Lyman-alpha forest, black hole1 Introduction
In 1931 Jan Oort realized that our Galaxy must contain invisible matter (Oort (1932)). Fritz Zwicky soon concluded the same for clusters of galaxies, and called it dark matter (DM) (Zwicky (1933)). The current paradigm of Cold Dark Matter (CDM, or CDM including the cosmological constant) assumes it to arise from a heavy elementary particle with a small interaction cross-section. In the transition of the plasma of protons, electrons and He-ions to gas, the photons decouple and the baryons are said to condense on presumed pre-existing CDM condensations. However, despite many searches, this CDM particle has not been found (Aprile et al. (2010); Akerib et al. (2010)) and this bottom-up scenario is stressed by numerous observations at its upper and lower size scales. On the largest scales, cosmic void structures are found on much larger size scales than predicted from simulations, whereas on the smallest scales, the many subhalos predicted to surround our Galaxy are not observed (Diemand et al. (2008)). Moreover, the voids are emptier than simulated. And, the predicted “dark age” before the formation of stars and galaxies is coming more and more under stress with new observations of early structures arising basically every month (Oesch et al. (2010); Bouwens et al. (2010)). Despite careful re-analysis the 7Li abundance remains a factor 4–5 below the WMAP CDM prediction (Cyburt et al. (2008)). Neither does CDM offer an explanation for the axis of evil (Schild & Gibson (2008)), the dark flow (Kaslinsky et al (2008)), chain galaxies (Elmegreen et al. (2005)) or the bullet cluster (Lee & Komatsu (2010)), while correlations between galaxy parameters contradict the CDM hierarchical clustering (Disney et al. (2008)). The structure of the Local Group (Kroupa et al. (2010)) and globular star clusters in the Galaxy (Conroy et al. (2010)) are incompatible with CDM.
We shall follow an approach with two types of dark matter, “Oort” DM in galaxies, composed of baryons, and “Zwicky” DM in galaxy clusters, the true DM. Gravitational hydrodynamics (GHD) theory of structure formation assumes no new particle but only stresses the nonlinearity of hydrodynamics. It involves a top-down scenario starting with structure formation in the plasma at redshift , well before the decoupling of matter and radiation at z = 1100 (Gibson (1996); Nieuwenhuizen, Gibson & Schild (2009)). The viscosity in the quark-gluon plasma is very small, so it leads to strong turbulence. This gets dissolved, but as is known from turbulence in air fares, pockets of turbulence survive and trigger nonlinearities at the moment the viscous length enters the horizon at redshift . This viscous instability mechanism creates voids, which have expanded to ca 38 Mpc now, a fair estimate for the observed typical cosmic voids (Geller & Huchra (1989)). Just after the decoupling, the Jeans 1902 mechanism says that all gas fragments in Jeans clumps of ca 6 solar masses. These clumps also fragment, again due to viscosity but now of the gas, in some micro brown dwarfs (BDs, muBDs) of earth mass, sometimes called MACHOs (Massive Astrophysical Compact Halo Objects). This process turns the Jeans clumps into Jeans clusters (JCs) of BDs. The first stars occur by coagulation of BDs, on gravitational free-fall time scales without a dark period. A fraction of Jeans clusters turned into old globular star clusters. Others got disrupted and became material for normal stars. But most of them still exist, though cold, and constitute the galactic dark matter. These dark JCs have an isothermal distribution, noticed in lensing galaxies (Hubble (1930); Rison & Kochanek (2005)), which induces the flattening of rotation curves, while their baryonic nature allows to explain the Tully-Fisher and Faber-Jackson relations (Nieuwenhuizen, Gibson & Schild (2009)).
Nuclear synthesis attributes enough matter for the BDs. About 4.5% of the critical density of the Universe is baryonic. At best 0.5 % is luminous, and some 2–3% is observed in X-ray gas. So, the missing dark baryons may indeed be locked up in BDs.
Questions about the nature of the baryonic dark matter (BDM) have largely been overshadowed in the past decade by even deeper questions about the non-baryonic dark matter. GHD just assumes that it is free streaming at the decoupling (Nieuwenhuizen, Gibson & Schild (2009)). One of us in his modeling of the lensing properties of a galaxy cluster (Nieuwenhuizen (2009)) confirmed that it should be related to cluster DM. Dark matter is described by an ideal gas of isothermal fermions, and galaxies and X-ray gas by standard isothermal models. This yields a DM mass of 1-2 eV, not the heavy mass of the hypothetical CDM particle. The best candidate is the neutrino with mass of 1.5 eV; a prediction that will be tested in the 2015 KATRIN tritium decay search (Weinheimer (2009)). If also the right-handed (sterile) neutrinos were created in the early Universe, there should exist a 20% population of 1.5 eV neutrino hot dark matter, clumped at the scale of galaxy clusters and groups (Nieuwenhuizen (2009)).
Returning to the problem of the more familiar galactic DM just consisting of baryons, it has probably been detected already in various observations but has not been considered in a single framework. The nature of the BDM seems obscure because nature places severe constraints, so it has thus far eluded detection. The BDM must be dominated by hydrogen in some form. Hydrogen can exist in its atomic form, as H2 gas, or in ionized form, H+. In gaseous form as H-clouds its strong signatures as radio (21 cm) and optical Lyman and Balmer alpha emission lines should have been observed in some kind of galaxy or other by now, creating a serious puzzle, that we solve here.
A second important impediment faced by the idea that the BDM is sequestered away in condensed objects is the formation question. It has long been concluded that hydrogen clouds cannot collapse to form planetary or solar mass objects because the hydrogen cannot cool quickly, and pressure forces will quickly restore the cloud. However these arguments all involve a simplifying assumption that the process can be linearized, whereas GHD starts from H condensed in BDs. We now discuss that various types of observations support the GHD picture as the CDM theory flounders.
2 Jeans clusters visible in galaxy merging
The GHD formation theory predicts some BDs of earth mass per galaxy grouped in some 1.7 million Jeans clusters, each with mass , that constitute the galactic DM halos (Gibson (1996)). BD merging has led to heavier objects like planets and stars.
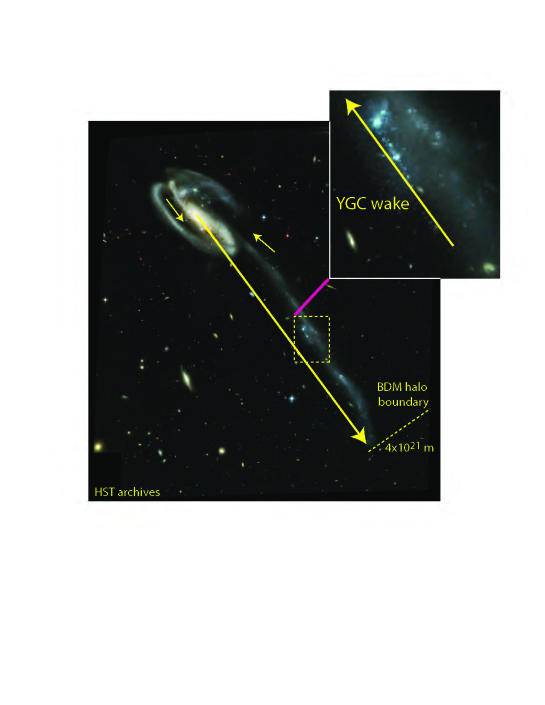
As exposed in Fig. 1 of the Tadpole galaxies, galaxy merging turns the dark halo JCs into young (3-10 Myr) globular clusters (YGCs) along the merging path (Gibson & Schild (2002); Nieuwenhuizen, Gibson & Schild (2009)). The age distribution has been determined, with typical value of 10 Myr, but many are younger (Fall et al. (2005)). Similar behaviors are observed in e. g. the Mice and Antennae galaxy mergers. The most luminous of the “knots” in Fig. 1 has an age of 4–5 Myr and estimated mass (Tran et al. (2003)), reminiscent of a JC. Observations generally reveal that the bright blue clusters are much younger (a few Myr) than the dynamical age of the tail (ca 150 Myr), providing strong evidence that star formation occurs in situ, long after the tail was formed (Tran et al. (2003)). GHD asserts that the cold BDs along the merging path get warmed by tidal forces, which makes them expand and coalesce at suitable moments into young stars grouped in YGCs. The CDM explanation as disrupted tidal tails (Bournaud, Duc & Emsellem (2008)) suffers from predicted but unobserved old stars.
Estimating the amount of galactic dark matter from fig. 1, the tail begins at 420,000 lyr from the center where it exhibits the sharp boundary of the dark matter halo. If there is spherical symmetry, the enclosed mass is , a reasonable estimate. The opening width of lyr across remains fairly constant along the trail, as expected for an induced local heating effect. From an isothermal model the number of JCs in the wake can then be estimated as 5900, which within a factor of a few coincides with the number of bright spots in Fig. 1. Indeed, some 11,000 were analyzed in Ref. (Fall et al. (2005)).
From these features one can already conclude that the galactic dark matter likely has the structure predicted by GHD.
3 Quasar microlensing brightness fluctuations
Quasar micolensing has probably to date given the most compelling evidence that the BDM is contained in a network of planetary mass bodies with sufficient number to account for the entire baryonic dark matter. The first detection of this was made with brightness monitoring of the Q0957+561 A, B gravitationally lensed quasar, with two images A, B separated by 6 arcsec on the plane of the sky. 15 years of brightness monitoring revealed that a microlensing signal of amplitude 1% and time scale 1 day (observer’s clock) was apparent in the data (Schild (1996)). Because the signal was consistently observed for long periods of monitoring on a time scale of the monitoring frequency, 1 day, it was concluded that the microlensing originated in a population of compact objects having masses averaging and with other events up to Jupiter mass also seen.
Subsequent to this discovery, re-analysis of the quasar data (Pelt et al. (1998)) confirmed that the rapid fluctuations were not intrinsic to the quasar and therefore presumably microlensing. Furthermore the signal had an equal positive and negative network of peaks, as demonstrated from wavelet analysis (Schild (1999)). This is understood to originate from a high optical depth and therefore is a signature that the BD population observed in the lens galaxy must be the baryonic dark matter. This conclusion follows from a deep understanding of microlensing (Schneider, Ehlers & Falco (1992)). In general, the shear associated with gravitational lensing (macro, milli, micro, nano) causes a brightening event with a cusp-shaped profile. But in the presence of a macro-shear generated by the Q0957 lens galaxy G1, a micro-shear caused by a BD in the lens galaxy would possibly further amplify the macro-shear or potentially de-magnify it on the micro-arcsec scale. Only in the special circumstance that the micro-shear originates in a population with unit optical depth to microlensing will the probability of micro-magnification and micro-demagnification be equal (p. 343 and Fig. 11.8 of Ref (Schneider, Ehlers & Falco (1992)) leaving a brightness profile with equal brightening and fading events on the time scale specific to the microlensing compact object, as simulated by (Schild & Vakulik (2003)). Thus, the observed signature found to have approximately equal positive and negative events (Schild (1999)) uniquely indicates microlensing by a population at unit optical depth. Since the optical depth of image A is known to be 0.35 and of image B is 1.35, as determined by a model of the overall lensing that produces the double image, and since the lens galaxy G1 must plausibly be dominated by its baryonic dark matter, it may be concluded that the baryonic dark matter is detected as a population of BD objects in the lens galaxy G1.
In an isothermal modeling, the average number of JCs along the quasar sightline A is 0.002 and for B 0.01. These numbers are close enough to unity to conclude that along each sight line there lies exactly one JC. The estimated number of BDs along the total light path then comes out as 18,000, confirming the observed multiple lensing events. The typical induced optical depth is 58, but the observed lower values occur if the light path traverses near the border of the JCs.
We are left with the extrapolation from theory and observation that the entire baryonic dark matter occurs in the form of a population of BDs seen in microlensing of quasars by the grainy distribution of matter in the lens galaxy. The same population has been confirmed in several other lens systems (Burud et al. (2000, 2002); Paraficz et al. (2006)), with microlensing mass estimates in the range to , that is, from individual BDs to merged ones.
4 Cometary knots in planetary nebulae
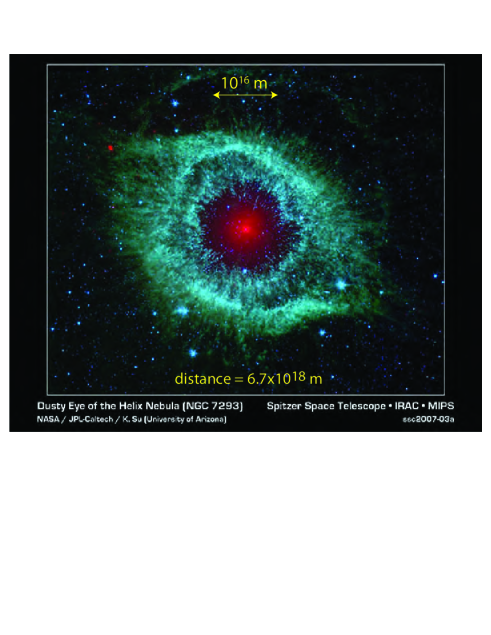
The BDs are directly seen in the Helix and other planetary nebulae, see Fig. 2. Their infrared emission allows 20,000–40,000 of them to be counted in Spitzer (Hora et al. (2006)). They are found distributed in a band or shell at a central distance comparable to the Solar Oort cloud, m. Because they are objects resolved at optical and infrared wavelengths, their sizes and structures may be estimated. Since they are radio CO emission sources, their masses may be estimated from their total CO emission and a normal CO/H emission ratio (Huggins et al. (2006)). They have a cometary shape which allows their masses to also be estimated from an ablation theory applied to their outer atmospheres (Meaburn et al. (1998)). Both methods yield mass estimates between and . The current literature often explains them as Rayleigh-Taylor instabilities in the outflowing nebular gas. However, RT instabilities would not cause strong density contrasts in the ambient gas. Density contrasts of only 4-6 would be expected from the Rankine-Hugoniot supersonic jump condition, whereas density contrasts of 1000 are observed from direct mass estimates (Meaburn et al. (1998)). Attempts to measure their proper motions by comparing HST images at different epochs have been carefully done to define whether they have expanding or static distributions (O’Dell et al. (1996); Burkert & O’Dell (1998)), but the results have been inconclusive. The gas outflow velocity of (Meaburn & Boumis (2010)) does not refer to the proper motion measured expansion of the system of knots.
5 On direct MACHO searches
With gas clouds apparently absent, the community turned, in the 1990s, to searches for condensed hydrogen-dominated objects and initiated microlensing searches for them. The MACHO (Alcock et al. (1997, 2000, 2001)), EROS (Aubourg et al. (1993); Eros1; Tisserand et al. (2007)) and OGLE (Udalski et al. (1993); Wyrzykowski et al. (2009); Sumi et al. (2010)) programs all found microlensing events in front of the Large and Small Magellanic Clouds (MCs) and the galactic center. Early claims that the few detections implied a population of white dwarfs were not substantiated because the population of progenitor stars could not be identified. Most observed objects are white dwarfs, Jupiters or Neptunes, probably inside the MCs and galactic center.
From GHD one expects all galactic DM of earth mass BDs. This case is just allowed by the MACHO collaboration (Alcock et al. (1997)), but ruled out by EROS-1 (Renault et al. (1998)). However, for observations against the Magellanic clouds, the estimate for the radius of the BD of cm coincides with its typical Einstein radius, leading to the microlensing unfriendly finite-source finite-lens situation (Agol (2002); Lee et al. (2010)). Obscuration by BDs and refraction by their atmospheres may have hindered the observation of Macho events.
For the BDs now predicted to be grouped in JCs, blind searching is not optimal. The JCs in front of the Magellanic clouds can be identied from WMAP, Herschel or Planck imaging data. See them also in the DIRBE-COBE image of fig 3. They should be a fertile ground for MACHO searches, but the observation cadence must be greatly increased because of the low mass of the BDs. For a terrestrial mass MACHO passing in front of a small star the total event duration is approximately 3.5 hrs. For BD microlenses clustered with properties measured for ordinary globular clusters, some 4,100 events should be visible per year by a dedicated spacecraft that continuously monitors the stars behind any of the 3400 JCs in front of the MCs. The number would increase if a clump of clusters as described below lies in front of the LMC. There should also be multiple events on the same star.
6 Halo temperatures and cirrus clouds
If most of the baryonic dark matter is sequestered away from view in BDs its thermal emission should still be seen as structured far-IR or sub-mm emission. The BDs would have been warmer than ambient gas at time of BD formation, and with their gravitationally heated cores they would be radiating heat away to the universe. Initially this would have cooled the objects significantly on time scales of 1 million years, since it has already been noticed that they are observable as T-dwarfs only in the youngest star forming regions (Marsh et al. (2010)). Thereafter they would have continued to cool in the expanding and cooling universe, but with large cooling blanketing atmospheres they should then have cooled slowly.
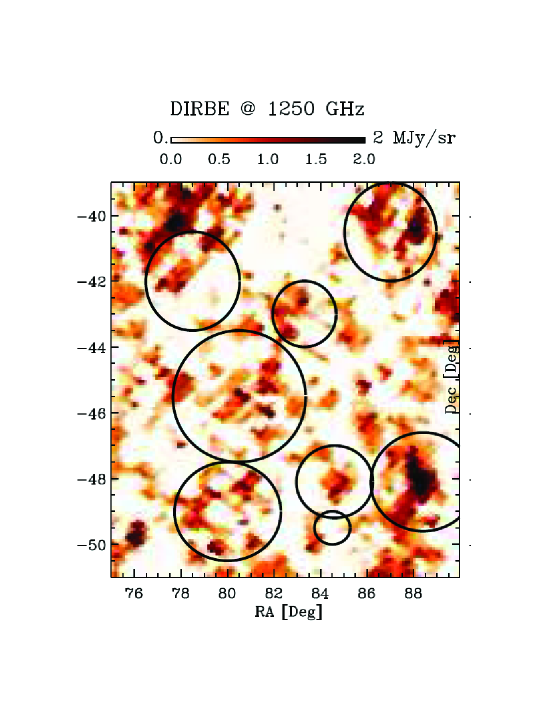
Because hydrogen has a triple point at 13.8 K, higher than the 2.725 K cosmic microwave background, phase transitions with significant heats of condensation and fusion have the potential to act as a thermostat to set the temperature of the baryonic dark matter, thus explaining the cool galactic dust temperatures of K (Radovich et al. (2001)) and 14–16K and 15–25K (Liu et al. (2010)) as galaxy haloes. Indeed, cooling atomic hydrogen at low density and pressure passes slowly through its triple point, so the BD population should have dominant thermal emission at or slightly above this temperature. The wavelength of peak emission would be 210 microns, or 0.21 mm. A detection of this thermal signature has also been made in a careful comparison of IRAF, DIRBE, BOOMERANG, and WMAP images for a Halo region of our Galaxy. These show (Veneziani et al. (2010)) that the observed structure radiates at approximately 16K and has its peak radiation in the 220 micron DIRBE band. In fig. 3 we show one panel of fig. 2 of (Veneziani et al. (2010)), which is now understood to be an image of the baryonic dark matter, seen in its emission peak wavelength. Although the far-IR emission of the Halo has been described as “cold dust cirrus” we find from direct imaging a clumped distribution, even with nested clumps, which suggests an interpretation of it as a clumpy distribution of JCs.
This view is supported by the amplitude of the signal. The standard Planck intensity at the DIRBE frequency of 1.25 THz caused by a thermal BD atmosphere at 15 K is 54 GJy. With an BD radius of m and the typical distance to the next JC equal to m, the Planck intensity is attenuated by the square of their ratio to become 0.9 kJy for the whole JC, about the highest observed value in (Veneziani et al. (2010)). Moreover, that nearest JC would have an angular diameter of , slightly less than the largest structure of Fig. 3. Next, the intensity per solid angle can be estimated as 12 MJy/sr, mildly overestimating the maximal scale of 2 MJy/sr of several objects in Fig. 3. We can also estimate the number of structures in Fig. 3. From an isothermal model we predict about 67 structures larger than 0.25∘ in diameter, which is a fair estimate.
With reasonable estimates for their intensity, angular width and number, it is likely that the concentrations in Fig. 3 arise from the JCs that constitute the full Galactic dark matter. Non-baryonic dark matter is relevant only on galaxy cluster scales.
A further aspect is the size of the BD atmospheres. For redshift the ambient temperature is above the triple point and atmospheres are large. After that, liquid drops form in the outer atmospheres which rain onto the center. This will lead to a sizable shrinking of the atmospheres, and enhanced transmissivity for radiation, an effect similar to the reionization of the inter cluster gas. The latter may be caused by neutrino condensation on the cluster (Nieuwenhuizen (2009)).
7 Radio events with permanent sources
Extreme Scattering Events were discovered as radio brightness anomalies in quasars. An event was characterized by 30% amplitude fluctuations with a cusp-profiled signature that is somewhat frequency dependent. This allowed them to be understood as a refraction event caused by a centrally condensed gaseous object passing in front of the quasar with a transverse velocity of a few hundred km s-1, the radio analogue of the above quasar brightness fluctuations. A physical model was quickly developed, which included refraction by an ionized outer atmosphere acting as a negative lens that produces the observed pattern of brightness cusps (Walker & Wardle (1998)). The objects were described as self-gravitating clouds with approximately spherical symmetry. In the refraction model, an electron column density of 1020m-2 is determined. The atmospheres of the objects have a size of 1 AU ( cm), and must be gravitationally bound or else confined by an ambient pressure. We notice a similarity to the properties of the BD discovered in quasar microlensing. The ESE clouds would be self-gravitating, have mass less than 10, have a size of 1014.5 cm, are a Halo population, and have typical galactic speeds. Not surprisingly, it is independently estimated that the observed objects may relate to a significant fraction of the galactic DM (Walker & Wardle (1998)).
Pulsar anomalies also suggest the existence of compact objects in the Halo of our Galaxy (Hill et al. (2005)), as already inferred from quasar anomalous brightening (Walker & Wardle (1998)). Estimated sizes are of order 0.2 AU ( m).
A probably related phenomenon is the crescent shaped events seen in the timing data in pulsars, since like the Extreme Scattering Events in quasar brightness curves, the pulsar anomalies are attributed to a refraction phenomenon due to condensed objects along the sight lines. It is inferred that the refraction effect produces multiple images of the pulsar radio signal, and interference of the images causes the observed phenomena. The scattering medium is estimated to have structure on 1 AU for a 103 interstellar density enhancement (Walker (2007)). This corresponds to a radio scattering atmosphere of kg, as expected well below the GHD prediction of an earth mass for the entire object.
8 Mysterious radio events as BD merging
Recently, a mysterious class of “long duration radio transients” has been observed, lasting more than 30 minutes but less than several days, that have neither a counterpart in the near-infrared, visible or X-ray spectrum nor a quiescent radio state. The event rate is very large, deg-2yr-1 and they can be bright (Jy). They were attributed to old galactic neutron stars (Ofek et al. (2010), but this would result in more luminosity for distant galaxies than observed.
Within GHD it is natural to connect these events to BD mergings in the JCs that constitute the BDM halo of the Galaxy. Let us present a statistical estimate for the event frequency. For the typical duration we take day, so the effective BD radius is estimated as cm. The typical JC has cells of linear size . At a given moment in time the average number of BD pairs that occupy the same cell in a given JC is . In the Galaxy the number of Jeans clusters is . The resulting rate of merging events is /deg2yr, modestly overestimating the observed value.
The amount of gravitational energy available in the merging process is large, of order , which means some J/kg. Assuming this to be emitted at distance of 3 kpc during the event time of 1 day in a frequency band of 10 GHz gives a bright radio event of 1 Jy; such events are observed, see table 2 of (Ofek et al. (2010)). Ofek et al. also discuss scenarios for the emission in radio such as synchrotron radiation.
9 Direct detections in nearby star forming clouds
A star formation region in NGC 5253 at distance of a few Mly has been observed in radio, corresponding to some 1200 O7 stars in a parsec-sized central region (Turner & Beck (2004)). This is understood to represent the formation of a young globular cluster with some 100-200 times more stars in total, out of supposed molecular clouds. The recombination linewidth of 75 km/s has been interpreted to give a mass of 4-6 (Turner & Beck (2004)). In our picture this central region is a Jeans cluster with the right size and mass, which is on its way to turn into a young globular cluster by star formation out of its BDs. The region as a whole, with some 7000 O7 stars within 30 pc, can be explained as an aggregation of JCs.
Recently a 2-3 Jupiter mass object has been discovered in the Ophiuchus star forming region (Marsh et al. (2010)). Estimated properties were a T spectral type, a surface temperature near 1400 degrees K, and an age of one million years. At its inferred distance of 100 pc it is presumed to be a member of the Ophiuchus cloud region because of its heavy visual absorption. Since active star formation in the region is underway, it is inferred that the object has formed in the standard cloud collapse scenario, and represents an object near the bottom of the stellar mass function. It cools quickly (in about a million years), so that it may represent a population of planet-mass MACHO objects. With reasonable assumptions about their luminous lifetimes and number, they have been inferred to be a cosmologically significant population (Marsh et al. (2010)). In GHD one sees the Jupiters as clumps of BDs, that may go on growing to a star. Hence this observation hints at the population of BDs.
This discovery is discussed (Marsh et al. (2010)) in the context of the many similar objects found in the most active star forming regions in Orion (Osorio (2000); Lucas et al. (2006)). All these authors recall that such objects would not form in the framework of the standard linearized theory of star formation, and appeal to fragmentation models (Whitworth & Stamatellos (2006)) which, however, seem incompatible with the extreme binarity seen in the statistics of double stars and our solar system’s Kuiper Belt Objects.
In Table 1 we show multiple estimates of the same physical parameter where they have been independently estimated in different research programs related to the BDs. The masses are one earth mass and up. Depending on their temperature they may have very different sizes and densities, since they are H-He gas clouds.
| Estimator | microlensing | ESE | Cometary knots | T dwarfs |
|---|---|---|---|---|
| Log Mass ( ) | –5.5 | –5.3 (–5.2) | –2.6 | |
| Log radius (cm) | – | 14.5 | 15.6 | 9.9 |
| Log density (cm-3) | – | 12 | 6,(5.9), (5.6) | 24.2 |
| Velocity (km s-1) | 600 | 500 | – | – |
| Cosmological Signf. | yes | yes | – | yes |
Table 1. Measured and inferred properties of micro brown dwarfs from various observations. ESE = Extreme Scattering Events.
10 Inferred source of Lyman-alpha clouds
In quasar spectra a population of thousands of hydrogen-dominated clouds is seen causing weak absorption lines called the Lyman-alpha forest. Their properties have been reviewed (Rauch (1998)). Since they are detected as redshifts of the 1216 Å Ly- line and are sometimes accompanied by higher level Lyman lines, their identification is secure. In a typical quasar spectrum, one or two stronger and damped lines are also seen. In these cases there are weak metallic absorption lines at the same redshift. Because they are found along sight lines to cosmically distant quasars, much is known about their distribution from their redshifts. They are known to be relatively uniformly distributed in redshift, with, however, mild clumping at distance/size scales of 20 Mpc, showing the cosmic pattern of voids on scales of 30 - 130 Mpc. The depth of cloud absorption lines and their numbers increase with redshift . Perhaps their most interesting property from a structural point of view is the velocity width parameter measured for each line. The average value is approximately 30 km/s, which suggests that as clouds they should dissipate on a time scales of several years. Their observed permanence was first presumed to imply that the clouds were confined by a hot inter-cluster medium, which was searched for but not found. This has left the subject with no explanation for their structure and common existence.
We propose that the clouds are in fact outer atmospheres of the BD population in JCs detected in other observations as inferred above. JCs intersecting by the quasar sight line lie in a cylinder, so their mass can be estimated as , where the factors describe the average cosmic baryon density not in X-ray gas, the JC surface area and the typical quasar distance, respectively. Though this corresponds to 0.0001 JCs only, a few thousand may actually occur because matter is clumped in filaments between voids, where the baryonic density may be 5-10 times the mean galactic mass density, i.e. about . In a JC located close to the quasar, about 900 BDs will lie in front of it, which by their random motion at 30 km/s cause an absorption line of width 30 km/s. This number becomes lower for JCs closer to us, because the opening angle of the quasar covers less of their surface. At higher redshift the BD atmosphere will be warmer and larger, which explains the increase of Lyα absorption with (Rauch (1998)).
We attribute the broad absorption lines corresponding to b = 200 km s-1 to a set of JCs along the line of sight with this velocity dispersion typical for objects in galaxies, while the involved mass could then be large enough to expose the metal lines. With most JCs located in galaxies, the typical number of JCs per galaxy pierced by the light path of the quasar is , which explains that per few thousand narrow absorption lines there will typically be a few broad ones.
11 Iron planet cores
A perplexing problem is the origin of the magnetic iron cores of the Earth, Mercury and Neptune. It is well known that most of the metallic atoms in the universe are seen in meteoritic dust as oxides of iron, silicon etc. So it is difficult to imagine how the iron was reduced to metallic form underneath an ocean of water. However, primordially formed BDs offer a direct scenario. From their periodic mergings to form larger planets and eventually stars, they have well-mixed and massive gas and liquid-solid hydrogen layers with wide temperature ranges that gravitationally sweep up and reprocess iron and nickel oxide supernova II star dust from the interstellar medium (Schild & Dekker (2006). Metal oxide dust grains meteor into the hydrogen layers where reaction kinetics and hot mixing mergers reduce iron, nickel and other oxides to metals in solid and liquid forms that sink to form dense metal core layers under oxide layers (rocks, water) with cold outer hydrogen layers. Planets near the sun lose most of their hydrogen atmospheres in their pre-stellar accretion discs and by the solar wind.
12 Black holes, young stars and globular clusters
Our conclusion that the long sought baryonic dark matter has been observed already as micro brown dwarfs of planetary mass has implications for the formation process of planets and stars. The observation of young stars (age 1 Myr) in a disk near the black hole (BH) in the center of our Galaxy known as Sag A∗, is difficult to explain and termed the “paradox of youth” (Lu et al. (2009). A new scenario is offered by GHD: in a Jeans cluster passing close by the BH the BDs were heated by the strong tidal forces, they expanded and coagulated in situ into new stars; this JC got disrupted and its stars ended in a plane.
Tidal forces by heavy central BHs may generally have a strong impact on nearby passing JCs. Let us suppose that JCs have an appreciable chance to be transformed into a globular star cluster (gc) when their gravitational energy exceeds a certain bound , which happens when they pass within a distance . In an isothermal model their number is proportional to , explaining that is proportional to , in accordance with the observation (Burkert & Tremaine (2010)).
A population of extended star clusters in the discs of two nearby galaxies is called faint fuzzies (Burkert, Brody & Larsen (2005)), but their determined properties are as expected for a recently formed stars in a population of JCs.
13 Paradox on the visibility of early galaxies
After the submission of the original manuscript the galaxy UDFy-38135539 was established to have redshift , so we see light that it emitted 600 million years after the big bang (Lehnert et al. (2010)). This is believed to be well before the reionization era, so it is a question how the opaque hydrogen gas could allow the visibility. The authors say in the abstract: We find that this single source is unlikely to provide enough photons to ionize the volume necessary for the emission line to escape, requiring a significant contribution from other, probably fainter galaxies nearby. This scenario reflects LCDM thinking, it postulates the existence of many unobserved faint galaxies and some a hoc tubes of transparency between hydrogen clouds. This by itself is already questionable, since in the local universe very few galaxies lie on the same sightline. More importantly, if the hydrogen is locked up in BDs, as we put forward, these faint galaxies and mythical clear sight-lines are not needed since then the universe is mainly empty and transparent.
14 Conclusion and outlook
Contrary to the current opinion, the galactic dark matter (DM) is likely of baryonic origin and observed already. It may seem ironic that nature has sequestered most of the baryonic matter in nested clumps of clumps, from planet mass to cluster and then to galactic scale. The structure predicted by the theory of gravitational hydrodynamics, micro brown dwarfs (BDs, muBDs) grouped in Jeans clusters (JCs), is supported by an impressive body of observations: quasar microlensing, planetary nebulae, 15K cold dust temperatures, “cirrus clouds”, extreme scattering events, parabolic events, direct observations and long duration radio events. This picture offers an explanation for paradoxes such as the Lyman-alpha forest, iron planet cores and young stars near the black hole in the center of the Galaxy. Globular clusters seem to arise from JCs that are heated by tidal forces when passing nearby the galaxy’s central black hole. Likewise, galaxy merging turns dark JCs into young globular clusters along the merging path (Nieuwenhuizen, Gibson & Schild (2009)), rather than producing tidal tails of old stars that have remained unobserved (Bournaud, Duc & Emsellem (2008)).
Fundamentally, our arguments show that evidence of the condensed hydrogen objects constituting the baryonic dark matter have been accumulating for many years, but have not been considered together. However, the recent discovery that the Halo has the hydrogen temperature clinches the case, and what had previously been called “cirrus dust” must now be understood as the missing hydrogen and other baryons. So we begin to hint at other revisions to the fundamental theory needed to explain the origin, nature, and properties of the baryonic dark matter. We summarize our findings in Table 2.
Also other observations can be easily explained in the GHD picture. More binary Trans-Neptunian Objects than expected have been observed (Stephens (2006)); This just matches with the the first stages of coagulation of BDs. Brown dwarfs are known to exist but a description of their formation from hydrogen clouds is problematic (Burgasser (2008)); Coagulation of BDs explains it immediately. Radio astronomers may have found the first ever galaxy that is made almost entirely of dark matter. In the Virgo cluster a “dark galaxy” with hydrogen mass and dynamical mass exists with mass-to-light ratio of 500 times solar, which rotates in the same way as an ordinary galaxy, but without containing stars (Minchin et al. (2005)); it may just have all its Jeans clusters still dark. In the same M region of the Virgo cluster seen in the latter report, other unexpected hydrogen clouds were found with hydrogen mass up to and dynamical mass up to (Kent (2010)).
The direct search by Eros-I has concluded that the case of earth mass MACHOs is ruled out (Renault et al. (1998)). However, for our BDs the Einstein radius that describes the lensing is comparable with the physical radius of the lens object, which complicates the lensing. This motivates new MACHO searches, which we plan to start in fall 2011, benefiting from the improvement of CCD cameras and taking into account the finite–source and finite–lens size effects. With the JCs in front of the Magellanic clouds and the Galactic bulge to be identified first by the Planck mission, or the ones detected already as “cirrus clouds” by DIRBE, BOOMERANG and WMAP, the task is reduced to searching lensing events by BDs in their JCs, a much more direct approach than the blind searches performed till now.
The cold dark matter paradigm seems to be left with a bleak face. In our picture its purported elementary particle has no reason to exist, because large scale structure formation can progress from gravitational hydrodynamics alone (Nieuwenhuizen, Gibson & Schild (2009)). Meanwhile the expected mass budget of the Galactic dark halo is well estimated by our counting of cirrus clouds and our modeling of BD mergings as the observed radio events. For the extra-Galactic situation, these findings are in line with the optical depth in quasar micro-lensing being of order unity. In line with this, the recent Xenon 100 and CDMS cold dark matter searches have ruled out all previous detection claims (Aprile et al. (2010); Akerib et al. (2010)). Massive neutrinos pose an alternative DM scenario (Nieuwenhuizen (2009)), which is cosmologically sound (Nieuwenhuizen, Gibson & Schild (2009)). Detection of the 1.5 eV neutrino mass in Katrin 2015 would solve the notorious dark matter riddle in a dual manner, by dark baryons for the “Oort” galactic DM, clustered according to gravitational hydrodynamics, and by massive neutrinos for the “Zwicky” cluster DM.
It would also be interesting to have more cases where the JCs can be resolved into their constituent BDs, such as it is possible in planetary nebulae. An interesting case is the star formation region in the Galaxy in the direction Crux, where individual Jeans clusters can be identified from their 14 K thermal emission in recent images (ESA (2009)).
Extreme reliance on linearized theories in astrophysics seems to have seriously misguided the star formation theory. When direct simulations of gravitational perturbations in a gas cloud showed collapse, the result was dismissed as unphysical and due to numerical instability (Truelove et al. (1997)), and eliminated by Jeans filters. However, we consider the instability as physical, producing e.g. the discussed BDs, and the linearized theory as oversimplified. Interestingly, earth mass dark matter halos were discovered independently in a supercomputer analysis of the concordance model with neutralino dark matter, predicting that the first structures to form have earth mass and size of the solar system (Diemand et al. (2005)). Merging and infall of BDs then offers a new scenario for the formation of heavier objects, from super-earths to heavy stars. This work thus motivates the numerical study of the full nonlinear hydrodynamics of structure formation and the -body dynamics of BD merging as a precursor to star formation and galaxy merging.
| Observation | Jeans clusters | micro brown dwarfs | cosmol. signif. |
|---|---|---|---|
| galactic rotation curves | inferred | inferred | yes |
| Tully-Fisher relation | infered | inferred | – |
| galaxy merging | yes | inferred | yes |
| quasar microlensing | inferred | yes | yes |
| planetary nebulae | inferred | yes | – |
| cold halo temperatures | – | yes | – |
| cirrus clouds | yes | yes | yes |
| extreme scattering events | inferred | yes | yes |
| parabolic events | – | yes | – |
| mysterious radio events | yes | yes | yes |
| star formation in Jeans cls | yes | inferred | - |
| direct detection T-dwarf | – | inferred | – |
| Ly-alpha forest | inferred | yes | inferred |
| Iron planet cores | – | inferred | – |
| BH mass – # globulars | yes | inferred | – |
| visibility of early galaxies | inferred | yes | yes |
Table 2. Observations discussed in the text, their relation to Jeans clusters and micro brown dwarfs and their cosmological significance.
14.1 Acknowledgments
We thank James Rich and Marcella Veneziani for discussion.
Appendix A Properties of Jeans clusters
Right after the transition of plasma to gas (decoupling of photons, recombination of electrons and protons) there appears fragmentation at the Jeans length, creating JCs, and inside them at the viscous length, creating BDs (Nieuwenhuizen, Gibson & Schild (2009)). Following Weinberg, we estimate the typical mass of a JC to be . Let denote the typical mass of the JCs and their velocity dispersion, and and the ones of the BDs. We introduce the dimensionless variables , /200 km s-1, , /30 km s-1; these parameters are taken equal to unity in the main text.
For the distribution of BDs in a JC we consider the isothermal model where is the velocity dispersion in terms of the rotation speed. The number density is . A JC has virial radius m and contains BDs. The time for a BD to cross the JC is yr, short enough to induce the isothermal distribution because of Lynden Bell’s “violent relaxation”. The average mass density is kg/m3.
Our Galaxy with mass has a number of JCs in its halo, that also form an ideal gas with an isothermal distribution , a shape central to the explanation of the flattening of rotation curves and the Tully-Fisher and Faber-Jackson relations (Nieuwenhuizen, Gibson & Schild (2009)). The Galactic halo contains BDs, only two orders of magnitude more than the number of earth mass objects estimated from simulation of LCDM cosmology (Diemand et al. (2005)) .
Appendix B Tadpole galaxy merging
The beginning of the wake in Fig. 1 starts at m lyr from the center. Its width can be estimated at this point as m, and is kept fairly constant over the entire length. For spherical symmetry the mass enclosed within is , a reasonable value. We estimate the number of JCs in this light path as the number in a cylinder of radius through the center, , yielding the estimate , which is correct within a factor of a few, given that some 11,000 were analyzed in Ref. (Fall et al. (2005)).
Appendix C Number of BDs in quasar micro lensing
Let us estimate the number of BDs in the lens through which we observe the quasar Q0957A+B discussed in the main text. We take Hubble constant km/(s Mpc). The quasar has redshift and angular distance cm, the lens has and cm. The most luminous part of the quasar is the inner ring of the accretion disk of cm in diameter and cm wide, observed as angular diameters as and 3.7 nas, somewhat distorted through shear in the lens. At the position of the lens this corresponds to a luminous ring of physical diameters cm and cm, much less than the above JC radius, but much more than the BD radius of cm discussed below. The Einstein radius of an BD in the lens is cm, slightly larger than , so we are in the finite-source point-lens situation.
With the quasar observed in arm A under angle with respect to the center of the lensing galaxy and under in the B arm, the shortest physical distance of the light paths to the center of the lens galaxy is cm and cm, respectively. The average number of JCs that lie along the A sight line is , where is the projected isothermal number density. This brings and likewise . Being nearly of order unity, these numbers support the fact that microlensing events are observed in both arms and put forward that each of the two sight lines of the quasar pierces through one JC.
Not having information about the distance of the sight lines to the centers of the JCs, we take for the number density of BDs the average value . With active area this estimates that BDs overlap the ring at any moment in time in either arm. The optical depth, i. e., the number of BDs that lie inside a cylinder with radius , takes the typical value . (These estimates do not account for the shear). The lower values of 1.35 and 0.35 deduced from the signal analysis arise when the sight lines are near the border of the JCs, where the BD density is lower than average. All by all, the observations are consistent with isothermal modeling of BDs in JCs.
Appendix D MACHOs in front of the Magellanic clouds
The Small and Large Magellanic Clouds (MCs) are satellites of the Milky Way at distance kpc for the LMC, having stars in their surface of 9+84 on the sky, with , per unit solid angle equivalent to /deg2. The angular surface of a JC at distance (we take the typical JC half way, ) is , so the average number of stars of the MCs covered by a JC is . The number of JCs up to distance is , so in front of the MCs there are some 3400 JCs. They should be identified from direct thermal emission by the WMAP and Planck satellites, as foregrounds that have to be subtracted in order to study the cosmic microwave background.
When an BD comes within the Einstein radius m to the sightline of a small star, it acts as a lens and enhances the intensity during a time hrs. The BDs that lens a given star within a period , lie in a strip on the sky with surface , which embodies BDs. This leads to a lensing event rate of yr for each star covered by a JC and monitoring this frequency allows to estimate . With 3400 stars of the MCs per JC, this leads 4100 of Macho events per yr per JC and in total events per year in front of the MCs.
In the Eros–I search some stars were monitored, so we would expect some 2800 lensing events per year, while none was discovered. It was realized that the stellar radii are at least comparable to the Einstein radius (finite source); no lensing detection is made when the stellar radius exceeds 16 solar radii, which excludes a sigificant part of the studied stars. However, also the deflector is extended (finite lens), because the Einstein radius of the BD just coincides with our estimate for its physical radius. This may lead to obscuration, and on top of this, there will be refraction effects from the atmosphere of the BD: Lensing of earth mass BDs towards the MCs appears to be a subtle case, that calls for more study.
Each JC has BDs with Einstein area . This brings a coverage fraction or “optical depth” equal to , as is well known. But JCs themselves have a much larger optical depth, , so it is of course advantageous to identify the JCs first and monitor the light from stars behind them.
Appendix E Composition of cirrus clouds
Fig. 3 of the cirrus clouds shows mass concentrations with kJy emission (Veneziani et al. (2010)). Let us assume that this DIRBE signal at THz stems from thermal emission at the BD surface with temperature K, with the Planck function equal to GJy. We first investigate whether it may arise from individual BDs. The distance to the nearest BD can be estimated if the Sun is inside a local Jeans cluster. The typical number density leads to a typical distance cm, or 82 AU, which is well before the Oort cloud, believed to start at 2000 AU. With the BD radius taken from previous section, we get an intensity kJy, the observed scale. But the angular diameter of an BD at this distance is , much smaller than the structures in Fig. 3.
The signal is therefore more likely arising from JCs. Their local number density is isothermal, , involving the distance 25,000 lyr to Sag. A∗, and yields the typical distance to next JC as m or 940 lyr. The BDs in next JC bring together also a kJy signal, kJy. At this distance the JC diameter appears at an angle of , in good agreement with the largest structures of Fig. 3. The angular surface of the JC is . The intensity per unit solid angle is sr MJy/sr. This is essentially the right order of magnitude, since several structures in fig. 3 have the maximal intensity of 2 MJy/sr, which is achieved for JCs with proper values of and .
Let us estimate the number of structures in Fig. 3. Arising from JCs with equal intensity at varying distances, they form clumped structures with diameter of 1∘ down to, say, 0.25∘, corresponding to distances m and m, respectively. The number of JCs in a spherical shell between them is . In a DIRBE area one gets as number of JCs , which is a fair estimate for the number of structures in Fig. 3.
We can therefore conclude that these concentrations likely arise from JCs that constitute the full Galactic dark matter.
Appendix F Rate of BD merging
We attribute the observed radio events to merging of BDs in JCs that constitute the BDM of the Galaxy. Let us present a statistical estimate for its frequency. From the event duration the effective BD radius is estimated as cm. The typical JC has cells of linear size . At a given moment in time its typical number of events, i. e., the number of BD pairs that occupy the same cell, is of order unity, . The rate of mergings is this number divided by , viz. yr, corresponding to deg2yr. This estimates fairly well the observed rate yr and the extraplolated full sky rate /yr is equivalent to merging events in the Hubble period of 14 Gyr, which amounts to two merging events per BD. Given that all large objects, like the Sun, arise from merged BDs, there should still be many original BDs, and this is observed in Fig. 2 of Helix.
The amount of energy available in the merging process is large, of order , some J/kg. Assuming this to be emitted at distance of 3 kpc during the event time of 1 day in a frequency band of 10 GHz gives a bright radio event of 1 Jy; such events are observed, see table 2 of (Ofek et al. (2010).
Appendix G Lyman-alpha forest
Let us consider a quasar of mass at redshift . It has a Schwarzschild radius m and angular distance m. A JC, at redshift , is much larger, the number of its BDs in front of the quasar equals .
JCs intersected by the quasar sight line lie in a cylinder of radius , so their mass can be estimated as , where the factors describe the average cosmic baryon density not in X-ray gas, the surface area and typical quasar distance, respectively. This corresponds to 0.0001 JCs. But the typical density in filaments between cosmic voids is times the average galactic density of 0.2 /pc3, some , so the clumpedness of matter can explain that indeed BDs cause a narrow absorption line per JC.
References
- Agol (2002) Agol, E. Occultation and microlensing. 2002 ApJ 579 430–436
- Akerib et al. (2010) Akerib, D. S. et al. (CDMS Collaboration) A low-threshold analysis of CDMS shallow-site data. 2010. http://arxiv.org/pdf/1010.4290v1.
- Alcock et al. (1997) Alcock, C. et al The MACHO Project LMC Microlensing Results from the First Two Years and the Nature of the Galactic Dark Halo. 1997 ApJ 486 697–726
- Alcock et al. (2000) Alcock, C. et al The MACHO Project: Microlensing Results from 5.7 Years of LMC Observations. 2000 ApJ 542, 281–307
- Alcock et al. (2001) Alcock, C. et al The MACHO Project: Microlensing Detection Efficiency. 2001 ApJ Sup. 136, 439–462
- Aprile et al. (2010) Aprile, E. et al First Dark Matter Results from the XENON100 Experiment. 2010 Phys. Rev. Lett. 105, 131302,1–4
- Aubourg et al. (1993) Aubourg, E, et al Evidence for gravitational microlensing by dark objects in the Galactic halo. 1993 Nature 365, 623–625
- Bournaud, Duc & Emsellem (2008) Bournaud, F., Duc, P. A. & Emsellem, E. High-resolution simulations of galaxy mergers: resolving globular cluster formation. 2008 MNRAS 389, L8–L12
- Bouwens et al. (2010) Bouwens, R. J. et al Constraints on the First Galaxies: Galaxy Candidates from HST WFC3/IR. 2010 ApJ 709 L133-L137
- Burkert, Brody & Larsen (2005) Burkert, A. Brodie, J. and Larsen, S. Faint Fuzzies and the Formation of Lenticular Galaxies. 2005 ApJ 628, 231-238.
- Burkert & O’Dell (1998) Burkert A. & O’Dell, C.R. The Structure of Cometary Knots in the Helix Nebula. 1998 ApJ 503, 792–797
- Burgasser (2008) Burgasser, A. Brown Dwarfs; Failed Stars, Super Jupiters. 2008 Physics Today, June 2008, 70 - 71.
- Burkert & Tremaine (2010) Burkert, A. & Tremaine, S. A correlation between central supermassive black holes and the globular cluster systems of early-type galaxies. 2010 ApJ 720, 516-521
- Burud et al. (2000) Burud, I. et al An Optical Time Delay Estimate for the Double Gravitational Lens System B1600+434. 2000 ApJ 544, 117–122
- Burud et al. (2002) Burud, I. et al Time delay and lens redshift for the doubly imaged BAL quasar SBS 1520+530. 2002 Astron. & Astrophys 391, 481–486
- Conroy et al. (2010) Conroy, P., Loeb, L. & Spergel, D. N. Evidence against dark matter halos surrounding the globular clusters MGC 1 and NGC 2419. 2010 arxiv:1010.5783
- Cyburt et al. (2008) Cyburt, R. H., Fields, B. D. and Olive, K. A. An update on the big bang nucleosynthesis prediction for 7Li: the problem worsens. 2008 JCAP 11, 012.
- Diemand et al. (2005) Diemand, J. Moore, B. and Stadel, J. Earth-Mass Dark-Matter Haloes as the First Structures in the Early Universe. 2005 Nature 433, 389 - 391
- Diemand et al. (2008) Diemand, J., et al Clumps and streams in the local dark matter distribution. 2008 Nature 454, 735–738
- Disney et al. (2008) Disney, M. J. et al Galaxies appear simpler than expected. 2008 Nature 455, 1082–1084
- Elmegreen et al. (2005) Elmegreen, D. M. et al Galaxy Morphologies in the Hubble Ultra Deep Field: Dominance of Linear Structures at the Detection Limit. 2005 ApJ 631, 85–100
- ESA (2009) ESA 2009: Photograph of star formation region in Crux: http://sci.esa.int/science-e/www/object/index.cfm?fobjectid=3D45626.
- Fall et al. (2005) Fall, S. M. Chandar, R. and Whitmore, B. The Age Distribution of Massive Star Clusters in the Antennae galaxies. 2005 ApJ 631, L133-136.
- Geller & Huchra (1989) Geller, M. J. & Huchra, J. P. Mapping the Universe. 1989 Science 246, 897–903
- Gibson (1996) Gibson, C. H. Turbulence in the Ocean, Atmosphere, Galaxy, and Universe. 1996 Appl. Mech. Rev. 49, 299–315
- Gibson & Schild (2002) Gibson, C. G. & Schild, R. E. Interpretation of the Tadpole VV29 merging galaxy system using Hydro-Gravitational Theory 2002 arXiv:astro-ph/0210583
- Hora et al. (2006) Hora, J. L., Latter, W. B., Smith, H. A. &Marengo, M. Infrared observations of the helix planetary nebula. 2006 ApJ 652, 426–441; Err. - ibid. 2007 656, 629 .
- Hill et al. (2005) Hill, A. et al. Deflection of Pulsar Signal Reveals Compact Structures in the Galaxy. 2005 ApJ 619, L171.
- Hubble (1930) Hubble, E. P. Distribution of luminosity in elliptical nebulae. 1930 ApJ 71 231–276
- Huggins et al. (2006) Huggins, P. J., Forveille, T., Bachiller, R., Cox, P., Ageorges, N., & Walsh, J. R. High-Resolution CO and H2 Molecular Line Imaging of a Cometary Globule in the Helix Nebula. 2002 ApJ 573, L55–L58
- Kaslinsky et al (2008) Kashlinsky, A., Atrio-Barandela, F., Kocevski, D.& Ebeling, H. A measurement of large-scale peculiar velocities of clusters of galaxies: results and cosmological implications. 2008 ApJ 686, L49–L52
- Kent (2010) Kent, B. R. Clouds Toward the Virgo Cluster Periphery: Gas-rich Optically Inert Galaxies. 2010 arxiv:1010.6095; ApJ., to appear
- Kroupa et al. (2010) Kroupa, P. et al Local-Group tests of dark-matter Concordance Cosmology: Towards a new paradigm for structure formation? 2010 arXiv:1006.1647.
- Lee & Komatsu (2010) Lee, J. & Komatsu, E. Bullet cluster: a challenge to CDM cosmology. 2010 ApJ 718 60–65
- Lee et al. (2010) Lee, C. H., Seitz, S., Riffeser, A. & Bender, R. Finite-source and finite-lens effects in astrometric microlensing. 2010 arXiv:1005.3021
- Lehnert et al. (2010) Lehnert M. D. et al Spectroscopic confirmation of a galaxy at redshift z = 8.6. 2010 Nature 467, 940-942
- Liu et al. (2010) Liu, G., et al An Investigation of the Dust Content in the Galaxy pair NGC 1512/1510 from Near-Infrared to Millimeter Wavelengths. 2010 AJ139, 1190–1198
- Lu et al. (2009) Lu, J.R., Ghez, A.M. et al A disk of young stars at the Galactic center as determined by individual stellar orbits. 2009 ApJ 690, 1463–1487
- Lucas et al. (2006) Lucas, P. Weights, D. Roche, P. & Riddick, F. Spectroscopy of planetary mass brown dwarfs in Orion. 2006 Mon. Not. Roy. Astr. Soc. 373, L60–L64
- Marsh et al. (2010) Marsh, K., Kirkpatrick, D. & Plavchan, P. A young planetary-mass object in the Oph cloud core. 2010 ApJ 709, L158–L162
- Meaburn et al. (1998) Meaburn, J. et al The nature of the cometary knots in the Helix planetary nebula (NGC 7293) 1998 Mon. Not. Roy. Astr. Soc.294, 201– 223
- Meaburn & Boumis (2010) Meaburn, J. & Boumis, P. Flows along cometary tails in the Helix planetary nebula NGC 7293. 2010 Mon. Not. Roy. Astr. Soc. 402 381–385
- Minchin et al. (2005) Minchin, R. et al. 21 cm Synthesis Observations of VIRGOHI 21 A Possible Dark Galaxy in the Virgo Cluster. 2005 ApJ 670, 1056
- Nieuwenhuizen (2009) Nieuwenhuizen, T. M. Do non-relativistic neutrinos constitute the dark matter? 2009 Europhys. Lett. 86, 59001, 1–6
- Nieuwenhuizen, Gibson & Schild (2009) Nieuwenhuizen, T. M., Gibson, C. H. & Schild, R. E. Gravitational hydrodynamics of large-scale structure formation. 2009 Europhys. Lett. 88, 49001,1–6
- O’Dell et al. (1996) O’Dell, C. and Handron, K. Cometary knots in the Helix nebula. 1996 AJ111, 1630–1640
- Oesch et al. (2010) Oesch, P. et al Structure and Morphologies of z 7–8 Galaxies from Ultra-deep WFC3/IR Imaging of the Hubble Ultra-deep Field. 2010 ApJ 709, L21–L25.
- Ofek et al. (2010) Ofek, E. O. et al Long-duration radio transients lacking optical counterparts are possibly galactic neutron stars. 2010 ApJ 711, 517–531
- Oort (1932) Oort, J. H. The force exerted by the stellar system in the direction perpendicular to the galactic plane and some related problems. 1932 Bull. Astron. Inst. Netherl. 6, 249–287
- Osorio (2000) Osorio, M. R. Z., Bejar, V. J. S., Martin, E. L. et al Discovery of young, isolated planetary mass objects in the sigma Orionis star cluster. 2000 Science 290, 103–107
- Paraficz et al. (2006) Paraficz, D. et al. Microlensing variability in time-delay quasars. 2006 Astron. & Astrophys 455, L1–L4
- Pelt et al. (1998) Pelt, J., Schild, R., Refsdal, S. & Stabell, R. Microlensing on different timescales in the lightcurves of QSO 0957+561 A,B. 1998 Astron. & Astrophys 336, 829–839
- Radovich et al. (2001) Radovich, M., Kahanpaa, J. & Lemke, D. Far-infrared mapping of the starburst galaxy NGC 253 with ISOPHOT. 2001 Astron. & Astrophys 377, 73–83
- Rauch (1998) Rauch, M. The Lyman Alpha Forest in the Spectra of QSOs. 1998 Ann. Rev. Aston. & Astrophys. 36, 267–316
- Renault et al. (1998) Renault, C. et al Search for planetary mass objects in the Galactic halo through microlensing. 1998 Astron. & Astrophys 329 522–537
- Rison & Kochanek (2005) Rusin, D. & Kochanek, C. S. The evolution and structure of early–type field galaxies: a combined statistical analysis of gravitational lenses. 2005 ApJ 623, 666–682
- Schild (1996) Schild, R. E. Microlensing variability of the gravitationally lensed quasar Q0957+561 A,B. 1996 ApJ 464, 125–130
- Schild (1999) Schild, R. E. A wavelet exploration of the Q0957+561 A, B brightness record. 1999 ApJ 514, 598–606
- Schild & Vakulik (2003) Schild, R. E. & Vakulik, V. Microlensing of a Ring Model for Quasar Structure. 2003 AJ 126, 689–695
- Schild & Dekker (2006) Schild, R. E. & Dekker, M. The transparency of the Universe limited by Lyman-alpha clouds. 2006 Astron. Nachr. 327, 729-732
- Schild & Gibson (2008) Schild, R. E. & Gibson, C. H. Goodness in the Axis of Evil. 2008 arXiv:0802.3229
- Schneider, Ehlers & Falco (1992) Schneider, P., Ehlers, J. & Falco, E. Gravitational Lenses (Springer, Berlin,1992)
- Stephens (2006) Stephens, D. and Nole, K. Detection of Six Trans-Neptunian Binaries with NICMOS: A High fraction of Binaries in the Cold Classical Disk. 2006 AJ 131, 1142 - 1148.
- Sumi et al. (2010) Sumi, T. et al A Cold Neptune-Mass Planet OGLE-2007-BLG-368Lb: Cold Neptunes Are Common. 2010 ApJ 710, 1641–1653
- Tisserand et al. (2007) Tisserand, P. et al Limits on the Macho Content of the Galactic Halo from the EROS-2 Survey of the Magellanic Clouds. 2007 Astron. & Astrophys 469, 387–404
- Tran et al. (2003) Tran, H. D., Sirianni, M. et al Advanced Camera for Surveys Observations of Young Star Clusters in the Interacting Galaxy UGC 10214. 2003 ApJ 585 750
- Truelove et al. (1997) Truelove, J. K. et al The Jeans condition. A new constraint on spatial resolution in simulations of isothermal self-gravitational hydrodynamics. 1997 ApJ 489, L179–L183
- Turner & Beck (2004) Turner, J. L. & Beck, S. C. The birth of a super-star cluster. 2004 ApJ 602, L85-L88
- Udalski et al. (1993) Udalski, A. et al The optical gravitational lensing experiment. Discovery of the first candidate microlensing event in the direction of the Galactic Bulge. 1993 Acta Astron. 43, 289–294
- Veneziani et al. (2010) Veneziani, M. et al Properties of galactic cirrus clouds observed by BOOMERanG. 2010 ApJ 713, 959–969
- Walker (2007) Walker, M. Extreme scattering events: insights into interstellar medium on AU-scales. 2007 Astronomical Society of the Pacific Conference Series 365, 299.
- Walker & Wardle (1998) Walker, M. & Wardle, M. Extreme scattering events and Galactic dark matter. 1998 ApJ 498 L125–L128
- Weinheimer (2009) Weinheimer, C. Direct determination of Neutrino Mass from Tritium Beta Spectrum. 2009 arXiv:0912.1619
- Whitworth & Stamatellos (2006) Whitworth, A. P. & Stamatellos, D. The minimum mass for star formation, and the origin of binary brown dwarfs. 2006 Astron. & Astrophys 458, 817–829
- Wyrzykowski et al. (2009) Wyrzykowski, L., et al The OGLE view of microlensing towards the Magellanic Clouds I. A trickle of events in the OGLE-II LMC data. 2009 Mon. Not. Roy. Astr. Soc. 397, 1228–1242
- Zwicky (1933) Zwicky, F. Die Rotverschiebung von extragalaktischen Nebeln. 1933 Helv. Phys. Acta 6, 110–127