Local Stellar Kinematics from RAVE Data
I. Local Standard of Rest
Abstract
We analyze a sample of 82850 stars from the RAVE survey, with well-determined velocities and stellar parameters, to isolate a sample of 18026 high-probability thin-disc dwarfs within 600 pc of the Sun. We derive space motions for these stars, and deduce the solar space velocity with respect to the Local Standard of Rest. The peculiar solar motion we derive is in excellent agreement in radial and vertical peculiar motions with other recent determinations. Our derived tangential peculiar velocity, agrees with very recent determinations, which favour values near 13 km s-1, in disagreement with earlier studies. The derived values are not significantly dependent on the comparison sample chosen, or on the method of analysis. The local galaxy seems very well dynamically relaxed, in a near symmetric potential.
keywords:
Galaxy: kinematics and dynamics, solar neighbourhood, solar motion, local standard of rest, stellar content1 Introduction
The kinematics of stars near the Sun provide vital information regarding the structure and the evolution of the Galaxy. Since the observations are relative to the Sun, which is not stationary, the kinematical parameters we obtain need to be corrected accordingly to the Local Standard of Rest (LSR), which is defined as the rest frame of a star at the location of the Sun that would be on a circular orbit in the gravitational potential of the Galaxy. This implies the determination of the solar peculiar velocity components relative to that standard, , and . These values are also of considerable intrinsic interest, as their determination as a function of the spatial distribution and kinematic properties of the comparison stellar sample is a test of the symmetry of the local Galactic potential as a function of, for example, velocity dispersion. One can test if thin disk slowly moving stars are, or are not, affected by a Galactic bar, among many other considerations. Uncertainty in the solar kinematic parameters can have profound implications for Galactic structural analyses (cf. e.g. McMillan & Binney, 2010) and may be affected systematically in turn by presumptions about larger scale Galactic stellar populations (cf. e.g. Schönrich et al., 2010). There have been several very recent determinations of the solar peculiar velocity, including some using RAVE (RAdial Velocity Experiment, Steinmetz et al., 2006, see also Section 2) data as we use here (e.g. Pasetto et al., 2010). A summarized list of recent determinations of the space velocity components of the Sun appearing in the literature is given in Table 1, while Francis & Anderson (2009) provide an even longer list of references. Given the astrophysical significance of systematic sample- and method-dependent effects in the determination, we consider here a further determination of the solar space velocity, using a complementary technique.
The determination of the solar space motion relative to a Local Standard of Rest (LSR) is a long-standing challenge. The robust determination of the systematic motion of some stellar population relative to some agreed LSR would itself be of considerable interest. Hence many studies have been carried out since that of Homann (1886) to estimate these parameters. However, there is still uncertainty about the numerical values of the solar velocity components, relative to local thin disc stars, especially for the component, due to the complexity involved in compensating for the velocity “lag” of sample stars. The difference between the results of different researchers originates from different data as well as different procedures used. The very different results derived by Dehnen & Binney (1998) and Schönrich et al. (2010), both of whom who used the Hipparcos data, are an illustration of the continuing model-dependence of the result.
The radial () and vertical () components of the solar motion, as a function of the relevant stellar population, can be obtained in principle by direct analysis of the mean heliocentric velocities of solar neighbourhood stars, subject to appropriate sample selection. As one can see in Table 1, the various determinations are in tolerable agreement. However, the determination of the component in the direction of Galactic rotation () is complicated by systematics: the mean lag, i.e. asymmetric drift , with respect to the LSR which depends on the velocity dispersion () of the stellar sample in question. An extensive discussion of the radial Jeans’ equation on which analysis of the asymmetric drift is based, including its derivation, relevant approximations, and applications, can be found in Gilmore, Wyse & Kuijken (1989). At its simplest, a single population asymmetric drift/Jeans’ analysis assumes a linear relation between (suitable values of) the asymmetric drift of any stellar sample and its squared radial velocity dispersion (Strömberg, 1946). Formal least-squares straight line fits intercept the axis at some negative value, typically in the range -20 to -5 km s-1. This intercept determines the solar velocity using the equation =+. is the negative mean heliocentric azimuthal velocity of any stellar sample. The value =5.250.62 km s-1 of Dehnen & Binney (1998) (hereafter DB98) is typical of the smaller values deduced recently from this procedure.
However, four other recent studies argue for larger values of than that of DB98. Piskunov et al. (2006) determined a value different from that of DB98 by about 7 km s-1 in the component of the solar motion, when determined with respect to open clusters in the solar neighbourhood. Binney (2010) fitted distribution function models to two sets of velocity distributions and obtained a difference of about 6 km s-1 compared to the value of DB98. This higher value of has been confirmed by Reid et al. (2009) and Rygl et al. (2010) in their works related to radio frequency astrometry of masers in regions of massive star formation (though see McMillan & Binney (2010) for a different analysis). Schönrich et al. (2010) applied a particular chemodynamical model of the Galaxy to DB98’s data and determined a value for the solar velocity component consistent with recent high values. The key factor in the Schönrich et al. (2010) analysis, and of others, is the relevant range of radial velocity dispersions which is used in the Jeans’ analysis. Schönrich et al. (2010) showed that for 600 (km s-1)2 the Hipparcos data define a straight line, whereas for 400 (km s-1)2 they deviate from such a simple fit. If one omits stars with low dispersions, and extrapolates the linear fit for stars with high dispersion to zero, the linear fit for stars with high dispersions, one confirms the low value of DB98. Actually, this is the procedure used by DB98, who also ignored stars with low velocity dispersion due to their probable lack of dynamical equilibrium. While it is true that low velocity dispersion stars are likely to be most affected by the effects of dissolving star clusters and the non-axisymmetric gravitational potential of spiral arms, one does need to consider carefully the offset character of the relation between and at low velocity dispersions to avoid bias.
Here we use a new sample of stars and a different methodology to re-estimate the , and solar velocity components. 1) We use RAVE data extending to larger distances than the Hipparcos sample. 2) We applied the following constraints to obtain a sample of main sequence stars: i) we selected stars with surface gravity 45, ii) we omitted stars with 0.05 and 0.55 to avoid the blue horizontal branch and possible red giant stars, iii) we excluded stars with space velocity errors larger than 25 km s-1, iv) we separated stars into populations (see Section 5) and we used the thin disc population which is not contaminated by thick disc/halo as a preferred sample in our work. The last constraint is especially important in estimating , because it excludes thick disc and halo stars which have relatively large asymmetric drift. Thus, it limits the range of velocity component, which in turn minimizes possible astrophysical large-scale dynamical asymmetry effects.
The RAVE survey is described in Section 2, the data are presented in Section 3, Sections 4 and 5 are devoted to kinematics and population analysis, respectively. The results are given in Section 6 and finally a discussion is presented in Section 7.
| Reference | Source | |||
|---|---|---|---|---|
| (km s-1) | (km s-1) | (km s-1) | ||
| This study (2010) | RAVE DR3 | 8.500.29 | 13.380.43 | 6.490.26 |
| Bobylev & Bajkova (2010) | Masers | 5.52.2 | 11.01.7 | 8.51.2 |
| Breddels et al. (2010) | RAVE DR2 | 12.00.6 | 20.40.5 | 7.80.3 |
| Schönrich et al. (2010) | Hipparcos | 11.100.72 | 12.240.47 | 7.250.36 |
| Francis & Anderson (2009) | Hipparcos | 7.51.0 | 13.50.3 | 6.80.1 |
| Veltz et al. (2008) | RAVE DR1 | 8.50.3 | – | 11.11.0 |
| Bobylev & Bajkova (2007) | F & G dwarfs | 8.70.5 | 6.22.2 | 7.20.8 |
| Piskunov et al. (2006) | Open clusters | 9.441.14 | 11.900.72 | 7.200.42 |
| Mignard (2000) | K0-K5 | 9.88 | 14.19 | 7.76 |
| Dehnen & Binney (1998) | Hipparcos, dmax=100 pc | 10.00 0.36 | 5.25 0.62 | 7.17 0.38 |
| Binney et al. (1997) | Stars near South Celestial Pole | 11 0.6 | 5.3 1.7 | 7.0 0.6 |
| Mihalas & Binney (1981) | Galactic Astronomy 2nd Ed. | 9.2 0.3 | 12.0 | 6.9 0.2 |
| Homann (1886) | Solar neighbourhood stars | 17.411.2 | 16.910.9 | 3.62.3 |
2 RAVE
The RAdial Velocity Experiment (RAVE, Steinmetz et al., 2006) is a spectroscopic survey aiming to measure radial velocities and stellar atmospheric parameters, temperature, metallicity, surface gravity, of up to one million stars using the 6 degree Field (6dF) multi-object spectrograph on the 1.2 m UK Schmidt Telescope of the Australian Astronomical Observatory. The RAVE programme started in 2003, obtaining medium resolution spectra in the Ca-triplet region (8410-8795 Å) for southern hemisphere stars in the magnitude range 913. The scientific goals of RAVE include analyzing the chemical and dynamical evolution of the Galaxy, using both dwarfs and giants observed locally. The main sequence stars occupy a region extending to a distance of a few hundred parsecs, whereas giants extend up to a few kpc. RAVE was designed to avoid high reddening in the Galactic plane and contamination from the bulge, i.e. 5∘ and 315∘ constraints are applied when selecting programme stars.
RAVE is a precursor of the spectroscopic part of the cornerstone mission Gaia of the European Space Agency. The wavelength range for RAVE spectra was chosen to match that of the Gaia Radial Velocity Spectrometer (Munari, 2003; Katz et al., 2004; Wilkinson et al., 2005), i.e. around the Ca II IR triplet. This wavelength range also includes lines from elements such as Fe, Ca, Si, Mg and Ti which can be used to estimate [/Fe] in addition to overall metallicity (see Steinmetz et al., 2006, for a more detailed description of the goals of RAVE).
3 Data
The data used in this study are a working version of what will become RAVE’s third data release (DR3; Siebert et al., in prep.). DR3 will consist of 82850 stars, each with equatorial and Galactic coordinates, radial velocity, metallicity, surface temperature and surface gravity. We also note the two existing data releases, i.e. DR1 (Steinmetz et al., 2006), DR2 (Zwitter et al., 2008). Proper motions were compiled from several catalogues: Tycho-2, Supercosmos Sky Survey, PPMXL and UCAC-2. Proper motion accuracy decreases in this order, therefore, if proper motions were available from all catalogues, Tycho-2’s value was used. If Tycho-2 did not provide proper motions the values were taken from Supercosmos Sky Survey, etc. Photometric data are based on optical and near infrared (NIR) systems. The magnitudes of stars were obtained by matching RAVE DR3 with Tycho-2, USNO-B, DENIS and 2MASS catalogues. The analysis here uses stars in RAVE DR3 with 2MASS catalogue photometry.
3.1 Main Sequence Stars and Distance Determination
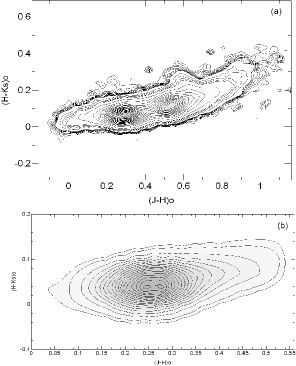
We applied two constraints to obtain a main sequence sample: we selected stars with surface gravities 45 and we excluded stars with 0.05 and 0.55. The second constraint is especially effective in reducing the contamination due to blue horizontal branch and red giant stars. Thus, the sample was reduced to 21310 stars. The - two colour diagram of the parent sample (Fig. 1a) has a bimodal distribution, confirming the presence of K and M giants in addition to the F-M dwarfs, whereas the sample obtained after applying the two constraints cited, shown in Fig. 1b, has only one mode indicating a pure main sequence sample.
Contrary to the Hipparcos catalogue, parallaxes are not available for stars observed in the RAVE survey, but not existing in the Hipparcos survey. Hence, the distances of the main sequence stars were calculated using another procedure. We applied the main-sequence colour-luminosity relation of Bilir et al. (2008), which, as described in that reference, is valid in the absolute magnitude range 06. The errors of the distances were estimated combining the internal errors of the coefficients of Bilir et al.’s (2008) equation and the errors of the 2MASS colour indices.
As most of the stars in the sample are at distances larger than 100 pc, their colours and magnitudes will be affected by interstellar reddening. Hence, distance determination is carried out simultaneously with de-reddening of the sample stars. As the first step in an iterative process, we assume the original and colour indices are de-reddened, and evaluate the absolute magnitudes of the sample stars by means of the colour-luminosity relation of Bilir et al. (2008). Combination of the apparent and absolute magnitudes for the band gives the distance of a star. We used the maps of Schlegel, Finkbeiner & Davis (1998) and evaluated the colour excess for each sample star. The relation between the total and selective absorptions in the system, i.e.
| (1) |
gives which can be used in evaluating using Bahcall & Soneira’s (1980) procedure:
| (2) |
where and are the Galactic latitude and distance of the star, respectively. is the scaleheight for the interstellar dust which is adopted as 125 pc (Marshall et al., 2006) and and are the total absorptions for the model and for the distance to the star, respectively. Then, the colour excess at the distance of the star, , can be evaluated using a specific form of Eq. 1:
| (3) |
That value was used in Fiorucci & Munari’s (2003) equations to obtain the total absorptions for the , and bands, i.e. = 0.887 , = 0.565 and = 0.382 , which were used in Pogson’ s equation (; denotes a specific band) to evaluate distances. Contrary to the assumption above, the original and colour indices are not de-reddened. Hence, the application of the equations (1) to (3) is iterated until the distance and colour index approach constant values.
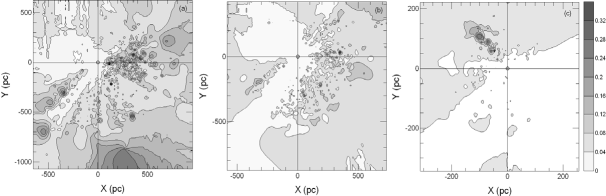
Our resulting distribution of reddening for our 21310 RAVE main sequence stars in the - Galactic plane is given in Fig. 2. To analyze the reddening in the solar neighbourhood more accurately, we divided the stars into three subsamples according to their Galactic latitude: Fig. 2a shows the stars with , in Fig. 2b the stars with are shown, whereas Fig. 2c gives the stars with . The first feature of the reddening distribution is the complex structure of the reddening in the first two panels. The local bubble, i.e. the region within 0.1 kpc distance from the Sun, is not affected by the reddening effect of the interstellar dust, whereas can be as high as 0.35 mag at larger distances. As expected high latitude stars (Fig. 2c) have smaller reddening values. The second feature is that one can not ignore the interstellar reddening even when using NIR bands.
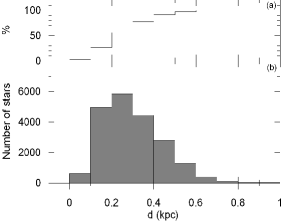
The distribution of distances (Fig. 3) shows that 80% of the sample stars have almost a normal distribution within the distance interval 00.4 kpc, whereas the overall distribution which extends up to 1 kpc is skewed, with a median of 0.276 kpc. However, 97% of the sample stars are within =0.6 kpc.
The position of the sample stars in the rectangular coordinate system relative to the Sun is given in Fig. 4. The projected shapes both on the Galactic (, ) plane, and on the vertical (, ) plane of the sample show asymmetrical distributions. The median coordinates (=60, =-107, =-108 pc) of the sample stars confirm this appearance. The inhomogeneous structure is due to the incomplete observations of the RAVE project and that the programme stars were selected from the Southern Galactic Hemisphere.

4 Kinematics
We combined the distances estimated in Section 3 with RAVE kinematics and the available proper motions, applying the (standard) algorithms and the transformation matrices of Johnson & Soderblom (1987) to obtain their Galactic space velocity components (, , ). In the calculations, the epoch of J2000 was adopted as described in the International Celestial Reference System (ICRS) of the Hipparcos and Tycho-2 Catalogues (ESA, 1997). The transformation matrices use the notation of a right handed system. Hence, , and are the components of a velocity vector of a star with respect to the Sun, where is positive towards the Galactic centre (=0∘, =0∘), is positive in the direction of Galactic rotation (=90∘, =0∘) and is positive towards the North Galactic Pole (=90∘).
Correction for differential Galactic rotation is necessary for accurate determination of , and velocity components. The effect is proportional to the projection of the distance to the stars onto the Galactic plane, i.e. the velocity component is not affected by Galactic differential rotation (Mihalas & Binney, 1981). We applied the procedure of Mihalas & Binney (1981) to the distribution of the sample stars in the - plane and estimated the first order Galactic differential rotation corrections for and velocity components of the sample stars. The range of these corrections is -25.1313.07 and -1.462.28 km s-1 for and , respectively. As expected, is affected more than the component. Also, the high values for the component show that corrections for differential Galactic rotation can not be ignored.
The uncertainty of the space velocity components , and were computed by propagating the uncertainties of the proper motions, distances and radial velocities, again using a (standard) algorithm by Johnson & Soderblom (1987). Then, the error for the total space motion of a star follows from the equation:
| (4) |
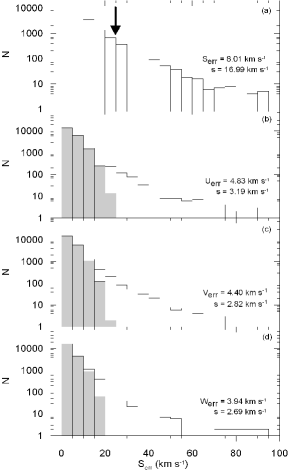
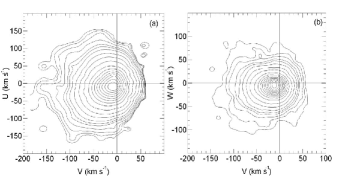
The distributions of errors for both the total space motion and that in each component are plotted in Fig. 5. The median and standard deviation for space velocity errors are S̃err=8.01 km s-1 and =16.99 km s-1, respectively. We now remove the most discrepant data from the analysis, knowing that outliers in a survey such as this will preferentially include stars which are systematically mis-analysed binaries, etc. Thus, we omit stars with errors that deviate by more than the sum of the standard error and the standard deviation, i.e. 25 km s-1. This removes 867 stars, 4% of the sample. Thus, our sample was reduced to 20453 stars, those with more robust space velocity components. After applying this constraint, the median values and the standard deviations for the velocity components were reduced to (Ũerr, Ṽerr, W̃err)=(4.833.19, 4.402.82, 3.942.69) km s-1. The two dimensional distribution of the velocity components for the reduced sample is given in Fig. 6. The most interesting feature for our present analysis in the (, ) and (, ) diagrams is the offsets of the zero points of the sample stars from the origins of the coordinate systems - these correspond to the solar velocity components.
5 Population Analysis
We now wish to consider the population kinematics as a function of stellar population, using space motion as a statistical process to label stars as (probabilistic) “members” of a stellar population. We used the procedure of Bensby, Feltzing & Lundström (2003) and Bensby et al. (2005) to allocate the main sequence sample (20453 stars) into populations and derived the solar space velocity components for the thin disc population to check the dependence of LSR parameters on population. Bensby et al. (2003, 2005) assumed that the Galactic space velocities of stellar populations with respect to the LSR have Gaussian distributions as follows:
| (5) |
where
| (6) |
normalizes the expression. For consistency with other analyses, we adopt , and as the characteristic velocity dispersions: 35, 20 and 16 km s-1 for thin disc (); 67, 38 and 35 km s-1 for thick disc (); 160, 90 and 90 km s-1 for halo (), respectively (Bensby et al., 2003). is the asymmetric drift: -15, -46 and -220 km s-1 for thin disc, thick disc and halo, respectively. , and are LSR velocities. The space velocity components of the sample stars relative to the LSR were estimated by adding the values for the space velocity components evaluated by Dehnen & Binney (1998) to the corresponding solar ones.
The probability of a star of being “a member” of a given population is defined as the ratio of the (, , ) distribution functions times the ratio of the local space densities for two populations. Thus,
| (7) |
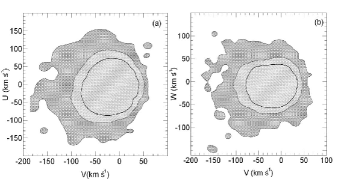
are the probabilities for a star of it being classified as a thick disc star relative to being a thin disc star, and relative to being a halo star, respectively. , and are the local space densities for thin disc, thick disc and halo, i.e. 0.94, 0.06, and 0.0015, respectively (Robin et al., 1996; Buser et al., 1999). We followed the argument of Bensby et al. (2005) and separated the sample stars into four categories: 0.1 (high probability thin disc stars), 0.11 (low probability thin disc stars), 110 (low probability thick disc stars) and 10 (high probability thick disc stars). It turned out that 18026 and 1552 stars of the sample were classified as high and low probability thin disc stars, respectively, whereas 412 and 463 stars are probabilistically thick disc and halo. The ranges and distributions of the galactic space velocity components for our different stellar population categories are given in Table 2 and Fig. 7.
| Parameters | |||
|---|---|---|---|
| (km s-1) | (km s-1) | (km s-1) | |
| (-85, 75) | (-80, 40) | (-55, 40) | |
| (-105, 100) | (-100, 50) | (-70, 50) | |
| (-165, 155) | (-175, 60) | (-115, 90) |
6 Results
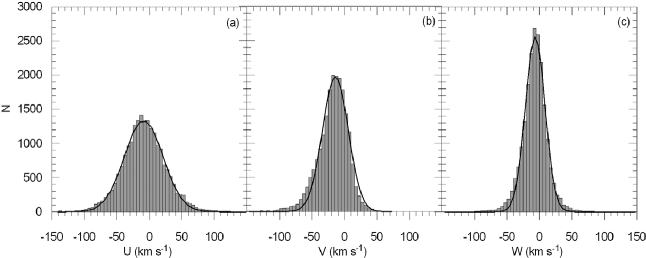
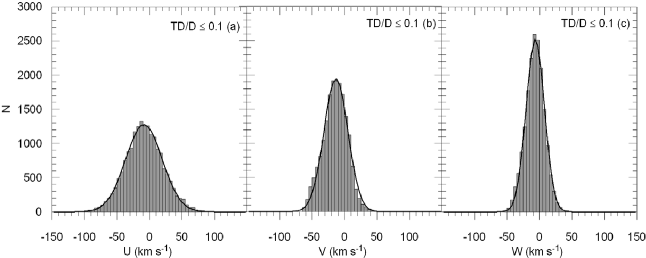
We analysed the , and space velocity components for the main sequence sample (20453 stars) as well as for four subsamples, i.e. high probability thin disc stars of different spectral types a) F, G and K (=17889 stars), b) F (=9654 stars), c) G (=5910 stars), d) K (=2325 stars) and estimated the modes of the Gaussian distributions for each category and each space velocity component. Spectral types were determined according to the 2MASS colours of the stars (Bilir et al., 2008, see Table 3). The colour range is 0.080.30 for F spectral type and 0.300.42 for G spectral type. The modes of these kinematic distribution functions are the best estimators of the (negative) value of the solar motion relative to the LSR values for the stellar group in question. The histograms for the space velocity components for the main sequence star sample are given in Fig. 8. Gaussian fits, which are clearly an adequate description of the data, reveal =8.830.24, =14.190.34 and =6.570.21 km s-1 as the modes of the corresponding histograms. The modes of the histograms for the space velocity components for high probability thin disc stars of F, G and K spectral types, obtained by fitting them to the Gaussian distributions (Fig. 9), are a little different than the preceding set, i.e. =8.500.29, =13.380.43 and =6.490.26 km s-1. The largest difference in can be confirmed by comparing Fig. 8b and Fig. 9b (see Section 7 below for details).
| Parameters | Colour Range | ||||
|---|---|---|---|---|---|
| (km s-1) | (km s-1) | (km s-1) | |||
| All sample | 0.050.55 | 8.83 0.24 | 14.19 0.34 | 6.57 0.21 | 20 453 |
| 0.050.55 | 8.50 0.29 | 13.38 0.43 | 6.49 0.26 | 18 026 | |
| F Spectral Type | 0.080.30 | 8.35 0.36 | 13.14 0.43 | 6.24 0.27 | 9 654 |
| G Spectral Type | 0.300.42 | 9.25 0.50 | 14.42 0.57 | 6.67 0.38 | 5 910 |
| K Spectral Type | 0.420.55 | 7.01 0.67 | 11.96 0.66 | 7.03 0.38 | 2 325 |
The distribution functions of Galactic space velocity components for high-probability thin disc stars, using our kinematic population assignment process, and presented separately for each of three spectral-type groups, are given in Table 3. We evaluated the modes for each distribution from the best-fit Gaussian. These results are also given in Table 3, together with those for the high-probability main sequence star sample and for the full sample. There are differences between the modes of the corresponding space velocity components for stars with F, G and K spectral types as well as between these modes and the corresponding ones for other sub-samples which will be discussed in Section 7.
7 Discussion
By definition, the Local Standard of Rest (LSR) is the reference frame of a hypothetical star at the galacto-centric distance of the Sun, and in the Galactic plane, that would be on a circular orbit in the gravitational potential of the Galaxy. We can attribute , and velocity components of the Sun relative to this hypothetical star by observing the kinematic distribution function of stars at the solar neighbourhood, provided the stellar comparison sample we use is in dynamical equilibrium. We can similarly test the equilibrium state of stellar populations by comparing their deduced solar peculiar motion, or equivalently their mean motion relative to a LSR. One may wonder if the kinematically cold thin disc stars feel a large asymmetric gravitational potential from, perhaps, an inner Galactic bar. Do spiral arms have systematic kinematic effects visible in young stars? Is the LSR defined by the high velocity halo stars, which feel largely extended dark matter potentials, the same as that of thick disc stars, and thin disc stars? These questions essentially repeat a query on the closeness of the higher-order Oort Constants to zero, for all Galactic components.
The significance is such one wishes to determine the “solar peculiar velocity” for many samples, using several techniques. Doing this (see Table 1 above for a list) has led, in general to determinations of the peculiar motion radially outwards from the Galactic centre which are consistent and small, independent of the comparison sample chosen. Every stellar sub-population in the Galaxy seems remarkably radially stable and circularly symmetric, with no evidence for bar-like perturbations. Similarly, doing this for the net vertical motion, provides the same conclusion. The sky fails to fall (see also Seabroke et al., 2008). The Galaxy, locally, seems not be significantly affected by an accreted stellar system, or asymmetric mass infall. The situation is less clear in the rotational direction, . Here, there is less agreement between determinations, largely since model dependent assumptions need to be made to correct kinematics for energy balance, which transfers angular momentum systematically into random motions with time. This may happen by slow diffusion, or by more dramatic radially-dependent effects. The relevant way forward is to determine as a function of as many definable “populations” as is feasible, in many ways. We follow that approach here, where we find, in agreement with several recent studies, a value of near 13 km s-1. We determine this value with respect to three sub-groups of local main-sequence stars. These groups cover a very wide range of stellar ages. Yet they agree, statistically, with each other, and with other determinations based on more local samples. The concept of a LSR again seems well-defined.
We study stars which are thin disc dwarfs like the Sun. We expect a dispersion in the distribution of the velocity components due to their inherent distributions and differences between the same velocity components of sample stars of different population types and ages. The way to reveal the corresponding velocity component is to fit the space motion data to a suitable distribution function. Encouragingly, a simple Gaussian provides an excellent approximation so we can identify the mean solar motion with its mode. This is the procedure we used in this work.
The star sample was taken from RAVE, which extends much beyond the distance of the high-precision local Hipparcos sample, i.e. 97% of the sample lies within the distance interval 00.6 kpc. We applied the following constraints to obtain a main sequence sample with relatively small errors: i) we selected stars with surface gravity 45, ii) we omitted stars with 0.05 and 0.55 to avoid blue horizontal branch and red giant stars, iii) we excluded stars with space velocity errors larger than 25 km s-1, iv) we separated stars probabilistically according to their population types, and we used the high-probability thin disc sample to minimize contamination by thick disc/halo stars as a preferred sample in our work. We estimated solar space velocity components for five samples: for all our RAVE main sequence stars; for the sub-sample of high-probability thin disc main sequence stars; and separately for the thin disc main sequence stars of F, G and K spectral types. The results (see Table 3 above) are consistent, within sampling errors, across all sub-samples. They are also in agreement with recent determinations using other population subsamples, and over very different ranges. There is increasing agreement that the solar peculiar velocity in the rotation direction has been underestimated in older studies. The internal agreement between our different samples, and between this study and others, provides evidence that the Galactic potential near the Sun is symmetric, with no evident time dependent variation.
8 Acknowledgments
We thank the anonymous referee for his/her comments. Funding for RAVE has been provided by: the Australian Astronomical Observatory, the Astrophysical Institute Potsdam, the Australian National University, the Australian Research Council, the French National Research Agency, the German Research Foundation, the Istituto Nazionale di Astrofisica at Padova, The Johns Hopkins University, the W.M. Keck Foundation, the Macquarie University, the Netherlands Research School for Astronomy, the Natural Sciences and Engineering Research Council of Canada, the Slovenian Research Agency, the Swiss National Science Foundation, the Science & Technology Facilities Council of the UK, Opticon, Strasbourg Observatory, and the Universities of Groningen, Heidelberg, and Sydney.
This work has been supported in part by the Scientific and Technological Research Council (TÜBİTAK) 108T613. Salih Karaali is grateful to the Beykent University for financial support. This publication makes use of data products from the Two Micron All Sky Survey, which is a joint project of the University of Massachusetts and the Infrared Processing and Analysis Center/California Institute of Technology, funded by the National Aeronautics and Space Administration and the National Science Foundation.
This research has made use of the SIMBAD, NASA’s Astrophysics Data System Bibliographic Services and the NASA/IPAC ExtraGalactic Database (NED) which is operated by the Jet Propulsion Laboratory, California Institute of Technology, under contract with the National Aeronautics and Space Administration.
References
- Bahcall & Soneira (1980) Bahcall J. N., Soneira R. M., 1980, ApJS, 44, 73
- Bensby et al. (2003) Bensby T., Feltzing S., Lundström I., 2003, A&A 410, 527
- Bensby et al. (2005) Bensby T., Feltzing S., Lundström I., Ilyin I., 2005, A&A, 433, 185
- Bilir et al. (2006) Bilir S., Karaali S., Gilmore G., 2006, MNRAS, 366, 1295
- Bilir et al. (2008) Bilir S., Karaali S., Ak S., Yaz E., Cabrera-Lavers A., Coşkunoğlu K. B., 2008, MNRAS, 390, 1569
- Binney & Tremaine (1987) Binney J. J., Tremaine S., 1987, Galactic Dynamics, Princeton Univ. Press, Princeton
- Binney et al. (1997) Binney J. J., Dehnen W., Houk N., Murray C. A., Penston M. J., 1997, ESASP, 402, 473
- Binney (2010) Binney J. J., 2010, MNRAS, 401, 2318
- Bobylev & Bajkova (2007) Bobylev V. V., Bajkova A. T., 2007, ARep, 51, 372
- Bobylev & Bajkova (2010) Bobylev V. V., Bajkova A. T., 2010, MNRAS, 408, 1788
- Breddels et al. (2010) Breddels M. A., et al., 2010, A&A, 511, 90
- Buser et al. (1999) Buser R., Rong J., Karaali S., 1999, A&A, 348, 98
- Cutri et al. (2003) Cutri R. M., et al., 2003, 2MASS All-Sky Catalogue of Point Sources, CDS/ADC Electronic Catalogues, 2246
- Dehnen & Binney (1998) Dehnen W., Binney J. J., 1998, MNRAS, 298, 387
- Dinescu et al. (1999) Dinescu D. I., Girard T. M., van Altena W. F., 1999, AJ, 117, 1792
- ESA (1997) ESA, 1997, The Hipparcos and Tycho Catalogues, ESA SP-1200. ESA, Noordwijk
- Fellhauer et al. (2008) Fellhauer M., Wilkinson M. I., Evans N. W., Belokurov V., Irwin M. J., Gilmore G., Zucker D. B., Kleyna J. T., 2008, MNRAS, 385, 1095
- Fiorucci & Munari (2003) Fiorucci M., Munari U., 2003, A&A, 401, 781
- Francis & Anderson (2009) Francis C., Anderson E., 2009, NewA, 14, 615
- Gilmore, Wyse & Kuijken (1989) Gilmore G., Wyse R. F. G. & Kuijken K., 1989, ARAA, 27, 555
- Hernquist (1990) Hernquist L., 1990, ApJ, 356, 359
- Homann (1886) Homann H., 1886, AN, 114, 25
- Jenkins (1992) Jenkins A., 1992, MNRAS, 257, 620
- Johnson & Soderblom (1987) Johnson D. R. H., Soderblom D. R., 1987, AJ, 93, 864
- Johnston et al. (1995) Johnston K. V., Spergel D. N., Hernquist L., 1995, ApJ, 451, 598
- Katz et al. (2004) Katz D., et al., 2004, MNRAS, 354, 1223
- Marshall et al. (2006) Marshall D. J., Robin A. C., Reylé C., Schultheis M., Picaud S., 2006, A&A, 453, 635
- McMillan & Binney (2010) McMillan P., Binney J., 2010, MNRAS, 402, 934
- Mignard (2000) Mignard F., 2000, A&A, 354, 522
- Mihalas & Binney (1981) Mihalas D., Binney J., 1981, Galactic Astronomy: Structure and Kinematics, 2nd edition
- Munari (2003) Munari U., 2003, ASPC, 298
- Pasetto et al. (2010) Pasetto S., Grebel E., Bienaymé O., and the RAVE Collaboration, 2010, A&A (submitted)
- Pickles (1998) Pickles A. J., 1998, PASP, 110, 863
- Piskunov et al. (2006) Piskunov A. E., Kharchenko N. V., Röser S., Schilbach E., Scholz R.-D., 2006, A&A, 445, 545
- Reid et al. (2009) Reid M. J., et al., 2009, ApJ, 700, 137
- Robin et al. (1996) Robin A. C., Haywood M., Créze M., Ojha D. K., Bienaymé O., 1996, A&A, 305, 125
- Rygl et al. (2010) Rygl K. L. J., Brunthaler A., Reid M. J., Menten K. M., van Langevelde H. J., Xu, Y., 2010, A&A, 511A, 2
- Schlegel et al. (1998) Schlegel D. J., Finkbeiner D. P., Davis M., 1998, ApJ, 500, 525
- Schönrich et al. (2010) Schönrich R., Binney J., Dehnen W., 2010, MNRAS, 403, 1829
- Seabroke et al. (2008) Seabroke G. M., Gilmore G., and the RAVE Collaboration, 2008, MNRAS, 384, 11
- Skrutskie et al. (2006) Skrutskie M. F., et al., 2006, AJ, 131, 1163
- Steinmetz et al. (2006) Steinmetz M., et al., 2006, AJ, 132, 1645
- Strömberg (1946) Strömberg G., 1946, ApJ, 104, 12
- van Leeuwen (2007) van Leeuwen F., 2007, A&A, 474, 653
- Vidojevic & Ninkovic (2009) Vidojevic S., Ninkovic S., 2009, AN, 330, 46
- Wilkinson et al. (2005) Wilkinson M. I., et al., 2005, MNRAS, 359, 1306
- Zwitter et al. (2008) Zwitter T., et al., 2008, AJ, 136, 421