1-6
3D numerical MHD modeling of sunspots with radiation transport
Abstract
Sunspot fine structure has been modeled in the past by a combination of idealized magneto-convection simulations and simplified models that prescribe the magnetic field and flow structure to a large degree. Advancement in numerical methods and computing power has enabled recently 3D radiative MHD simulations of entire sunspots with sufficient resolution to address details of umbral dots and penumbral filaments. After a brief review of recent developments we focus on the magneto-convective processes responsible for the complicated magnetic structure of the penumbra and the mechanisms leading to the driving of strong horizontal outflows in the penumbra (Evershed effect). The bulk of energy and mass is transported on scales smaller than the radial extent of the penumbra. Strong horizontal outflows in the sunspot penumbra result from a redistribution of kinetic energy preferring flows along the filaments. This redistribution is facilitated primarily through the Lorentz force, while horizontal pressure gradients play only a minor role. The Evershed flow is strongly magnetized: While we see a strong reduction of the vertical field, the horizontal field component is enhanced within filaments.
keywords:
MHD – radiative transfer – Sun: sunspots – Sun: photosphere – Sun: magnetic fields1 Introduction
Sun and starspots play a central role for our understanding of solar and stellar magnetism. Since direct observations of magnetic field in stellar convection zones are very limited (e.g. helioseismic inversions), sun and starspots provide a window to understand the magnetism of stellar interiors, provided we understand in detail how starspots form, evolve and decay. Sunspots are a multi scale problem with respect to spatial and temporal scales. While their typical size is Mm, fine structure is observed at the smallest scales currently observable of about km (e.g. high resolution ground based observations with the SST, Scharmer et al. (2002), or space based observations with HINODE, see e.g. Ichimoto et al. (2007)). Properly resolving the scales currently observed requires grid resolutions of km or less. Details of the penumbra evolve over time scales of hours, while the life time of sunspots and the evolution of the adjacent moat happens on time scales of days to weeks. On the other hand typical numerical time steps are of the order of sec (assuming already that the very fast Alfvén velocities found above a sunspot umbra were removed from the system, see e.g. appendix of Rempel et al. (2009a)). As a consequence a well resolved realistic numerical simulation of an entire sunspot requires billions of grid points and hundred thousands of time steps. Since the essential physics that need to be considered (MHD, 3D radiative transfer, realistic equation of state) are well known and have been included in MHD codes for more than 2 decades, the primary challenge for addressing sunspot structure is linked to robust efficient numerical schemes and availability of powerful computing resources. The latter became finally available on the scale needed, which allowed for substantial progress within a time frame of only a few years. In the following sections we will very briefly summarize recent progress and a few aspects of sunspot structure for which numerical simulations provided substantial insight.
2 Recent developments
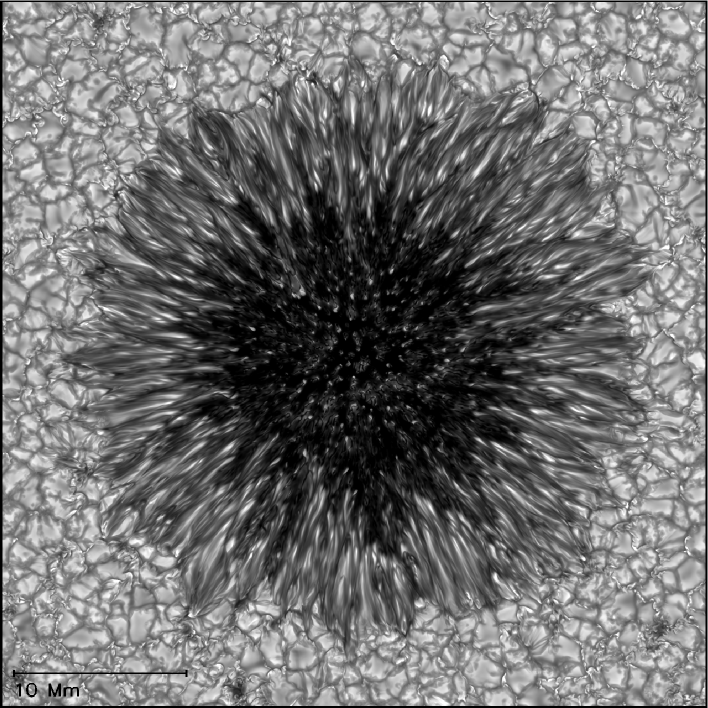
We limit the following discussion entirely to MHD simulations that include 3D radiative transfer and a realistic equation of state. Here, progress in applications related to sunspots started with the work by Schüssler & Vögler (2006) who presented a MHD simulation of a sunspot umbra showing the development of magneto-convection in form of umbral dots. The simulation revealed that almost field free upflow plumes can form within an initially monolithic umbra and transport energy through overturning convection. Heinemann et al. (2007) focused on a narrow slab through the center of sunspot. Their setup allowed to model the transition from umbra toward penumbra and granulation, while keeping the computational expense at a moderate level. Their simulation showed the formation of short filaments with dark lanes at the umbra/granulation interface, however, umbral dots were not present. The filaments were propagating inward during the formation phase and showed outflow along their axis. Based on this simulation Scharmer et al. (2008) interpreted the Evershed flow as convective flow component along filaments. In a very similar setup with an initially larger segment of a sunspot Rempel et al. (2009a) were able to produce umbral dots and filaments of about Mm length, showing the smooth transition from central to peripheral umbral dots and filaments in the inner penumbra. The latter show the presence of a bright head propagating inward and detaching from the filament during the formation phase and up to Mm long dark lanes with evidence of twisting motions. Along filaments, outflows of a few km/s were present, and on a larger scale a moat flow, previously also reported in Heinemann et al. (2007). Overall these simulations clearly stress the common magneto-convective origin of umbral dots and penumbral filaments, but a realistic outer penumbra with strong outflows was not present. Kitiashvili et al. (2009) conducted a study of how the magnetic field strength and inclination angle influence the formation of horizontal flows in magneto-convection. Fast flows with mean amplitudes of km/sec were found for a kG field with inclination angle of degrees. The first comprehensive simulation of entire sunspots was presented by Rempel et al. (2009b). Using a setup including a pair of opposite polarity sunspots in a Mm wide and Mm deep domain, this simulation showed the formation of extended (up to Mm wide) penumbrae with horizontal outflows of up to km/sec mean- and km/sec peak flow speeds. At the same time this simulation contained umbral dots and a substantial moat region, connecting all the aspects of sunspot fine structure in one comprehensive simulation run. While the penumbra contained radially elongated convection cells, the intensity image (see Fig. 1 in Rempel et al. (2009b)) did not yet show the typical radial structure of narrow filaments known from observations. The currently best resolved sunspot simulation is presented in Fig. 1. Compared to Rempel et al. (2009b) the horizontal resolution is doubled (from to km), while the vertical resolution is increased from to km, leading to a total grid size of for a domain of the size Mm. Here we focused again on a single spot, but artificially enhanced the field inclination through the top boundary condition to generate conditions that are comparable to the region in between the opposite polarity spots of Rempel et al. (2009b). While the photospheric appearance of the sunspot is substantially improved compared to previous simulations, we did not find fundamental differences in the underlying magneto-convection process.
In the following section we highlight a few central aspects we learned from the simulations summarized above.
3 Magnetic fine structure of penumbra
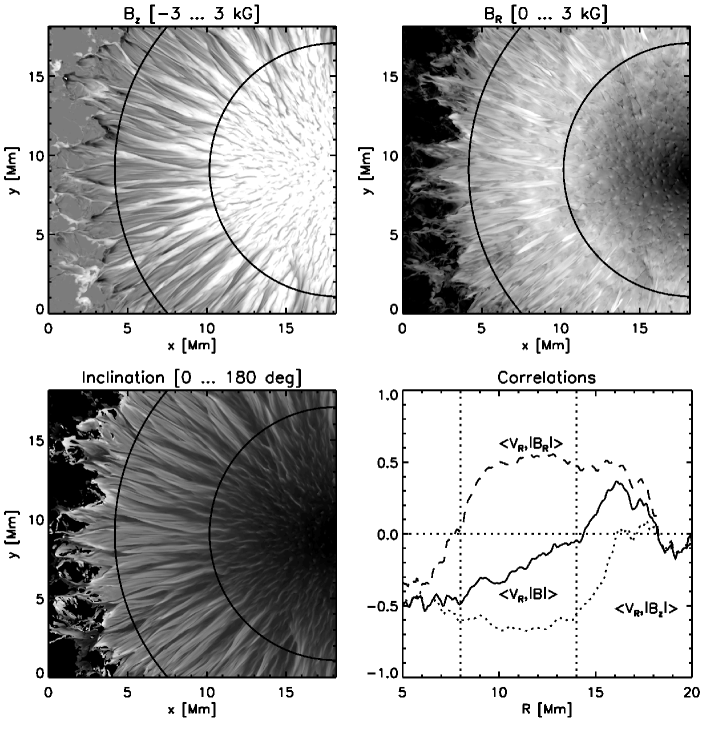
Figure 2 summarizes the magnetic fine structure of umbra and penumbra at the level for the simulation presented in Fig. 1. A common element in umbra and penumbra is a strong reduction of the vertical magnetic field component, which is associated with umbral dots, peripheral umbral dots and penumbral filaments. The horizontal magnetic field component shows a different behavior. A reduction of the horizontal field strength is only present in the umbra, whilst in the penumbra filaments (flow channels) have an enhanced horizontal magnetic field strength throughout, which is evident from the correlations shown in the bottom right panel of Fig. 2. The combination of reduced vertical and enhanced horizontal field leads to the observationally inferred interlocking comb structure with strong variation of the field inclination angle and strong horizontal flows in the component with nearly horizontal field (see e.g. Solanki (2003)) . The combined effect of the weakening of and strengthening of within flow channels results in an overall reduction of in the inner, and increase of in the outer, penumbra. Recently Ichimoto et al. (2007) found this trend in the observed correlation, even though positive values of the correlation were not observed. An Evershed flow in regions with enhanced field strength in the outer penumbra was proposed by Tritschler et al. (2007) based on zero-crossings of the NCP.
Overall the numerical simulation presented here supports a strongly magnetized penumbra and Evershed flow. While the underlying structure of the magneto-convection is well captured by the ”gappy” penumbra model of Scharmer & Spruit (2006) and Spruit & Scharmer (2006), we do not see any support for the claim that these gaps are close to field free. While the latter is a good approximation for the vertical field component alone, horizontal field is actually enhanced compared to the background field. Recently Rempel (2010) showed that the horizontal field originates from the strong subsurface shear profile of the Evershed flow, which leads to an induction term with a strength of about G/sec a few km beneath . Relative contributions from numerical magnetic diffusivity are only of a few percent. A recent convergence study (Rempel, in preparation) from up to km resolution (Fig. 1 presents the highest resolution case) strongly supports the robustness of this result.
4 Convective energy transport
All numerical simulations performed to date (most of them are summarized in Sect. 2) point toward a common magneto-convective origin of sunspot fine structure. Comparing the azimuthally averaged bolometric intensity and vertical RMS velocity at the level we find a relationship of the form , which holds very well from umbral dots to penumbral filaments and even granulation. From this we can conclude that the vertical RMS velocity in the inner penumbra with should be about half of the convective RMS velocity seen in granulation, i.e. it should be about km/sec instead of km/sec. This is, at least in a statistical sense, compatible with the findings reported in Franz & Schlichenmaier (2009), who found about m/s vertical RMS in the penumbra vs about km/sec RMS in the quiet sun. The shortfall by a factor of for both penumbra and quiet sun is due to the limited resolution of observations and the fact that the typically used spectral lines form at levels higher than .
We find throughout the penumbra an upflow filling factor in the range and most of the mass flux is turning over on scales significantly shorter than the radial extent of the penumbra. Only about of the total overturning mass flux (similarly also energy flux) is found in the azimuthal mean component (corresponding to an upflow of about m/s in the inner and downflow of up to m/s in the outer penumbra). The mass flux of the penumbra is balanced within the bounds of the penumbra.
The almost equal presence of up and downflows everywhere in the penumbra is currently not inferred from most observations (which see a preference of upflows in the inner and downflows in the outer penumbra) and might require even higher resolution. Without overturning motions on scales much shorter than the radial extent of the penumbra it would not be possible to maintain the observed brightness of about .
5 Origin of Evershed flow
Recently Rempel (2010) analyzed in detail the processes underlying the driving of the Evershed flow. To this end the contributions from acceleration, pressure, buoyancy and Lorentz forces in the kinetic energy equation were compared between the plage region (surrounding the sunspots) and the sunspot penumbra. In the plage region most of the pressure/buoyancy driving takes place in downflows and is in balance with vertical acceleration forces. Horizontal flows are driven by horizontal pressure gradients. In the penumbra the pressure/buoyancy driving is shifted into upflow regions and is there in balance with vertical Lorentz forces, while acceleration forces are unimportant. In the horizontal direction acceleration forces are in balance with the horizontal Lorentz force component, while horizontal pressure gradients do not play a major role throughout most of the penumbra. The Lorentz force facilitates the energy exchange between motions in the vertical and horizontal direction, while the net work done by Lorentz forces remains negative (sink of kinetic energy). Some aspects of this picture (pressure driving in upflows, deflection and guiding of motions by magnetic field) have been captured to some extent in simplified flux tube models such as Montesinos & Thomas (1997), Schlichenmaier et al. (1998b) and Schlichenmaier et al. (1998a). However, the presence of vigorous convection leads to a situation in which the outflowing mass is continuously replaced through upflows extending along filaments – a situation that is inherently opposite to the concept of a flux tube. Overall the Evershed flow is best characterized as convective flow (Scharmer et al., 2008), although, compared to field free convection, notable differences exist with respect to the underlying driving forces.
6 Conclusions
Numerical simulations have been advanced to the point where they provide a consistent and unifying picture of the magneto-convective processes underlying the energy transport, magnetic fine structure and origin of large scale flows in sunspots. The bulk of energy and mass is transported by overturning convection with scales substantially shorter than the radial extent of the penumbra. The filamentation of the penumbra and the driving of large scale outflows is strongly linked to the presence of anisotropic convective flows. We find the above picture being converged with respect to numerical resolution. We explored the range from km to km and found that most aspects are already well described with km resolution. For the currently accessible resolution range, flows within filaments are mostly laminar; whether a possible transition to turbulent flows at higher resolution could change results remains an open question (due to the rather strong magnetic field turbulence might remain suppressed even at higher resolutions than currently affordable). Initial state and boundary conditions at top and bottom have a strong influence on the global magnetic structure and stability (i.e. they can make the difference between having or not having a penumbra), however the details of sunspot fine structure as discussed here are influenced to a much lesser degree. While the overall radial extent of the penumbra is subject to boundary conditions, the details of filamentation, energy transport, and driving mechanism of the Evershed flow are not.
Acknowledgements.
The National Center for Atmospheric Research is sponsored by the National Science Foundation. Computing time was provided by the National Center for Atmospheric Research, the Texas Advanced Computing Center (TACC), the National Institute for Computational Sciences (NICS) and the NASA High End Computing Program.References
- Franz & Schlichenmaier (2009) Franz, M. & Schlichenmaier, R. 2009, A&A, 508, 1453
- Heinemann et al. (2007) Heinemann, T., Nordlund, Å., Scharmer, G. B., & Spruit, H. C. 2007, ApJ, 669, 1390
- Ichimoto et al. (2007) Ichimoto, K., Shine, R. A., Lites, B., Kubo, M., Shimizu, T., Suematsu, Y., Tsuneta, S., Katsukawa, Y., Tarbell, T. D., Title, A. M., Nagata, S., Yokoyama, T., & Shimojo, M. 2007, PASJ, 59, 593
- Kitiashvili et al. (2009) Kitiashvili, I. N., Kosovichev, A. G., Wray, A. A., & Mansour, N. N. 2009, ApJ, 700, L178
- Montesinos & Thomas (1997) Montesinos, B. & Thomas, J. H. 1997, Nature, 390, 485
- Rempel (2010) Rempel, M. 2010, ApJ, submitted
- Rempel et al. (2009a) Rempel, M., Schüssler, M., & Knölker, M. 2009a, ApJ, 691, 640
- Rempel et al. (2009b) Rempel, M., Schüssler, M., Cameron, R. H., & Knölker, M. 2009b, Science, 325, 171
- Scharmer et al. (2002) Scharmer, G. B., Gudiksen, B. V., Kiselman, D., Löfdahl, M. G., & Rouppe van der Voort, L. H. M. 2002, Nature, 420, 151
- Scharmer et al. (2008) Scharmer, G. B., Nordlund, Å., & Heinemann, T. 2008, ApJ, 677, L149
- Scharmer & Spruit (2006) Scharmer, G. B. & Spruit, H. C. 2006, A&A, 460, 605
- Schlichenmaier et al. (1998a) Schlichenmaier, R., Jahn, K., & Schmidt, H. U. 1998a, ApJ, 493, L121
- Schlichenmaier et al. (1998b) —. 1998b, A&A, 337, 897
- Schüssler & Vögler (2006) Schüssler, M. & Vögler, A. 2006, ApJ, 641, L73
- Solanki (2003) Solanki, S. K. 2003, A&A Rev., 11, 153
- Spruit & Scharmer (2006) Spruit, H. C. & Scharmer, G. B. 2006, A&A, 447, 343
- Tritschler et al. (2007) Tritschler, A., Müller, D. A. N., Schlichenmaier, R., & Hagenaar, H. J. 2007, ApJ, 671, L85