Importance of Fermi surface topology for high temperature superconductivity in electron-doped iron arsenic superconductors
Abstract
We used angle resolved photoemission spectroscopy and thermoelectric power to study the poorly explored, highly overdoped side of the phase diagram of Ba(Fe1-xCox)2As2 high temperature superconductor. Our data demonstrate that several Lifshitz transitions - topological changes of the Fermi surface - occur for large . starts to decrease with doping when the cylindrical, central hole pocket changes to ellipsoids centering at the point, and goes to zero before these ellipsoids disappear around . Changes in thermoelectric power occur at similar -values. Beyond this doping level the central pocket changes to electron-like and superconductivity does not exist. Our observations reveal the crucial importance of the underlying Fermiology in this class of materials. A necessary condition for superconductivity is the presence of the central hole pockets rather than perfect nesting between central and corner pockets.
pacs:
79.60.-i, 74.25.Jb, 74.70.DdThe phase diagrams of the newly-discovered iron arsenic superconductors contain a number of intriguing features. For the electron-doped (Fe)2As2 series (122, = Ca, Sr, Ba; = Co, Ni, Pd, etc.), superconductivity is found in both regions with and without a long-range antiferromagnetic (AFM) order NiNiCo ; Fisher ; Ning ; Fang ; Nandi ; Canfield ; Canfield_Review . The superconducting (SC) region extends to different doping levels for different dopants, but scales very well if the horizontal axis of the phase diagram was chosen to be the number of extra electrons Canfield ; Canfield_Review . It is therefore likely that changes in the underlying electronic structure due to electron doping are linked closely to their SC behavior. On the underdoped side, a recent angle-resolved photoemission spectroscopy (ARPES) study on Ba(Fe1-xCox)2As2 ChangNPhys revealed that superconductivity emerges at a doping level () where a topological change of the Fermi surface (Lifshitz transition Lifshitz at doping ) reduces the magnetically reconstructed Fermi surface to its paramagnetic appearance, i.e. . This transition exhibits itself as a rapid change of Hall coefficient and thermoelectric power (TEP) in transport measurements Mun . An immediate question is whether a similar change of Fermiology causes the collapse of the SC dome on the heavily overdoped regime. It is inevitable that the hole pockets surrounding the central axis of the Brillouin zone (-) will shrink in size and vanish at some higher doping . The question is whether this Lifshitz transition correlates with the offset of superconductivity on the overdoped side of the phase diagram (). Based on a solution of the two-band BCS gap equations, assuming only interband coupling, Fernandes and Schmalian Reafel_new showed that the disappearance of superconductivity is directly linked to the vanishing of the central hole pocket(s), i.e. . Experimentally, the Hall coefficient vs. doping on Ba(Fe1-xCox)2As2 Fang experiences a slight change of slope around , hinting at a possible Lifshitz transition close to the high doping offset of superconductivity.
In this Letter we study this issue in detail using ARPES and TEP measurements. We performed a complete survey of the electronic structure on the overdoped part of the phase diagram of this material. This survey reveals that topological changes of the Fermi surface link directly to superconductivity in electron-doped pnictides. In the overdoped side, superconducting transition temperature starts to be suppressed around the doping level () where the cylindrical hole pocket surrounding the zone center (-) changes to ellipsoids centering at . is driven to zero before the disappearance of -ellipsoids and the change in TEP at . In short, we find that . Our data demonstrated that superconductivity in the pnictides is very robust with respect to doping; the whole Fermi sheet has to be almost completely eliminated in order to drive to zero. A necessary condition for superconductivity then is the existence of the central hole pockets rather than a perfect nesting between the and pockets Terashima . The dominant contribution to the pairing interaction is believed to come from inter-band coupling Reafel_new .
Single crystals of Ba(Fe1-xCox)2As2 were grown out of a self-flux using conventional high-temperature solution growth techniques NiNiCo . The doping level was determined using wavelength dispersive X-ray spectroscopy in a JEOL JXA-8200 electron microprobe NiNiCo . Long range antiferromagnetism was observed below a transition temperature up to . Superconductivity appears around and vanishes between (see Fig. 4) Canfield_Review . The ARPES measurements were performed at beamline 10.0.1 of the Advanced Light Source (ALS), Berkeley, California using a Scienta R4000 electron analyzer. Vacuum conditions were better than torr. The energy resolution was set at meV. All samples were cleaved in situ yielding mirror-like, fresh - surfaces. High symmetry points were defined the same way as in Ref. ChangNPhys . TEP measurements were made as described in Ref. Mun .
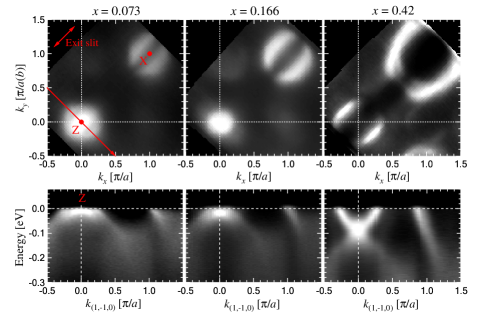
Fig. 1 shows the ARPES Fermi maps and corresponding band dispersion data for three different doping levels of Ba(Fe1-xCox)2As2 direction . The incident photon energy is eV, corresponding to , the upper edge of the first Brillouin zone () Takeshi_nesting . From data in Fig. 1 it is clear that, as electron doping initially increases, the Fermi contours around shrink in size. At , the edge of the SC dome, the -pocket shrinks to almost a single point, meaning a complete vanishing of the hole pocket. This observation is consistent with the data in Refs. ChangNPhys ; Sekiba ; Brouet . As increases, the pocket expends again, yielding a diamond shape at . Band dispersion clearly reveals that this “diamond” is electron-like. Such an electron pocket is not predicted by band structure calculations Fang . The pocket, on the other hand, keeps expanding from to , and it remains electron-like. The central message of this figure is that the -pocket undergoes a drastic topological change from hole-like to electron-like at roughly the doping level where superconductivity vanishes. Based on this observation we perform two independent data analysis procedures with finer doping steps to further pinpoint the doping level at which the Lifshitz transition takes place.
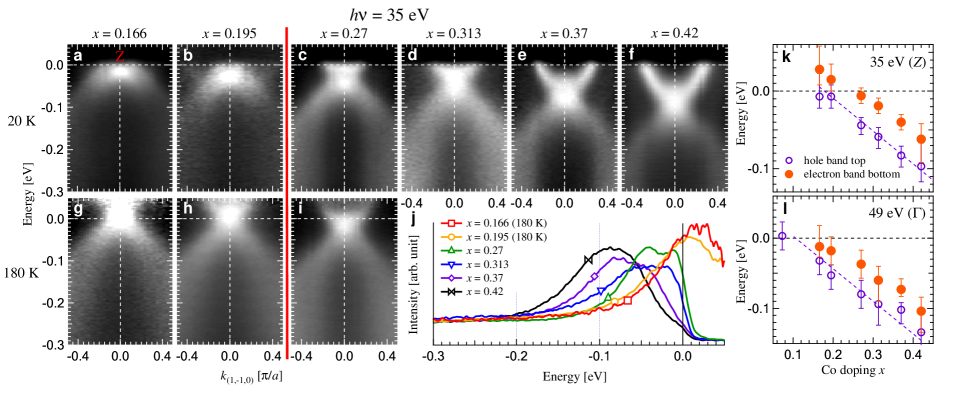
First, to obtain a more accurate value for , we extract the energies for the hole band top and the electron band bottom at the zone center, and examine them as a function of cobalt doping. As shown in Fig. 2, we plot the band dispersion maps along the same direction as in Fig. 1 for six different doping levels ranging from to , and use the energy distribution curves (EDCs) in Fig. 2(j) Temp to see that both the hole band and the electron band shift to higher binding energies as increases. The shape of these bands remain the same during the process. There is a small gap ( meV) between these two bands. At the bottom of the electron band moves above the Fermi level, as revealed in Fig. 2(k) where two Lorentzians are fitted to the data from Fig. 2(j). At a slightly lower doping level the top of the hole pocket also moves above . Figs. 2(a)-(k) illustrate that, at the point of the Brillouin zone, the Lifshitz transition takes place between , higher than .
The intrinsic three dimensionality of the electronic structure ChangLiu_3D ; Vilmercati results in different values for different . In Fig. 2(l) we investigate this effect by performing the same analysis to the data taken with 49 eV photons (raw data not shown). This incident photon energy corresponds to , the central point of the Brillouin zone (). We see that indeed the Lifshitz transition shifts to a lower doping, i.e. . We note that this is the doping level where starts to decrease in the phase diagram. This observation also supports the theoretical prediction that three dimensionality of the Fermi surface leads to a more gradual decrease of in the overdoped side Reafel_new .
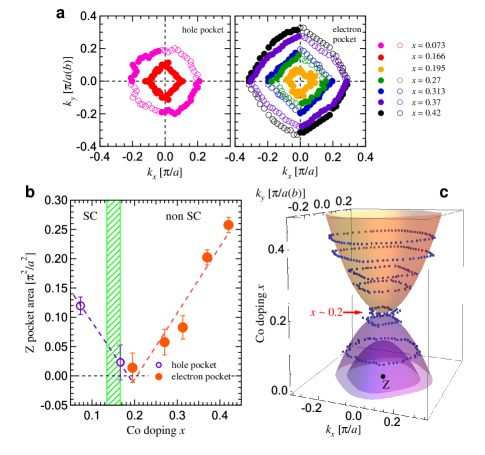
In Fig. 3 we perform a pocket size analysis at to further pinpoint . This second procedure is independent from the above energy extraction method. To do this we first find the pocket location for seven doping levels (ranging from to ) by fitting the momentum distribution curves (MDCs) at the chemical potential with several Lorenzian functions. From Fig. 3(a) we see a clear evolution of the pocket size with doping. As increases, the hole pocket shrinks in size up to . Above this doping an electron pocket appears and increases in size up to the highest doping measured. As seen in Fig. 3(b), both the hole and electron pocket size evolves in a linear fashion, a signature of the validness of the rigid band shifting scenario Neupane , and of the pockets being paraboloids in shape. The cross-over takes place around . This Lifshitz transition is best visualized in Fig. 3(c) where data in Fig. 3(a) is plotted against the cobalt doping as a third dimension. This figure reveals that, as cobalt concentration increases, the Fermi sea level rises and the hole bands gradually drop below it. At the total occupation of the outer hole band marks the Lifshitz transition. Beyond this point the pocket changes to electron-like, and superconductivity vanishes.
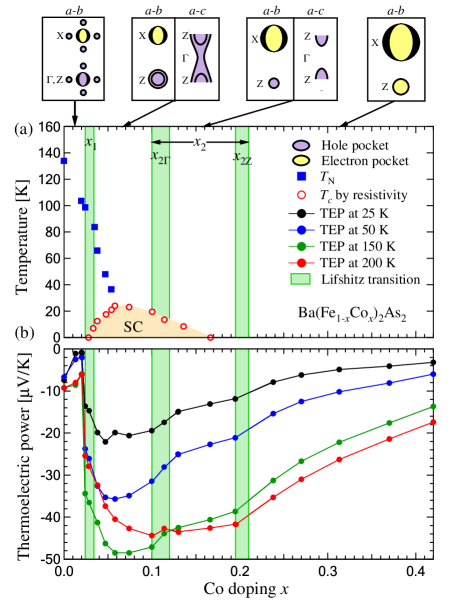
Fig. 4 summarizes our systematic ARPES survey on the Fermi surface topology of Ba(Fe1-xCox)2As2 for and compares it with TEP data over the same doping range. The most important finding of this study is that the low- and high-doping onset of the SC region link closely to topological changes of the Fermi surface. The first Lifshitz transition at the low doping onset of superconductivity is described in detail in Ref. ChangNPhys ; Mun . The second and third Lifshitz transitions occur for and correspond to the high doping onset of superconductivity. corresponds to the doping level where the shape of the quasi-cylindrical outer contour changes to an ellipsoid centering at . Also at the superconducting starts to suppress. As doping is increased, this ellipsoid shrinks in size until it disappear altogether at . On the other hand, superconductivity vanishes at . At , the region of the highest doping, the central pocket changes to electron-like, and superconductivity does not exist. Our TEP data, plotted as for several temperatures in Fig. 4(b), show clear step-like or change-of-slope anomalies at Co-concentrations that are in an excellent agreement with those at which the the Lifshitz transitions were detected by ARPES [Fig. 4(a)]. These results, taken together, confirm extreme sensitivity of TEP to the changes in FS topology Blanter .
Importantly, the above conclusion most likely also applies to other electron doped 122 systems. We are specially interested in A(Fe1-xNix)2As2 where each nickel atom gives two extra electrons per Fe site compared to one in the cobalt doped system Canfield_Review . There, similar to the cobalt doped system, the Hall coefficient and thermoelectric power anomaly occurs right at the onset of superconductivity ChangNPhys ; Butch . Based on a similar ARPES survey Ari we indeed find Lifshitz transitions at close vicinity to the boundaries of superconductivity, the only difference being that the corresponding doping levels are roughly one half as those of the cobalt system. As the phase diagram changes to vs. , the extra electron count, these two systems match perfectly.
Our findings have important implications on the nature of superconductivity of the pnictides. First, our observation reveals the crucial importance of the underlying Fermi surface topology: a necessary condition for the emergence of superconductivity is the existence of the non-reconstructed central hole pockets rather than a perfect nesting condition between the central and corner pockets. Superconductivity is not supported only when either one set of these pockets (central or corner) vanishes, changes its carrier nature or shows considerable reconstruction. Second, our results imply that the suppression of superconductivity on the underdoped side is related to the competition between the AFM and SC phases Canfield_Review , whereas on the overdoped side the disappearance of the central hole pocket plays a more important role than the decrease of the pairing interaction magnitude Reafel_new . Electron doped 122 systems are, therefore, clear examples of high temperature superconductors whose superconducting behavior is controlled primarily by the underlying Fermiology.
We thank Sung-Kwan Mo and Makoto Hashimoto for their grateful instrumental support at the ALS. Ames Laboratory was supported by the Department of Energy - Basic Energy Sciences under Contract No. DE-AC02-07CH11358. ALS is operated by the US DOE under Contract No. DE-AC03-76SF00098.
References
- (1) N. Ni et al., Phys. Rev. B 78, 214515 (2008).
- (2) J.-H. Chu, J. G. Analytis, C. Kucharczyk, and I. R. Fisher, Phys. Rev. B 79, 014506 (2009).
- (3) F. L. Ning et al., J. Phys. Soc. Jpn. 78, 013711 (2009).
- (4) L. Fang et al., Phys. Rev. B 80, 140508(R) (2009).
- (5) S. Nandi et al., Phys. Rev. Lett. 104, 057006 (2010).
- (6) P. C. Canfield et al., Phys. Rev. B 80, 060501(R) (2009).
- (7) P. C. Canfield and S. L. Bud’ko, Annu. Rev. Condens. Matter Phys. 1:11.1-11.24 (2010).
- (8) C. Liu et al., Nature Physics 6, 419 (2010).
- (9) I. M. Lifshitz, Sov. Phys. JETP 11, 1130 (1960).
- (10) E. D. Mun, S. L. Bud’ko, N. Ni, and P. C. Canfield, Phys. Rev. B 80, 054517 (2009).
- (11) K. Terashima et al., Proc. Natl. Acad. Sci. USA 106, 7330 (2009).
- (12) R. M. Fernandes and J. Schmalian, Phys. Rev. B 82, 014521 (2010).
- (13) Direction of the band dispersion maps is perpendicular to the exit-slit because the ARPES intensity of the electron pocket along the exit-slit direction is suppressed by the transition matrix element.
- (14) T. Kondo et al., Phys. Rev. B 81, 060507(R) (2010).
- (15) Y. Sekiba et al., New J. Phys. 11, 025020 (2009).
- (16) V. Brouet et al., Phys. Rev. B 80, 165115 (2009).
- (17) In Fig. 2(j) high temperature data divided by the Fermi function is used for and in order to better locate the band positions above .
- (18) C. Liu et al., Phys. Rev. Lett. 102, 167004 (2009).
- (19) P. Vilmercati et al., Phys. Rev. B 79, 220503(R) (2009).
- (20) M. Neupane et al., arXiv:1005.2966 (2010).
- (21) Y. M. Blanter, M. I. Kaganov, A. V. Pantsulaya, and A. A. Varlamov, Phys. Reports 245, 159 (1994).
- (22) N. P. Butch et al., Phys. Rev. B 81, 024518 (2010).
- (23) A. D. Palczewski et al., in preparation.