Hot-Dust-Poor Quasars in Mid-Infrared and Optically Selected Samples
Abstract
We show that the Hot-Dust-Poor (HDP) quasars, originally found in the X-ray selected XMM-COSMOS type 1 AGN sample, are just as common in two samples selected at optical/infrared wavelengths: the Richards et al. Spitzer/SDSS sample (), and the PG-quasar dominated sample of Elvis et al. (). The properties of the HDP quasars in these two samples are consistent with the XMM-COSMOS sample, except that, at the significance, a larger proportion of the HDP quasars in the Spitzer/SDSS sample have weak host galaxy contributions, probably due to the selection criteria used. Either the host-dust is destroyed (dynamically or by radiation), or is offset from the central black hole due to recoiling. Alternatively, the universality of HDP quasars in samples with different selection methods and the continuous distribution of dust covering factor in type 1 AGNs, suggest that the range of SEDs could be related to the range of tilts in warped fueling disks, as in the model of Lawrence and Elvis (2010), with HDP quasars having relatively small warps.
1 Introduction
Emission from hot ( 1500K) dust is so characteristic of AGNs and quasars (e.g. Suganuma et al. 2006) that the strong 1–3 emission from this dust has often been used to select AGN samples (e.g. Miley et al. 1985, Lacy et al. 2004, 2007, Stern et al. 2005, Donley et al. 2008).
However, we recently reported (Hao et al. 2010) that, for 6% (at ) to 20% (at ) of the quasars in the XMM-COSMOS type 1 AGN sample (Brusa et al. 2010; Elvis et al. 2011), their emission are two to four times weaker than typical type 1 AGN (e.g., Elvis et al. 1994), although they have normal optical ‘big-blue-bump’ slopes indicative of standard accretion disk emission. We dubbed these ‘hot-dust-poor’ (HDP) quasars. Their implied dust ‘torus’ covering factor is 2% to 30%, well below the 75% predicted by the unified model (e.g. Krolik & Begelman 1988). These sources lie at one extreme of the distribution of AGN SEDs found in the XMM-COSMOS sample. Their lack of hot dust emission uncovers a continuum that appears to be the continuation of the accretion disk, which implies a disk size of Schwarzschild radii, an order of magnitude beyond the gravitational instability radius.
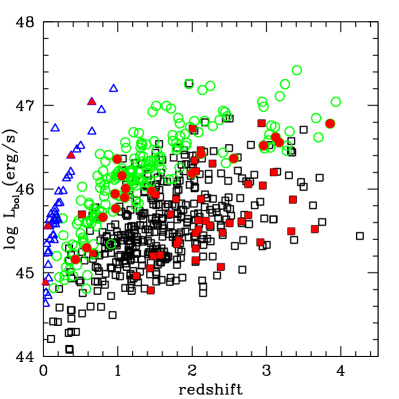
The study of Hao et al. (2010) used an X-ray selected sample. To check whether weak dust emission is a property of quasars in general, as opposed to X-ray selected quasars, in this paper we examine a large optical/infrared (IR) selected sample, that of Richards et al. (2006; hereafter R06). As shown in Figure 1, R06 also covers a different part of the luminosity/redshift (L,z) plane from the COSMOS-XMM sample, which will help us to test the preliminary claim of Hao et al. (2010) that the HDP fraction changes with redshift but not with luminosity. We also examine the Elvis et al. (1994) sample of low-redshift quasars (hereafter E94). Figure 1 shows that the three samples together have a good coverage of the (L,z) plane.
2 Type 1 AGN samples
Hao et al. (2010) selected HDP quasars by their position in a plot of optical (OPT, 0.3–1) versus near-infrared (NIR, 1–3) slopes. In this paper, we use the samples of R06 and E94 supplemented by new near-IR UKIDSS data, which gives good enough photometry to define these slopes.
2.1 R06 sample
The R06 sample consists of 259 Spitzer sources identified with SDSS quasars in four discrete degree-scale fields, and is, therefore, mid-IR and optically selected. We also considered the similar Hatziminaoglou et al. (2008) sample of 278 quasars and found that all but 65 are also in R06 and only 39 of these 65 have Spitzer photometry. We therefore only use R06. The redshift range covered is with 93% being at (Figure 1).
Most of the data in R06 paper is from SDSS, Spitzer, and 2MASS photometry. These data were not corrected for host galaxy contributions. As R06 is an IR and optically selected sample, the host galaxy contribution should typically be small. As the galaxy SED in the IR and optical is completely different from the typical quasar SED, and IR and optical color selection picks out sources with spectral indices similar to those of a typical quasar, sources with more galaxy contribution are selected against (e.g. Gregg et al. 2002, Richards et al. 2003). Most (215/259) of the R06 sources did not have 2MASS J H K photometry. These bands are essential to make reliable NIR slope estimates for quasars at , and to make reliable OPT slope estimates for quasars at . We therefore cross-matched the R06 sample with the UKIDSS database using the online WFCAM science archive. We found additional data for 98 quasars at K and for 45 quasars at J, producing a final subset of 195 R06 quasars that we can use for this study.
The UKIDSS data come from the Deep Extragalactic Survey (DXS) fields covering the Lockman Hole and ELAIS-N1. The UKIDSS survey is defined in Lawrence et al (2007). It uses the UKIRT Wide Field Camera (WFCAM; Casali et al, 2007). The photometric system is described in Hewett et al (2006), and the calibration is described in Hodgkin et al. (2009). The pipeline processing and science archive are described in Irwin et al (2010, in prep) and Hambly et al (2008). The magnitudes we use here are “aper3” magnitudes, which come from a measurement through a 2 ′′ software aperture, corrected to a total magnitude using the point spread function measured in the field. We have not corrected these magnitudes for host galaxy contribution, but we could see that nearly all of these objects only have small extended source contribution, because the UKIDSS database provides a wide range of aperture magnitudes. The magnitudes we use come from stacked observations spreading over several years. From individual epochs, we can see that most of these quasars vary only by a small amount (0.05 mag) within the UKIDSS data, such that it does not seriously affect our analysis.
2.2 E94 sample
The E94 quasar sample consists of both optically-selected quasars from the bright quasar survey (BQS, PG, Schmidt & Green, 1983) and radio-selected (mainly 3C and PKS) quasars. These quasars were selected to have good signal-to-noise ratio Einstein X-ray observations and obtainable IUE UV spectra, hence E94 is biased towards X-ray bright and blue quasars. E94 contains 42 quasars in the redshift range , with 80% being at . The optical photometry were obtained at the FLWO (F. L. Whipple Observatory) 24 inch telescope within one week of the MMT FOGS (Faint Object Grism Spectrograph) observations. The NIR data were obtained with MMT and IRTF. More details on the observation can be found in Elvis et al. (1994). As E94 is mainly a local quasar sample, the E94 SEDs have been corrected for host galaxy contamination by subtracting the host galaxy template SED based on the Sbc galaxy model of Coleman, Wu & Weedman (1980). The normalization of the galaxy template was calculated by direct measurements of the host galaxy luminosities.
3 Mixing Diagram
To select HDP quasars, we use the mixing diagram technique of Hao et al. (2010), where we select objects that lie outside the region formed by mixing a typical quasar SED with a host galaxy SED, combined with reddening. We use the slope on either side of the 1m inflection point, which is where the black-body emission of the hottest dust rises above that of the accretion disk. We build the mixing diagram by plotting two rest frame slopes in versus space: () versus (Å). These slopes are derived from linear fits to the SEDs in these wavelength ranges. The errors on the slopes are the 1 standard error. We required that at least three photometry points are used to fit the slopes. 88% of R06 quasars have more than the minimum of three photometry points in the optical and 71% have more than three points in the near-infrared. The measurement error on the photometry is used in the fitting. For both R06 and E94, all these slopes are measured in the same rest frame wavelength range as the XMM-COSMOS sample.
The mixing diagram is equivalent to a color-color plot, but utilizes more photometric points and adapts well to a wide range of redshifts. The mixing diagram is more robust than the normal color-color plot, because it is less affected by one bad photometry point and is built in the rest frame without any need for assumptions about the intrinsic SED shape (k-correction).
3.1 Robustness of Linear Fitting
We performed two tests to check if the requirement to have three or more photometry band is adequate to ensure robust slope measurements.
- (1)
-
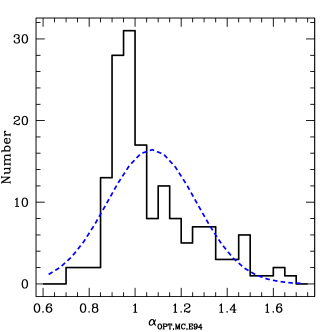
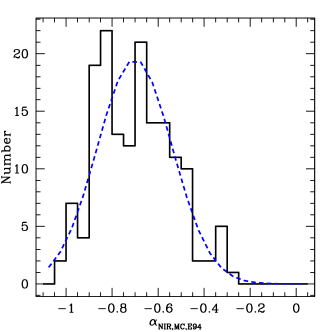
We use the E94 mean SED as a template. This SED has and . We made a Monte Carlo sampling of the E94 SED, with the same sampling and error bars as the observed SEDs for each R06 quasar. We then measured the simulated slopes, as we did for the observed ones. We show the histogram of the simulated slopes in Figure 2.
For the simulated optical slopes, the mean is (). The E94 optical slope () is within 1 of the mean value. However, when considering the errors () on each Monte Carlo optical slope, we find that only 75% of the simulated quasars lie within 3 of the E94 optical slope, implying significant outliers. In fact, a tail toward steep slopes is evident in Figure 2 (left). This tail is cause by the curvature in the E94 SED in the 0.3-1m range. The steepest part of E94 reaches a slope of between 0.3–0.45m (). If the simulated photometry points happen to lie only in this region, then the simulated slope will have a larger value than the calculated over the full 0.3-1m range. This is a limitation of using just the E94 template, which we will address next.
For the corresponding simulated infrared slopes, the mean is (). The E94 infrared slope () is within 1 of the mean value. When considering the errors () on each Monte Carlo infrared slope, we find that 91% of the simulated quasars lie within 3 of the E94 infrared slope. The histogram of the simulated infrared slopes shows two peaks. One peak is located at , which is the E94 infrared slope. The other peak is located at . As for the tail in , this second peak is due to curvature in the E94 SED in the 1-3m range. The steepest part of E94 reaches a slope of at 1.2–2.4m (). If the simulated photometry points happen to lie only in this region, the simulated slope will have a large value compared to the E94 infrared slope calculated over the full 1-3m range.
While the mean of the simulated slopes are same as the E94 values, the offsets are a cause of concern as they may falsely indicate an HDP object. Therefore, we performed a second Monte Carlo test using the measured slopes of the COSMOS sources with good photometry coverage. This method avoids the systematic errors from using a single template SED.
- (2)
-
To test if the slope measurement is robust for the range of SED shapes seen in the XMM-COSMOS type 1 AGN sample, we used the XMM-COSMOS SEDs as the template SEDs. The photometry coverage for these SEDs is rich in the NIR to OPT range, giving robust slope measurements (Elvis et al. 2011, Hao et al. 2010).
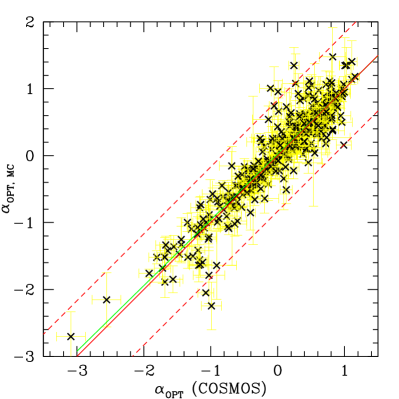
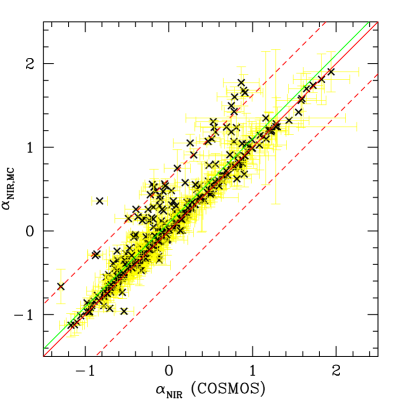
We selected 398 (97%) XMM-COSMOS type 1 AGNs, that lie within of a corresponding quasar in R06 sample. We used these 398 quasars to perform a Monte Carlo sampling, matching the photometry and error bars to those observed in the corresponding R06 quasar. We then measured the resulting and , and compared them with the original measurements from COSMOS. The results are shown in Figure 3. A linear fit to versus has a slope of 0.980.0004. The linear fit of versus has a slope of 1.0050.0003. Both slopes are very close to 1. However there are outliers that emulate HDP quasars.
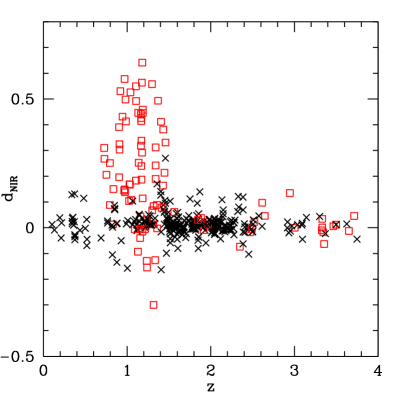
To investigate these outliers, we defined the distance of each data point to the equal slope line as where . A positive value means that the point lies above the equal slope line. For the simulated optical slopes, the mean of is 0.015 (), consistent with 0 in . For the simulated near-infrared slopes, the mean of is 0.067 (), consistent with 0 in .
We use these to isolate 16 sources that lie outside the lines (red dashed lines), 4% of the total sample. These sources have 3 points in the NIR slope estimation and at redshift (see example in Figure 6, right). We plotted the versus redshift, shown in Figure 4. For an E94-like SED shape, the three IRAC bands in this redshift range would lie at m, in the upper part of the infrared bump. The lack of a K band measurement would then lead to a larger slope estimate. For galaxy-like SED shape in this redshift range, lack of K band would lead to a much smaller slope estimate. For a mixing of E94 and galaxy SED, which is quite flat, the lacking of K band will not affect the slope measurement. The total number of simulated sources with 3 points in the NIR slope estimation is 95. Thus for the majority (83%) of the sources with 3 photometry points in the NIR slope estimation, the slope estimates are still robust.
In all, for the 96% simulated sources with 3 or more photometry points in NIR, the slope estimation is robust. The NIR slope estimate is not quite reliable for sources with only 3 photometry points and at redshift .
In general, for majority of quasars in R06 sample, the slope measurement we applied is robust for E94 like SED shape or a variety of SED shapes as in XMM-COSMOS sample, even for quasars with limited photometry coverage as in R06. Figure 4 also shows that the systematic error on is 0.07 for sources using 4 or more photometry points, which is small compared to the measurment errors. For sources using only 3 photometry points in the redshift range 0.92–1.3, the systematic error on is 0.3, which is comparable in some cases to the measurement errors. We added this errors to the measurement error when plotting the mixing diagram of R06.
3.2 Corrections to the SED
We need to consider the following several factors, which might affect the measurement of the slopes.
3.2.1 Emission Lines
The major emission lines in the rest frame wavelength range are the Balmer series, the Paschen series, and the Fe II complex. As the photometry points in the SED are all broad-band, even for the strongest line, H (mean equivalent width 257Å for SDSS DR6 quasars, Elvis et al. 2011), the upward bias of the observed photometry from the continuum reaches only 0.1 dex in the z band (filter FWHM=1000Å). For weaker lines, such as H and Fe II, the bias would be 0.02 dex, which is negligible for the slope measurements reported here. For consistency, we correct the R06 photometry for the emission lines as we did for the XMM-COSMOS sample (Elvis et al. 2011).
For the E94 sample, the emission line contribution has already been corrected for in the reported SEDs (details in Elvis et al. 1994).
3.2.2 Variability
Most AGNs vary in their optical continuum flux by 10% on timescales of months to years (Vanden Berk et al. 2004). The photometry used to build the SEDs in the R06 sample were taken over different time periods, which may affect the estimation of slopes.
For the R06 sample, the IRAC detections were made around 2004 (Lacy et al. 2005, Surace et al. 2005). The SDSS-DR3 photometry including the optical SDSS bands were taken from 1998 to 2003 and the NIR 2MASS bands were taken from 1997 to 2001 (Schneider et al. 2005). The UKIDSS NIR photometry has been taken since 2005. We should be careful in using the UKIDSS data and the rest of the data to measure the slopes.
For the estimation, we need to consider sources in the following redshift ranges respectively:
-
1.
: only the IRAC bands lie in the 1–3m range. Thus the estimation is robust, for the 109 out of the 195 R06 quasars;
-
2.
: K and IRAC bands lie in the 1–3m range. 16 sources have UKIDSS K-band detection. In no case does the K-band point appear significantly discontinuous with the IRAC bands.
-
3.
: H, K and IRAC bands lie in the 1–3m range. 17 sources have 2MASS H band detections. 8 sources have UKIDSS K-band detection. In no case does the H-band and K-band point appear significant discontinuous with the IRAC bands.
-
4.
: All of the J, H, K and IRAC1 bands lie in the 1–3m range. 2 of the 3 sources at have UKIDSS J and K band detections. The SEDs of these 2 sources show no discontinuity in the SED to cause errors in the slope measurement.
We thus consider the estimates of to be robust.
For estimation, similarly, the 3 low redshift () sources have only the SDSS data in the 0.3–1m range. Thus for these quasars the estimation is robust. For sources at , only the J band and SDSS data lie in the range. 12 sources have UKIDSS J band detection, for which the effect of J band on the slope measurement is small. For the 109 high redshift () sources, the situation is more complicated, because the UKIDSS J K band and the SDSS or 2MASS H band could be in the 0.3–1m range. However, the effect of variability on the does not affect the selection of the HDP quasars, since the most significant difference of the HDP quasars from the normal quasars are the .
For the E94 sample, the optical and the ground-based IR data were generally obtained within about 1 month (Elvis et al. 1994), so that the variability does not affect the slope measurement in the optical and IR range used in the mixing diagram.
3.3 R06 and E94 Mixing Diagram
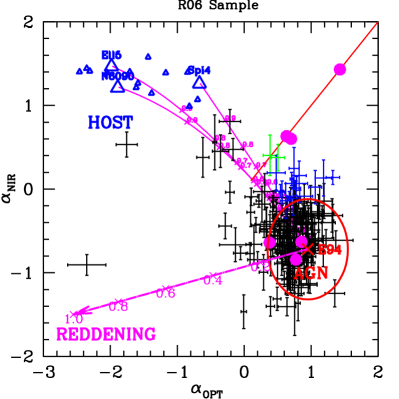
Figure 5 shows the Hao et al. (2010) “mixing diagram” for the R06 and E94 samples. For the sources that have galaxy fraction larger than 0.6 in the mixing diagram, we check the inferred host galaxy luminosity. Only one quasar in R06 sample has (-23.8) at m. Thus the inferred host luminosity is reasonable. There is clearly a continuous distribution of objects in , so to select quasars in the HDP region, we need to examine the dispersion in “normal” objects.
We consider all R06 quasars with in order to exclude the few galaxy- or reddening-dominated sources. They have mean slopes (standard deviation ), and (standard deviation ). The mean of the measurement error of is , which indicates the intrinsic dispersion is . The mean of the measurement error of is , which indicates the intrinsic dispersion is . The intrinsic dispersion of the SED shape is substantial.
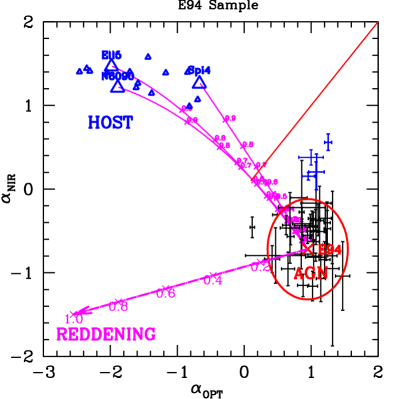
The E94 sources, which were corrected for host galaxy contribution, are, by construction, clustered around the E94 mean in the AGN-dominated region located at the bottom right corner of the mixing diagram. For the 42 E94 sources, the mean slopes are (standard deviation ) and (standard deviation ). The mean of the measurement error of is , which indicates the intrinsic dispersion is . The mean of the measurement error of is , which indicates the intrinsic dispersion is .
To compare the intrinsic dispersion of these two samples, we performed an F-test, ignoring the effects of the measurement error and assuming the intrinsic slope distribution is normally distributed. For , the F statistic is 1.09, and the cumulative distribution function (CDF) probablity is 65%, implying that the difference between the intrinsic dispersions of R06 and E94 is not significant. For , the F statistic is 1.13, the CDF probability is 66%, implying the difference between the intrinsic dispersions of R06 and E94 is not significant. A more detailed statistical comparison between the intrinsic dispersion in different samples is reported in Hao et al. (2011).
3.4 Selection of the HDP quasars
In the mixing diagram, we define a circle with a radius of 0.6 to approximate the 1.5 intrinsic dispersion region of the E94 mean SED template. We then use this region to classify outliers. As the distribution of the quasars is continuous in , different sized circles define different outlier populations. Here we simply apply the same criterion as in Hao et al. (2010) to enable ready comparison of their properties.
The Hao et al. (2010) mixing diagram readily distinguishes among the AGN-dominated, galaxy-dominated and reddening-dominated SEDs. The AGNs with SED slopes in the triangular region defined by the mixing curve and the reddening vector can be explained by the combinations of the E94 mean SED, host galaxy contamination and reddening. AGNs which lie at least above the mixing curve and the dispersion circle in the upper right corner of the mixing diagram, are defined as HDP quasars. Note that we do not suggest that HDP quasars are a distinct class. As the distribution of the quasars on the mixing diagram is continuous and the definition of the dispersion circle is somewhat arbitrary, the HDP quasars represent one extreme of the distribution of the AGN SEDs.
We further divide the HDP quasars into three classes by their positions relative to the equal slope line as in Hao et al. (2010). Class I sources (blue points) have within measurement error. These sources have a normal blue bump but flat NIR emission. Class II sources (green points) lie on the equal slope line, which indicates that the NIR emission might be the continuation of the optical accretion disk, although this turns out to be not true for all cases judging from SED fitting in the XMM-COSMOS sample (Hao et al. 2010).
We find 17 HDP quasars in the R06 sample. Most (15) of which belong to Class I, with the remainder (2) belonging to Class II. The fraction of the HDP quasars in R06 is . For 3/4 of these HDP quasars, more than 3 photometry points are used in the near-infrared for slope estimation. The two Class II HDP quasars, however, have only 3 NIR data points in their estimates.
4 HDP quasar properties
4.1 HDP Quasars in R06
| Name (SDSS J) | redshift | log | Class | aaNumber of photometry points used in the estimates. |
|---|---|---|---|---|
| ergs-1 | ||||
| 105308.24+590522.2 | 0.430 | 45.16 | I | 4 |
| 160341.44+541501.5 | 0.581 | 45.27 | I | 4 |
| 104857.92+560112.3 | 0.800 | 45.70 | I | 3 |
| 103525.05+580335.6 | 0.964 | 46.02 | I | 4 |
| 163306.12+401747.4 | 0.974 | 45.87 | I | 4 |
| 160913.18+535429.6 | 0.992 | 46.32 | I | 4 |
| 104935.76+554950.5 | 1.056 | 46.26 | II | 3bb may be overestimated (see section 3.1, Figure 4). Detailed discussion about this source is in section 4.1. |
| 104114.18+590219.4 | 1.093 | 45.93 | I | 4 |
| 104921.49+575036.6 | 1.106 | 46.08 | I | 4 |
| 171441.11+601342.9 | 1.456 | 46.05 | I | 4 |
| 104948.86+592620.7 | 2.000 | 46.22 | I | 4 |
| 103905.24+591209.1 | 2.115 | 46.50 | I | 4 |
| 104226.20+585925.8 | 2.560 | 46.48 | I | 4 |
| 160828.33+535251.9 | 2.960 | 46.61 | II | 3 |
| 164238.08+412104.7 | 3.123 | 46.76 | I | 4 |
| 104810.81+575526.9 | 3.171 | 46.71 | I | 4 |
| 105654.96+583712.4 | 3.856 | 46.81 | I | 3 |
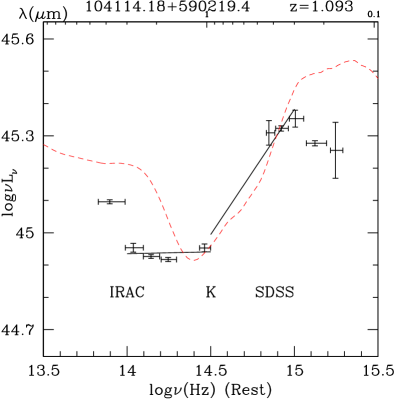
Representative R06 SEDs (Class I: top, Class II: bottom) are shown in Figure 6. The Class I source (SDSS J104114.18+590219.4) by definition show a flat near infrared SED, similar to the Class I HDP quasars found in XMM-COSMOS quasar sample (Hao et al. 2010).
The Class II source (SDSS J104935.76+554950.5) has only 3 points in both slope estimates and is at , in the range where can be overestimated by up to (Figure 4 in section 3.1). However it is hard to fit the SED with an E94 mean SED and some host. The NIR SED of this source shows an unusual discontinuous, 0.1 dex arise from the IRAC2 to IRAC1 points at (rest). This feature cannot be caused by the emission from hot dust, because a black-body, at any temperature below the maximum dust sublimation temperature of 1900 K, does not fit the feature well. The Paschen line lies in the IRAC 1 band but is unlikely to produce this feature, as to produce the IRAC1 rise would require an equivalent width of 2000Å, which is 30 times the typical value of 70Å (Landt et al. 2008). As is within the range of those for E94 quasars (section 4.2), it could be that the IRAC1 point is dominated by the continuation of the accretion disk. NIR photometry or spectra are needed to understand the emission in this range.
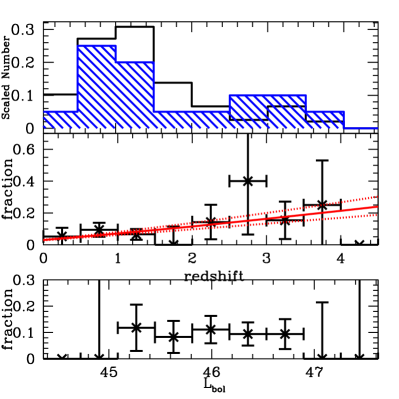
As reported in Hao et al. (2010), the fraction of the HDP quasars in the XMM-COSMOS sample evolves with redshift but not with other parameters (e.g., ). The fraction increases from 6% at low redshift () to 20% at moderate high redshift (). We checked if similar evolution behavior can be found in the R06 sample. We plotted the HDP fraction in R06 versus and in Figure 7. The HDP quasars in the R06 sample have redshifts from 0.43 to 3.86. The range of for the HDP AGNs (45.1log46.8) is almost the same as for the whole sample (44.8log47.4). The Kolmogorov-Smirnov (KS) test shows that the distributions of z and for the R06 HDP quasars are indistinguishable from the rest of the R06 sample (KS probabilities of 0.25 and 0.88). As the XMM-COSMOS sample, the HDP quasars in R06 do not show a different distribution to the other quasars in R06. However, the HDP quasars in R06 do not show redshift evolution, unlike XMM-COSMOS sample. This result might be affected by the 64 sources we have excluded due to limited photometry coverage. At redshifts , the 5 sources with no J H K photometry have fewer than three photometry points in the rest frame band, as do the 6 quasars at high redshifts . At redshifts , 53 quasars also have fewer than three photometry points in the rest frame . So quasars at low and high redshifts have more chance of being excluded from consideration, which might lead to the lack of an increase in HDP fraction in R06 at , though only has a small influence on HDP definition. The XMM-COSMOS sample has no such incompleteness bias, since the COSMOS photometry coverage is more complete and uniform.
In the XMM-COSMOS sample, the HDP fraction jumps at from to . So we re-binned the R06 sample and find that the HDP fraction is at , and at respectively, a difference, which is consistent with the results in the XMM-COSMOS sample. We over-plot XMM-COSMOS fit of the HDP fraction versus (red lines, , Hao et al. 2010). The HDP fraction versus relationship in the two samples do not disagree.
Because of the poorly sampled SED at due to limited NIR photometry in the R06 sample, we could not make robust estimates of the dust covering factor () or the outer edge of the accretion disk ().
4.2 HDP Quasars in E94
| Object | Name | redshift | log | log() | ||||||||
|---|---|---|---|---|---|---|---|---|---|---|---|---|
| ergs-1 | K | pc2 | % | K | pc | |||||||
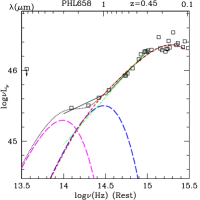
| Q0003+158 | PHL 658 | 0.45 | 46.5 | 9.311Reference: Vestergaard & Peterson (2006) | 0.13 | 1200 | 8.00 | 6 | 3700 | 0.6 | 3200 | 11 |
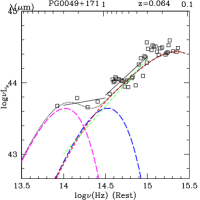
| Q0049+171 | PG 0049+171 | 0.064 | 44.8 | 8.311Reference: Vestergaard & Peterson (2006) | 0.03 | 1300 | 0.13 | 11 | 4000 | 0.06 | 2700 | 11 |
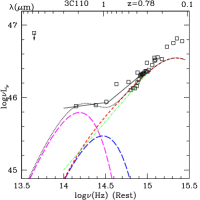
| Q0414-060 | 3C110 | 0.78 | 47.0 | 9.922Reference: Marziani et al. (2010) | 0.10 | 1900 | 3.80 | 18 | 3600 | 0.4 | 370 | 13 |
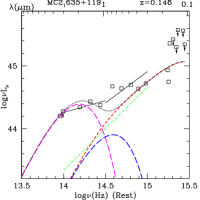
| Q1635+119 | MC2 1635+119 | 0.146 | 45.4 | 8.133Reference: Woo et al. (2002) | 0.16 | 1900 | 0.15 | 21 | 4800 | 0.08 | 6300 | 9 |
The fraction of HDP AGNs in E94 is . Because the sample size of E94 is 10 times smaller than that of the XMM-COSMOS type 1 AGN sample, the error on the fraction is much larger. A KS test shows that the distributions of and for these HDP quasars are indistinguishable from the rest of the E94 sample (with KS probabilities of 0.5 and 0.6 respectively). These results agrees with the XMM-COSMOS sample that for low redshift quasars, the fraction of the HDP do not evolve with and .
As the E94 SEDs are all corrected for host galaxy contributions, we fit the SED with just two components: an accretion disk (using a standard Schwarzschild -disk model, with electron scattering and Comptonization; Siemiginowska et al. 1995), and a hot dust component (using a single temperature black-body). The black hole masses for these four quasars, reported in Vestergaard & Peterson (2006), Marziani et al. (2010) and Woo et al. (2002), is listed in Table 2. Their accretion rates (expressed as their Eddington ratios, ) are calculated from and . We use the accretion disk model (Siemiginowska et al. 1995) for the particular black hole masses and the accretion rates for each quasar and show the results in Figure 8.
4.2.1 Covering Factors of E94 HDP Quasars
Following the same method as in Hao et al. (2010), the dust covering factor () was estimated as the ratio of the dust emission area () to the area at the dust evaporation radius (). comes from the normalization of the black-body fit. The dust evaporation radius () is estimated from (Barvainis 1987), where is the total ultraviolet (1m–912Å) luminosity in units of erg s-1, and is the maximum dust temperature allowed by the SED, in units of 1500 K. The typical errors on the E94 photometry in the near-infrared are dex. This produces an error on the dust temperature estimation, , and an error on the normalization, . The error on is thus .
4.2.2 Accretion Disk Outer Radii of E94 HDP Quasars
The outer accretion disk radius is estimated from the standard –disk model formula (Frank, King & Raine, 2002)
where , , and . We assume , . Thus .
The error in the disk temperature estimates from the E94 photometric errors is . Unfortunately, black hole mass estimates from mass scaling relationships have an error (Vestergaard & Peterson 2006, Peterson 2010), so . In terms of Schwarzschild radii (), .
We can also express this radius in terms of the gravitational instability radius of the accretion disk (, Goodman 2003), which is the radius beyond which the disk is unstable to self-gravity and should break up. As , . Hence, .
The results are reported in Table 2. They turn out to be comparable to the HDP quasars in the XMM-COSMOS sample in that , a surprisingly large value.
5 Discussion and Conclusions
5.1 Comparison with COSMOS HDP Quasars
We find a similar fraction of HDP quasars in the optically selected R06 and E94 samples as in the X-ray selected XMM-COSMOS sample of Hao et al. (2010): in the R06 sample and in E94 sample. This similarity indicates that these extreme AGNs are fairly common even in optically selected samples, though they were not previously recognized.
The XMM-COSMOS quasar sample and the R06 sample have similar redshift coverage. In contrast to the XMM-COSMOS sample, however, the fraction of the HDP in R06 does not show significant evolution with redshift according to the KS test result. This difference might be caused by the exclusion of the 64 sources in certain redshift range due to the limit near-IR photometry. The evolution of the HDP fraction in R06 sample is ill-determined but generally agrees with the HDP of XMM-COSMOS sample (Figure 7).
In the small E94 sample at low , the redshifts and luminosities of the HDP quasars are indistinguishable from the normal type 1 AGNs. This is consistent with the XMM-COSMOS sample, as for low redshift sources (), the HDP fraction does not evolve with redshift and luminosity.
All of the HDP quasars in R06 are Class I and II. In comparison, the XMM-COSMOS sample has 27% (11 out of 41) Class III HDP quasars. We compare the Class III distribution versus Class I and II in the R06 HDP and XMM-COSMOS HDP samples using the Fisher exact test (Wall & Jenkins 2003). The probability that the two HDP samples have the same class distribution is 1.4%. The SEDs of the Class III HDP quasars have stronger galaxy contribution than Class I and II. So R06 includes fewer sources with strong galaxy contribution than XMM-COSMOS. This is expected, as the R06 sample is selected by optical colors, and will exclude low AGN-to-galaxy contrast objects. The XMM-COSMOS sample, instead, is X-ray selected, and includes sources with strong galaxy contributions.
In E94, the dust covering factor of the HDP quasars ranges from 6% to 21%, similar to the XMM-COSMOS HDP quasars (Hao et al. 2010). A small dust covering factor was proposed long ago in several quasars. For example, the spectropolarimetry analysis of the quasar OI 287 showed that the broad Balmer lines are polarized the same way as the continuum, while the forbidden lines have zero intrinsic polarization, suggesting a thin ‘torus’ (Goodrich & Miller, 1988).
The outer edge of the accretion disk in E94 (Table 2) ranges from 0.06pc to 0.6pc and from 370 to 6300, which are 10 times greater than the gravitational instability radius (Goodman 2003). A similar extension of the disk spectrum into the NIR uncovered by polarized light, was found by Kishimoto et al. (2008). The outer radius of the accretion disk is further out than expected by simple -disk theory. For the R06 sample, the limitations of the photometry prevents the accurate estimation of these quantities.
5.2 HDP Quasars and IR Quasar Selection
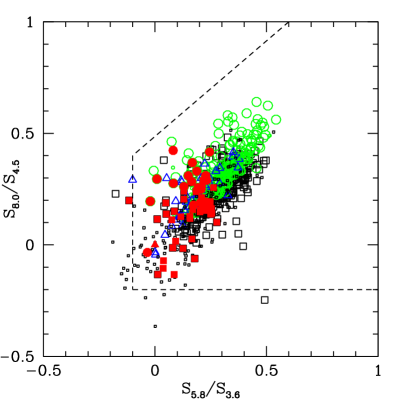
We checked whether the HDP quasars lie within the Lacy et al. (2004) color-selection region for quasars (Figure 9). Most of the HDP quasars lie in the bottom left of the quasar region. Although their hot dust emission is weak, it is still sufficient to differentiate them from starburst galaxies. The HDP quasars are one of the extreme of the variety of the AGN SEDs. AGNs with galaxy-dominated SEDs lie in the same region. The Lacy et al. (2004) color-color plot does not distinguish the HDP quasars from galaxy-dominated quasars.
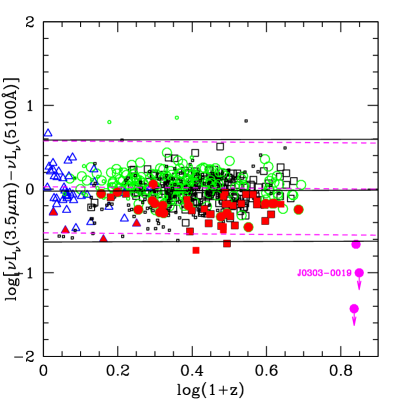
5.3 Comparison with Jiang et al. Hot-Dust-Free Quasars
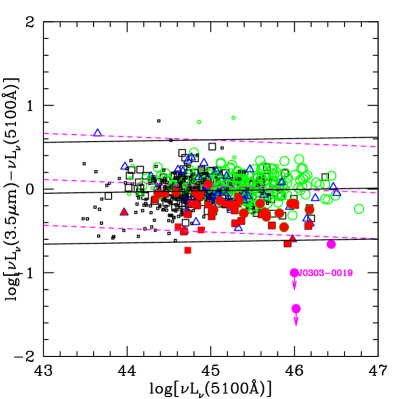
Jiang et al. (2010) introduced the rest-frame 3.5m to 5100Å luminosity ratio as an indicator of the hot-dust abundance. They concluded that there are no low redshift counterparts to the two hot-dust-free quasars J0005-0006 and J0303-0019. We reproduce the Jiang et al. (2010) plot in Figure 10 for the XMM-COSMOS, R06 and E94 samples. The HDP quasars from COSMOS, R06 and E94 (red points) do lie at the bottom edge of the distribution, but are not as extreme as the two Jiang et al. ‘hot-dust-free’ quasars. However, the ratio alone cannot distinguish the HDP from the galaxy -dominated SED shape (e.g., small black points), because they have similar rest frame 3.5 m to 5100Å luminosity ratios.
We plot the 6 quasars from Jiang et al. (2010) on the mixing diagram (Figure 5, magenta dots). We find that three of the 6 Jiang et al. (2010) quasars (J0005-0006, J0303-0019 and J1411+1217) qualify as HDP quasars. This HDP fraction at suggests, at low significance, that HDP quasars fraction continue to grow with redshift. All three are class II, i.e. their NIR emission may be a continuation of the accretion disk. J1411+1217, which was classified as a normal quasar in Jiang et al. (2010), is actually HDP by our criteria.
One difficulty with is that this ratio does not allow for a range in optical slope, such as would be induced by moderate reddening. The slope for the rest frame optical SED of J0303-0019 () is flatter than a standard accretion disk, so that a continuation of the power law to the rest frame infrared underestimates the hot dust contribution. De-reddening the optical SED leads to a requirement for a host dust excess. So this quasar should be counted as “hot-dust-poor” rather than “hot-dust-free”. Another difficulty with is that sources with weak hot dust emission but some cool dust emission are not selected by this parameter (e.g. XMM-COSMOS HDP quasar XID=96, Hao et al. 2010). Defining an index based on only two rest-frame wavelength band is not so effective at low redshift. The mixing diagram of Figure 5 is more useful in selecting the outliers.
5.4 Origin of the HDP Quasars
The origin of HDP quasars is unknown. As for the COSMOS HDP quasars discussed in Hao et al. (2010), the E94 and R06 HDP quasars are at , when the universe is more than 2 Gyr old. They have more than 1 Gyr from reionization to form a torus. So they cannot be the first generation of quasars. They are also luminous enough, and have high enough accretion rates, to support a dusty torus (Elitzur & Ho 2009).
Either the hot dust is destroyed (dynamically or by radiation), or the dust is not centered on the SMBH, i.e., an off-nuclear AGN (Blecha et al. 2011, 2008, Guedes et al. 2010, Volonteri & Madau 2008). When an SMBH recoils (or is kicked-out), it is possible bring along the adjacent broad line region, but not the dusty torus which, being further out, is less tightly bound to the SMBH (Loeb 2007). The dust is thus not centered on the SMBH, i.e. an off-nuclear AGN. A good candidate for a recoiling BH has been found in the COSMOS sample (Civano et al. 2010), although it is not included in the XMM-COSMOS HDP sample due to the galaxy-dominated NIR–OPT SED shape.
Volonteri & Madau (2008) estimated the cumulative number of off-nuclear AGNs (offset′′ ) per square degree versus redshift. Their lower limit on the number of off-nuclear AGNs is at , at , and at . Considering the COSMOS field is , the Volonteri & Madau (2008) prediction is consistent with the cumulative number of XMM-COSMOS HDP AGNs ( at , at , at ). A detailed comparison between the theoretical distribution and the HDP evolution will be reported in a following paper. We could not make similar estimates for the R06 and E94 samples, because the survey areas are not well defined.
Alternatively, the existence of HDP quasars in samples with different selection methods and the continuous distribution of dust covering factor imply that the origin of HDP quasars could be related to the AGN structure. Misaligned disks will result from discrete isotropic accretion events (Volonteri et al. 2007), which will lead to a wide range of covering factors (Lawrence & Elvis 2010). For disks with tilt-only warps (i.e. with no rotation of the line of nodes), of the type 1 AGNs will have covering factors less than 20% (Lawrence & Elvis 2010). This agrees with the HDP fraction in all three samples.
5.5 Prospects
The ongoing UKIDSS and WISE surveys will expand the available HDP samples greatly, especially in the range, where evolution can then be sought with high sensitivity.
The Hao et al. (2010) mixing diagram is a useful tool for selecting non-standard quasar SEDs.
6 Acknowledgments
We thank Michael Strauss and Brandon Kelly for suggestions that greatly improved the paper. This work was supported by NASA Chandra grant number GO7-8136A (HH, ME, FC). This work is based in part on data obtained as part of the UKIRT Infrared Deep Sky Survey.
References
- Barvainis (1987) Barvainis, R. 1987, ApJ, 320, 537
- Blecha & Loeb (2008) Blecha, L. & Loeb, A. 2008, MNRAS, 390, 1311
- Blecha et al. (2011) Blecha, L., Cox, T. J., Loeb, A. & Hernquist, L. 2011, MNRAS, submitted, astro-ph: 1009.4940
- Brusa et al. (2010) Brusa, M. et al. 2010, ApJ, 716, 348
- Casali et al. (2007) Casali, M., et al. 2007, A&A, 467, 777
- Civano (2010) Civano, F., et al. 2010, ApJ, 717, 209
- Coleman, Wu & Weedman (1980) Coleman, G. D., Wu, C. C., & Weedman, D. W. 1980, ApJS, 43, 393
- Donley et al. (2008) Donley, J. L., Rieke, G. H., Pérez-González, P.G. & Barro, G. 2008, ApJ, 687, 111
- Elvis et al. (2011) Elvis, M., et al. 2010, ApJ in preparation
- Elvis et al. (1994) Elvis, M. et al. 1994, ApJS, 95, 1
- Elitzur & Ho (2009) Elitzur, M. & Ho, Luis C. 2009, ApJL, 701, 91
- Frank, King & Raine (2002) Frank, J., King, A. & Raine, D., 2002, Accretion Power in Astrophysics (Cambridge University Press)
- Goodman (2003) Goodman, J., 2003, MNRAS, 339, 937
- Goodrich & Miller (1988) Goodrich, R. W. & Miller, J. S. 1988, ApJ, 331, 332
- Gregg et al. (2002) Gregg, M. D., Lacy, M., White, R. L., Glikman, E., Helfand, D., Becker, R. H. & Brotherton, M. S. 2002, ApJ, 564, 133
- Guedes et al. (2010) Guedes, J., Madau, P., Mayer, L., & Callegari, S. 2010, ApJ, submitted, astro-ph 1008.2032
- Hambly et al. (2008) Hambly, N. C., et al. 2008, MNRAS, 384, 637
- Hao et al. (2010) Hao, H., et al. 2010, ApJL 724, L59
- Hatziminaoglou et al. (2008) Hatziminaoglou, E. et al., 2008, MNRAS, 386, 1252
- Hewett et al. (2006) Hewett, P. C., Warren, S. J., Legett, S. K. & Hodgkin, S. T. 2006, MNRAS, 367, 454
- Hodgkin et al. (2009) Hodgkin, S. T., Irwin, M. J., Hewett, P. C. & Warren, S. J. 2009, MNRAS, 394, 675
- Irwin et al. (2009, in prep) Irwin, M. J. et al. 2009 in preparation
- Jiang et al. (2010) Jiang, L. et al. 2010, Nature, 464, 380
- Kishimoto et al. (2008) Kishimoto, M., Antonucci, R., Blaes, O., Lawrence, A., Boisson, C., Albrecht, M., & Leipski, C. 2008, Nature, 454, 492
- Komatsu et al. (2009) Komatsu, E., et al. 2009, ApJS, 180, 330
- Krolik & Begelman (1988) Krolik, J. H. & Begelman, M. C. 1988, ApJ, 329, 702
- Lacy et al. (2007) Lacy, M., Petric, A. O., Sajina, A., Canalizo, G., Storrie-Lombardi, L. J., Armus, L., Fadda, D. & Marleau, F. R. 2007, AJ, 133, 186
- Lacy et al. (2004) Lacy, M., et al. 2004, ApJS, 154, 166
- Lacy et al. (2005) Lacy, M., et al. 2005, ApJS, 161, 41
- Landt et al. (2008) Landt, H. et al. 2008, ApJS, 174, 282
- Lawrence et al. (2007) Lawrence, A. et al. 2007, MNRAS, 379, 1599
- Lawrence & Elvis (2010) Lawrence, A. & Elvis, M. 2010, ApJ, 714, 561
- Loeb (2007) Loeb, A. 2007, Phys. Rev. Lett., 99, 041103
- Marziani et al. (2010) Marziani, P. et al. 2010, MNRAS, accepted., astro-ph 1007.3187
- Miley et al. (1985) Miley, G. K., Neugebauer, G. & Soifer, B. T. 1985, ApJ, 293, 11
- Peterson (2010) Peterson, B. M. 2010, IAUS, 267, 151
- Polletta et al. (2007) Polletta, M., et al. 2007, ApJ, 663, 81
- Richards et al. (2003) Richards, G. T., et al. 2003, AJ, 126, 1131
- Richards et al. (2006) Richards, G. T., et al. 2006, ApJS, 166, 470
- Schimidt & Green (1983) Schimidt, M. & Green, R. F. 1983, ApJ, 269, 352
- Schneider et al. (2005) Schneider, D. P., et al., AJ, 130, 367
- Siemiginowska et al. (1995) Siemiginowska,A., Kuhn, O., Elvis, M., Fiore, F., McDowell, J. & Wilkes, B. J. 1995, ApJ, 454, 77
- Stern et al. (2005) Stern, D. et al. 2005, ApJ, 631, 163
- Suganuma et al. (2006) Suganuma, M., et al. 2006, ApJ, 639, 46
- Surace et al. (2005) Surace, J. A., et al. 2006, ASPC, 357, 223
- Vanden Berk et al. (2004) Vanden Berk, D. E., et al., 2004, ApJ, 601, 692
- Vestergaard & Peterson (2006) Vestergaard, M. & Peterson, B. M. 2006, ApJ, 641, 689
- Volonteri et al. (2007) Volonteri, M. , Sikora, M. & Lasota, J. 2007, ApJ, 667, 704
- Volonteri & Madau (2008) Volonteri, M. & Madau, P. 2008, ApJL, 687, 57
- Wall & Jenkins (2003) Wall, J. V. & Jenkins, C. R. 2003, Practical Statistics for Astronomers (Cambridge University Press)
- Woo et al. (2002) Woo, J. et al. 2002, ApJ, 579, 530